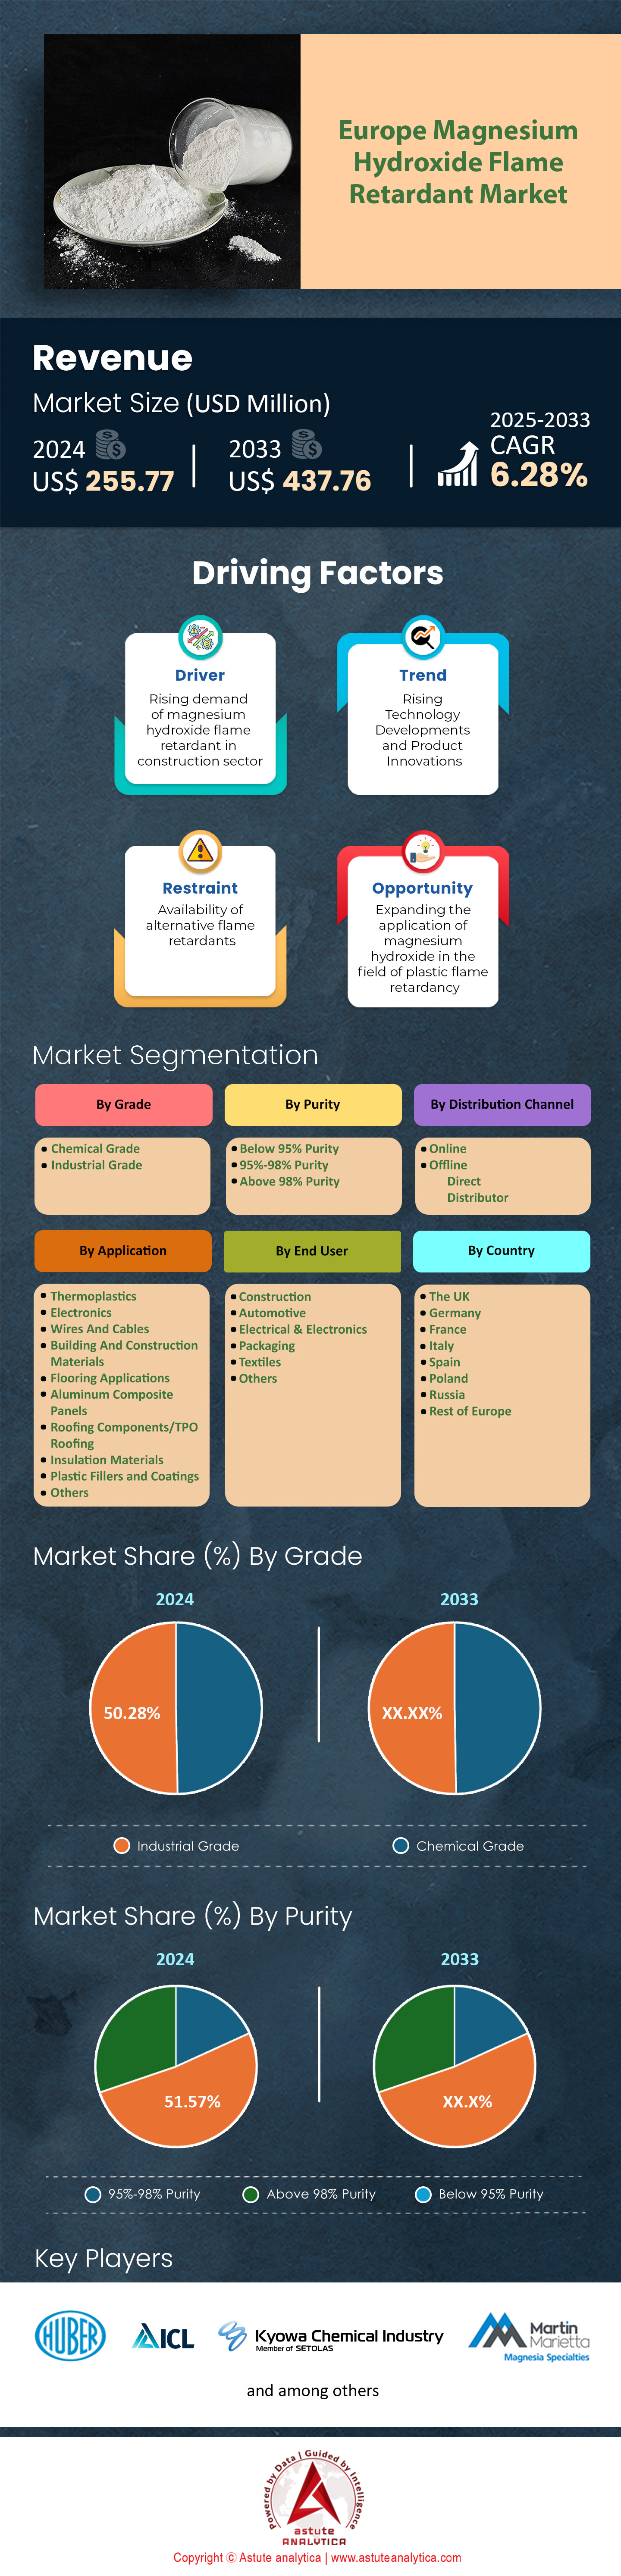
Europe Magnesium Hydroxide Flame Retardant Market: By Grade (Chemical Grade and Industrial Grade); Purity (Below 95% Purity, 95%-98% Purity, Above 98% Purity); Application (Thermoplastics, Electronics, Wires And Cables, Building And Construction Materials, Flooring Applications, Aluminum Composite Panels, Roofing Components/TPO Roofing, Insulation Materials, Plastic Fillers and Coatings, Others); End Users (Construction, Automotive, Electrical & Electronics, Packaging, Textiles, Others); Regional Countries—Market Size, Industry Dynamics, Opportunity Analysis and Forecast for 2025–2033
- Last Updated: Apr-2025 | Format:
![pdf]()
![powerpoint]()
![excel]() | Report ID: AA04251291 | Delivery: Immediate Access
| Report ID: AA04251291 | Delivery: Immediate Access


 | Report ID: AA04251291 | Delivery: Immediate Access
 Table: 1 PESTLE Impact Analysis : Political Factors
Table: 2 PESTLE Impact Analysis : Economic Factors
Table: 3 PESTLE Impact Analysis : Social Factors
Table: 4 PESTLE Impact Analysis : Technological Factors
Table: 5 PESTLE Impact Analysis : Legal Factors
Table: 6 PESTLE Impact Analysis : Environmental Factors
Table: 7 Driver : Top Exporters of Insulated Wire in 2023
Table: 8 Driver : Top Importers of Insulated Wire in 2023
Table: 9 Restraint : Top Exporters of Aluminium hydroxide in 2023
Table: 10 Restraint : Top Importers of Aluminium hydroxide in 2023
Table: 11 Market Dynamics And Trends: Impact Analysis of Market Dynamics
Table: 12 Europe Magnesium Hydroxide Flame Retardant Market Size (US$ Mn), By Grade, 2020-2033
Table: 13 Product Price Analysis: Grade -based Price Analysis
Table: 14 Europe Magnesium Hydroxide Flame Retardant Market Size (000' Tons), By Grade, 2020-2033
Table: 15 Europe Magnesium Hydroxide Flame Retardant Market Size (US$ Mn), By Purity, 2020-2033
Table: 16 Europe Magnesium Hydroxide Flame Retardant Market Size (000' Tons), By Purity, 2020-2033
Table: 17 Europe Magnesium Hydroxide Flame Retardant Market Size (US$ Mn), By Application, 2020-2033
Table: 18 Europe Magnesium Hydroxide Flame Retardant Market Size (000' Tons), By Application, 2020-2033
Table: 19 Europe Magnesium Hydroxide Flame Retardant Market Size (US$ Mn), By End User, 2020-2033
Table: 20 Europe Magnesium Hydroxide Flame Retardant Market Size (000' Tons), By End User, 2020-2033
Table: 21 Europe Magnesium Hydroxide Flame Retardant Market Size (US$ Mn), By End User- By Application, 2020-2033
Table: 22 Europe Magnesium Hydroxide Flame Retardant Market Size (000' Tons), By End User- By Application, 2020-2033
Table: 23 Europe Magnesium Hydroxide Flame Retardant Market Size (US$ Mn), By Distribution Channel, 2020-2033
Table: 24 Europe Magnesium Hydroxide Flame Retardant Market Size (000' Tons), By Distribution Channel, 2020-2033
Table: 25 Europe Magnesium Hydroxide Flame Retardant Market Size (US$ Mn), By Country, 2020-2033
Table: 26 Europe Magnesium Hydroxide Flame Retardant Market Size (000' Tons), By Country, 2020-2033
Table: 27 UK Magnesium Hydroxide Flame Retardant Market Size (US$ Mn), By Grade, 2020-2033
Table: 28 UK Magnesium Hydroxide Flame Retardant Market Size (000' Tons), By Grade, 2020-2033
Table: 29 UK Magnesium Hydroxide Flame Retardant Market Size (US$ Mn), By Purity, 2020-2033
Table: 30 UK Magnesium Hydroxide Flame Retardant Market Size (000' Tons), By Purity, 2020-2033
Table: 31 UK Magnesium Hydroxide Flame Retardant Market Size (US$ Mn), By Application, 2020-2033
Table: 32 UK Magnesium Hydroxide Flame Retardant Market Size (000' Tons), By Application, 2020-2033
Table: 33 UK Magnesium Hydroxide Flame Retardant Market Size (US$ Mn), By End User, 2020-2033
Table: 34 UK Magnesium Hydroxide Flame Retardant Market Size (000' Tons), By End User, 2020-2033
Table: 35 UK Magnesium Hydroxide Flame Retardant Market Size (US$ Mn), By End User- By Application, 2020-2033
Table: 36 UK Magnesium Hydroxide Flame Retardant Market Size (000' Tons), By End User- By Application, 2020-2033
Table: 37 UK Magnesium Hydroxide Flame Retardant Market Size (US$ Mn), By Distribution Channel, 2020-2033
Table: 38 UK Magnesium Hydroxide Flame Retardant Market Size (000' Tons), By Distribution Channel, 2020-2033
Table: 39 Germany Magnesium Hydroxide Flame Retardant Market Size (US$ Mn), By Grade, 2020-2033
Table: 40 Germany Magnesium Hydroxide Flame Retardant Market Size (000' Tons), By Grade, 2020-2033
Table: 41 Germany Magnesium Hydroxide Flame Retardant Market Size (US$ Mn), By Purity, 2020-2033
Table: 42 Germany Magnesium Hydroxide Flame Retardant Market Size (000' Tons), By Purity, 2020-2033
Table: 43 Germany Magnesium Hydroxide Flame Retardant Market Size (US$ Mn), By Application, 2020-2033
Table: 44 Germany Magnesium Hydroxide Flame Retardant Market Size (000' Tons), By Application, 2020-2033
Table: 45 Germany Magnesium Hydroxide Flame Retardant Market Size (US$ Mn), By End User, 2020-2033
Table: 46 Germany Magnesium Hydroxide Flame Retardant Market Size (000' Tons), By End User, 2020-2033
Table: 47 Germany Magnesium Hydroxide Flame Retardant Market Size (US$ Mn), By End User- By Application, 2020-2033
Table: 48 Germany Magnesium Hydroxide Flame Retardant Market Size (000' Tons), By End User- By Application, 2020-2033
Table: 49 Germany Magnesium Hydroxide Flame Retardant Market Size (US$ Mn), By Distribution Channel, 2020-2033
Table: 50 Germany Magnesium Hydroxide Flame Retardant Market Size (000' Tons), By Distribution Channel, 2020-2033
Table: 51 France Magnesium Hydroxide Flame Retardant Market Size (US$ Mn), By Grade, 2020-2033
Table: 52 France Magnesium Hydroxide Flame Retardant Market Size (000' Tons), By Grade, 2020-2033
Table: 53 France Magnesium Hydroxide Flame Retardant Market Size (US$ Mn), By Purity, 2020-2033
Table: 54 France Magnesium Hydroxide Flame Retardant Market Size (000' Tons), By Purity, 2020-2033
Table: 55 France Magnesium Hydroxide Flame Retardant Market Size (US$ Mn), By Application, 2020-2033
Table: 56 France Magnesium Hydroxide Flame Retardant Market Size (000' Tons), By Application, 2020-2033
Table: 57 France Magnesium Hydroxide Flame Retardant Market Size (US$ Mn), By End User, 2020-2033
Table: 58 France Magnesium Hydroxide Flame Retardant Market Size (000' Tons), By End User, 2020-2033
Table: 59 France Magnesium Hydroxide Flame Retardant Market Size (US$ Mn), By End User- By Application, 2020-2033
Table: 60 France Magnesium Hydroxide Flame Retardant Market Size (000' Tons), By End User- By Application, 2020-2033
Table: 61 France Magnesium Hydroxide Flame Retardant Market Size (US$ Mn), By Distribution Channel, 2020-2033
Table: 62 France Magnesium Hydroxide Flame Retardant Market Size (000' Tons), By Distribution Channel, 2020-2033
Table: 63 Italy Magnesium Hydroxide Flame Retardant Market Size (US$ Mn), By Grade, 2020-2033
Table: 64 Italy Magnesium Hydroxide Flame Retardant Market Size (000' Tons), By Grade, 2020-2033
Table: 65 Italy Magnesium Hydroxide Flame Retardant Market Size (US$ Mn), By Purity, 2020-2033
Table: 66 Italy Magnesium Hydroxide Flame Retardant Market Size (000' Tons), By Purity, 2020-2033
Table: 67 Italy Magnesium Hydroxide Flame Retardant Market Size (US$ Mn), By Application, 2020-2033
Table: 68 Italy Magnesium Hydroxide Flame Retardant Market Size (000' Tons), By Application, 2020-2033
Table: 69 Italy Magnesium Hydroxide Flame Retardant Market Size (US$ Mn), By End User, 2020-2033
Table: 70 Italy Magnesium Hydroxide Flame Retardant Market Size (000' Tons), By End User, 2020-2033
Table: 71 Italy Magnesium Hydroxide Flame Retardant Market Size (US$ Mn), By End User- By Application, 2020-2033
Table: 72 Italy Magnesium Hydroxide Flame Retardant Market Size (000' Tons), By End User- By Application, 2020-2033
Table: 73 Italy Magnesium Hydroxide Flame Retardant Market Size (US$ Mn), By Distribution Channel, 2020-2033
Table: 74 Italy Magnesium Hydroxide Flame Retardant Market Size (000' Tons), By Distribution Channel, 2020-2033
Table: 75 Spain Magnesium Hydroxide Flame Retardant Market Size (US$ Mn), By Grade, 2020-2033
Table: 76 Spain Magnesium Hydroxide Flame Retardant Market Size (000' Tons), By Grade, 2020-2033
Table: 77 Spain Magnesium Hydroxide Flame Retardant Market Size (US$ Mn), By Purity, 2020-2033
Table: 78 Spain Magnesium Hydroxide Flame Retardant Market Size (000' Tons), By Purity, 2020-2033
Table: 79 Spain Magnesium Hydroxide Flame Retardant Market Size (US$ Mn), By Application, 2020-2033
Table: 80 Spain Magnesium Hydroxide Flame Retardant Market Size (000' Tons), By Application, 2020-2033
Table: 81 Spain Magnesium Hydroxide Flame Retardant Market Size (US$ Mn), By End User, 2020-2033
Table: 82 Spain Magnesium Hydroxide Flame Retardant Market Size (000' Tons), By End User, 2020-2033
Table: 83 Spain Magnesium Hydroxide Flame Retardant Market Size (US$ Mn), By End User- By Application, 2020-2033
Table: 84 Spain Magnesium Hydroxide Flame Retardant Market Size (000' Tons), By End User- By Application, 2020-2033
Table: 85 Spain Magnesium Hydroxide Flame Retardant Market Size (US$ Mn), By Distribution Channel, 2020-2033
Table: 86 Spain Magnesium Hydroxide Flame Retardant Market Size (000' Tons), By Distribution Channel, 2020-2033
Table: 87 Poland Magnesium Hydroxide Flame Retardant Market Size (US$ Mn), By Grade, 2020-2033
Table: 88 Poland Magnesium Hydroxide Flame Retardant Market Size (000' Tons), By Grade, 2020-2033
Table: 89 Poland Magnesium Hydroxide Flame Retardant Market Size (US$ Mn), By Purity, 2020-2033
Table: 90 Poland Magnesium Hydroxide Flame Retardant Market Size (000' Tons), By Purity, 2020-2033
Table: 91 Poland Magnesium Hydroxide Flame Retardant Market Size (US$ Mn), By Application, 2020-2033
Table: 92 Poland Magnesium Hydroxide Flame Retardant Market Size (000' Tons), By Application, 2020-2033
Table: 93 Poland Magnesium Hydroxide Flame Retardant Market Size (US$ Mn), By End User, 2020-2033
Table: 94 Poland Magnesium Hydroxide Flame Retardant Market Size (000' Tons), By End User, 2020-2033
Table: 95 Poland Magnesium Hydroxide Flame Retardant Market Size (US$ Mn), By End User- By Application, 2020-2033
Table: 96 Poland Magnesium Hydroxide Flame Retardant Market Size (000' Tons), By End User- By Application, 2020-2033
Table: 97 Poland Magnesium Hydroxide Flame Retardant Market Size (US$ Mn), By Distribution Channel, 2020-2033
Table: 98 Poland Magnesium Hydroxide Flame Retardant Market Size (000' Tons), By Distribution Channel, 2020-2033
Table: 99 Russia Magnesium Hydroxide Flame Retardant Market Size (US$ Mn), By Grade, 2020-2033
Table: 100 Russia Magnesium Hydroxide Flame Retardant Market Size (000' Tons), By Grade, 2020-2033
Table: 101 Russia Magnesium Hydroxide Flame Retardant Market Size (US$ Mn), By Purity, 2020-2033
Table: 102 Russia Magnesium Hydroxide Flame Retardant Market Size (000' Tons), By Purity, 2020-2033
Table: 103 Russia Magnesium Hydroxide Flame Retardant Market Size (US$ Mn), By Application, 2020-2033
Table: 104 Russia Magnesium Hydroxide Flame Retardant Market Size (000' Tons), By Application, 2020-2033
Table: 105 Russia Magnesium Hydroxide Flame Retardant Market Size (US$ Mn), By End User, 2020-2033
Table: 106 Russia Magnesium Hydroxide Flame Retardant Market Size (000' Tons), By End User, 2020-2033
Table: 107 Russia Magnesium Hydroxide Flame Retardant Market Size (US$ Mn), By End User- By Application, 2020-2033
Table: 108 Russia Magnesium Hydroxide Flame Retardant Market Size (000' Tons), By End User- By Application, 2020-2033
Table: 109 Russia Magnesium Hydroxide Flame Retardant Market Size (US$ Mn), By Distribution Channel, 2020-2033
Table: 110 Russia Magnesium Hydroxide Flame Retardant Market Size (000' Tons), By Distribution Channel, 2020-2033
Table: 111 Rest of Europe Magnesium Hydroxide Flame Retardant Market Size (US$ Mn), By Grade, 2020-2033
Table: 112 Rest of Europe Magnesium Hydroxide Flame Retardant Market Size (000' Tons), By Grade, 2020-2033
Table: 113 Rest of Europe Magnesium Hydroxide Flame Retardant Market Size (US$ Mn), By Purity, 2020-2033
Table: 114 Rest of Europe Magnesium Hydroxide Flame Retardant Market Size (000' Tons), By Purity, 2020-2033
Table: 115 Rest of Europe Magnesium Hydroxide Flame Retardant Market Size (US$ Mn), By Application, 2020-2033
Table: 116 Rest of Europe Magnesium Hydroxide Flame Retardant Market Size (000' Tons), By Application, 2020-2033
Table: 117 Rest of Europe Magnesium Hydroxide Flame Retardant Market Size (US$ Mn), By End User, 2020-2033
Table: 118 Rest of Europe Magnesium Hydroxide Flame Retardant Market Size (000' Tons), By End User, 2020-2033
Table: 119 Rest of Europe Magnesium Hydroxide Flame Retardant Market Size (US$ Mn), By End User- By Application, 2020-2033
Table: 120 Rest of Europe Magnesium Hydroxide Flame Retardant Market Size (000' Tons), By End User- By Application, 2020-2033
Table: 121 Rest of Europe Magnesium Hydroxide Flame Retardant Market Size (US$ Mn), By Distribution Channel, 2020-2033
Table: 122 Rest of Europe Magnesium Hydroxide Flame Retardant Market Size (000' Tons), By Distribution Channel, 2020-2033
Table: 123 ICL Group Ltd.: Offering
Table: 124 ICL Group Ltd.: Financial Analysis
Table: 125 J.M. Huber Corporation: Recent Developments
Table: 126 J.M. Huber Corporation: Offering
Table: 127 Europiren B.V. : Offering
Table: 128 NikoMag : Recent Developments
Table: 129 NikoMag : Offering
Table: 130 Nuova Sima s.r.l. : Recent Developments
Table: 131 Nuova Sima s.r.l. : Offering
Table: 132 Kyowa Chemical Industry Co. Ltd.: Product
Table: 133 Alpha Calcit Group : Offering
Table: 134 IntoChemicals B.V. : Offering
Table: 135 Martin Marietta Magnesia Specialties, LLC : Product
Table: 136 Martin Marietta Magnesia Specialties, LLC.: Financial Analysis
Table: 137 Go Yen Chemical Industrial Co. Ltd.: Offering
Table: 138 Other Prominent Players
Table: 139 Annexure : Secondary Sources
Figure: 1 Executive Summary : Europe Magnesium Hydroxide Flame Retardant Market Size and Forecast, 2020-2033 (US$ Mn)
Figure: 2 Executive Summary : Europe Magnesium Hydroxide Flame Retardant Market Volume and Forecast, 2020-2033 (000’ Tons)
Figure: 3 Industry Outlook : EXIM of Magnesium Hydroxide and Peroxide, 2023
Figure: 4 Industry Outlook : Exporters Magnesium Hydroxide and Peroxide- By Country, 2023,
Figure: 5 Industry Outlook : Importers of Magnesium Hydroxide and Peroxide- By Country, 2023
Figure: 6 Adoption Analysis : Adoption Rate (%), By Grade (in Terms of Revenue)
Figure: 7 Adoption Analysis : Europe Magnesium Hydroxide Flame Retardant Market, By Y-o-Y (%), 2020-2033
Figure: 8 Adoption Analysis : Revenue Comparison, By Purity (in US$ Mn)
Figure: 9 Driver : Vehicle Production in European Union 27 countries + UK (Units)
Figure: 10 Opportunity : European plastics production (in MT), 2023
Figure: 11 Trend : Rising Technology Developments and Product Innovations (2/2)
Figure: 12 Product Price Analysis : Grade -based Price Analysis, By Y-o-Y (%), 2021-2033
Figure: 13 Competitive Dashboard : Market Share Analysis by Company, Based on Revenue (2024)
Figure: 14 Europe Magnesium Hydroxide Flame Retardant Market, By Grade, CAGR (%), 2024-2033
Figure: 15 Europe Magnesium Hydroxide Flame Retardant Market Share (%), By Grade, 2024
Figure: 16 Europe Magnesium Hydroxide Flame Retardant Market Share (%), By Grade, 2033
Figure: 17 Europe Magnesium Hydroxide Flame Retardant Market, By Purity, CAGR (%), 2024-2033
Figure: 18 Europe Magnesium Hydroxide Flame Retardant Market Share (%), By Purity, 2024
Figure: 19 Europe Magnesium Hydroxide Flame Retardant Market Share (%), By Purity, 2033
Figure: 20 Europe Magnesium Hydroxide Flame Retardant Market, By Application, CAGR (%), 2024-2033
Figure: 21 Europe Magnesium Hydroxide Flame Retardant Market Share (%), By Application, 2024
Figure: 22 Europe Magnesium Hydroxide Flame Retardant Market Share (%), By Application, 2033
Figure: 23 Europe Magnesium Hydroxide Flame Retardant Market, By End User, CAGR (%), 2024-2033
Figure: 24 Europe Magnesium Hydroxide Flame Retardant Market Share (%), By End User, 2024
Figure: 25 Europe Magnesium Hydroxide Flame Retardant Market Share (%), By End User, 2033
Figure: 26 Europe Magnesium Hydroxide Flame Retardant Market, By Distribution Channel, CAGR (%), 2024-2033
Figure: 27 Europe Magnesium Hydroxide Flame Retardant Market Share (%), By Distribution Channel, 2024
Figure: 28 Europe Magnesium Hydroxide Flame Retardant Market Share (%), By Distribution Channel, 2033
Figure: 29 Europe Magnesium Hydroxide Flame Retardant Market, By Country, CAGR (%), 2024-2033
Figure: 30 Europe Magnesium Hydroxide Flame Retardant Market Share (%), By Country, 2024
Figure: 31 Europe Magnesium Hydroxide Flame Retardant Market Share (%), By Country, 2033
Figure: 32 UK: Highest Share (%) Segment
Figure: 33 UK: Net Opportunity Addition, in US$ Mn
Figure: 34 UK: Text Analysis
Figure: 35 UK: Opportunity Assessment, By Grade
Figure: 36 UK: Opportunity Assessment, By Purity
Figure: 37 UK: Opportunity Assessment, By Application
Figure: 38 UK: Opportunity Assessment, By End User
Figure: 39 UK: Opportunity Assessment, By Distribution Channel
Figure: 40 UK Magnesium Hydroxide Flame Retardant Market Share (%), By Grade, 2024
Figure: 41 UK Magnesium Hydroxide Flame Retardant Market Share (%), By Grade, 2033
Figure: 42 UK Magnesium Hydroxide Flame Retardant Market, By Purity, CAGR (%), 2024-2033
Figure: 43 UK Magnesium Hydroxide Flame Retardant Market Share (%), By Purity, 2024
Figure: 44 UK Magnesium Hydroxide Flame Retardant Market Share (%), By Purity, 2033
Figure: 45 UK Magnesium Hydroxide Flame Retardant Market, By Application, CAGR (%), 2024-2033
Figure: 46 UK Magnesium Hydroxide Flame Retardant Market Share (%), By Application, 2024
Figure: 47 UK Magnesium Hydroxide Flame Retardant Market Share (%), By Application, 2033
Figure: 48 UK Magnesium Hydroxide Flame Retardant Market, By End User, CAGR (%), 2024-2033
Figure: 49 UK Magnesium Hydroxide Flame Retardant Market Share (%), By End User, 2024
Figure: 50 UK Magnesium Hydroxide Flame Retardant Market Share (%), By End User, 2033
Figure: 51 UK Magnesium Hydroxide Flame Retardant Market, By Distribution Channel, CAGR (%), 2024-2033
Figure: 52 UK Magnesium Hydroxide Flame Retardant Market Share (%), By Distribution Channel, 2024
Figure: 53 UK Magnesium Hydroxide Flame Retardant Market Share (%), By Distribution Channel, 2033
Figure: 54 Germany: Highest Share (%) Segment
Figure: 55 Germany: Net Opportunity Addition, in US$ Mn
Figure: 56 Germany: Text Analysis
Figure: 57 Germany: Opportunity Assessment, By Grade
Figure: 58 Germany: Opportunity Assessment, By Purity
Figure: 59 Germany: Opportunity Assessment, By Application
Figure: 60 Germany: Opportunity Assessment, By End User
Figure: 61 Germany: Opportunity Assessment, By Distribution Channel
Figure: 62 Germany Magnesium Hydroxide Flame Retardant Market Share (%), By Grade, 2024
Figure: 63 Germany Magnesium Hydroxide Flame Retardant Market Share (%), By Grade, 2033
Figure: 64 Germany Magnesium Hydroxide Flame Retardant Market, By Purity, CAGR (%), 2024-2033
Figure: 65 Germany Magnesium Hydroxide Flame Retardant Market Share (%), By Purity, 2024
Figure: 66 Germany Magnesium Hydroxide Flame Retardant Market Share (%), By Purity, 2033
Figure: 67 Germany Magnesium Hydroxide Flame Retardant Market, By Application, CAGR (%), 2024-2033
Figure: 68 Germany Magnesium Hydroxide Flame Retardant Market Share (%), By Application, 2024
Figure: 69 Germany Magnesium Hydroxide Flame Retardant Market Share (%), By Application, 2033
Figure: 70 Germany Magnesium Hydroxide Flame Retardant Market, By End User, CAGR (%), 2024-2033
Figure: 71 Germany Magnesium Hydroxide Flame Retardant Market Share (%), By End User, 2024
Figure: 72 Germany Magnesium Hydroxide Flame Retardant Market Share (%), By End User, 2033
Figure: 73 Germany Magnesium Hydroxide Flame Retardant Market, By Distribution Channel, CAGR (%), 2024-2033
Figure: 74 Germany Magnesium Hydroxide Flame Retardant Market Share (%), By Distribution Channel, 2024
Figure: 75 Germany Magnesium Hydroxide Flame Retardant Market Share (%), By Distribution Channel, 2033
Figure: 76 France: Highest Share (%) Segment
Figure: 77 France: Net Opportunity Addition, in US$ Mn
Figure: 78 France: Text Analysis
Figure: 79 France: Opportunity Assessment, By Grade
Figure: 80 France: Opportunity Assessment, By Purity
Figure: 81 France: Opportunity Assessment, By Application
Figure: 82 France: Opportunity Assessment, By End User
Figure: 83 France: Opportunity Assessment, By Distribution Channel
Figure: 84 France Magnesium Hydroxide Flame Retardant Market Share (%), By Grade, 2024
Figure: 85 France Magnesium Hydroxide Flame Retardant Market Share (%), By Grade, 2033
Figure: 86 France Magnesium Hydroxide Flame Retardant Market, By Purity, CAGR (%), 2024-2033
Figure: 87 France Magnesium Hydroxide Flame Retardant Market Share (%), By Purity, 2024
Figure: 88 France Magnesium Hydroxide Flame Retardant Market Share (%), By Purity, 2033
Figure: 89 France Magnesium Hydroxide Flame Retardant Market, By Application, CAGR (%), 2024-2033
Figure: 90 France Magnesium Hydroxide Flame Retardant Market Share (%), By Application, 2024
Figure: 91 France Magnesium Hydroxide Flame Retardant Market Share (%), By Application, 2033
Figure: 92 France Magnesium Hydroxide Flame Retardant Market, By End User, CAGR (%), 2024-2033
Figure: 93 France Magnesium Hydroxide Flame Retardant Market Share (%), By End User, 2024
Figure: 94 France Magnesium Hydroxide Flame Retardant Market Share (%), By End User, 2033
Figure: 95 France Magnesium Hydroxide Flame Retardant Market, By Distribution Channel, CAGR (%), 2024-2033
Figure: 96 France Magnesium Hydroxide Flame Retardant Market Share (%), By Distribution Channel, 2024
Figure: 97 France Magnesium Hydroxide Flame Retardant Market Share (%), By Distribution Channel, 2033
Figure: 98 Italy: Highest Share (%) Segment
Figure: 99 Italy: Net Opportunity Addition, in US$ Mn
Figure: 100 Italy: Text Analysis
Figure: 101 Italy: Opportunity Assessment, By Grade
Figure: 102 Italy: Opportunity Assessment, By Purity
Figure: 103 Italy: Opportunity Assessment, By Application
Figure: 104 Italy: Opportunity Assessment, By End User
Figure: 105 Italy: Opportunity Assessment, By Distribution Channel
Figure: 106 Italy Magnesium Hydroxide Flame Retardant Market Share (%), By Grade, 2024
Figure: 107 Italy Magnesium Hydroxide Flame Retardant Market Share (%), By Grade, 2033
Figure: 108 Italy Magnesium Hydroxide Flame Retardant Market, By Purity, CAGR (%), 2024-2033
Figure: 109 Italy Magnesium Hydroxide Flame Retardant Market Share (%), By Purity, 2024
Figure: 110 Italy Magnesium Hydroxide Flame Retardant Market Share (%), By Purity, 2033
Figure: 111 Italy Magnesium Hydroxide Flame Retardant Market, By Application, CAGR (%), 2024-2033
Figure: 112 Italy Magnesium Hydroxide Flame Retardant Market Share (%), By Application, 2024
Figure: 113 Italy Magnesium Hydroxide Flame Retardant Market Share (%), By Application, 2033
Figure: 114 Italy Magnesium Hydroxide Flame Retardant Market, By End User, CAGR (%), 2024-2033
Figure: 115 Italy Magnesium Hydroxide Flame Retardant Market Share (%), By End User, 2024
Figure: 116 Italy Magnesium Hydroxide Flame Retardant Market Share (%), By End User, 2033
Figure: 117 Italy Magnesium Hydroxide Flame Retardant Market, By Distribution Channel, CAGR (%), 2024-2033
Figure: 118 Italy Magnesium Hydroxide Flame Retardant Market Share (%), By Distribution Channel, 2024
Figure: 119 Italy Magnesium Hydroxide Flame Retardant Market Share (%), By Distribution Channel, 2033
Figure: 120 Spain: Highest Share (%) Segment
Figure: 121 Spain: Net Opportunity Addition, in US$ Mn
Figure: 122 Spain: Text Analysis
Figure: 123 Spain: Opportunity Assessment, By Grade
Figure: 124 Spain: Opportunity Assessment, By Purity
Figure: 125 Spain: Opportunity Assessment, By Application
Figure: 126 Spain: Opportunity Assessment, By End User
Figure: 127 Spain: Opportunity Assessment, By Distribution Channel
Figure: 128 Spain Magnesium Hydroxide Flame Retardant Market Share (%), By Grade, 2024
Figure: 129 Spain Magnesium Hydroxide Flame Retardant Market Share (%), By Grade, 2033
Figure: 130 Spain Magnesium Hydroxide Flame Retardant Market, By Purity, CAGR (%), 2024-2033
Figure: 131 Spain Magnesium Hydroxide Flame Retardant Market Share (%), By Purity, 2024
Figure: 132 Spain Magnesium Hydroxide Flame Retardant Market Share (%), By Purity, 2033
Figure: 133 Spain Magnesium Hydroxide Flame Retardant Market, By Application, CAGR (%), 2024-2033
Figure: 134 Spain Magnesium Hydroxide Flame Retardant Market Share (%), By Application, 2024
Figure: 135 Spain Magnesium Hydroxide Flame Retardant Market Share (%), By Application, 2033
Figure: 136 Spain Magnesium Hydroxide Flame Retardant Market, By End User, CAGR (%), 2024-2033
Figure: 137 Spain Magnesium Hydroxide Flame Retardant Market Share (%), By End User, 2024
Figure: 138 Spain Magnesium Hydroxide Flame Retardant Market Share (%), By End User, 2033
Figure: 139 Spain Magnesium Hydroxide Flame Retardant Market, By Distribution Channel, CAGR (%), 2024-2033
Figure: 140 Spain Magnesium Hydroxide Flame Retardant Market Share (%), By Distribution Channel, 2024
Figure: 141 Spain Magnesium Hydroxide Flame Retardant Market Share (%), By Distribution Channel, 2033
Figure: 142 Poland: Highest Share (%) Segment
Figure: 143 Poland: Net Opportunity Addition, in US$ Mn
Figure: 144 Poland: Text Analysis
Figure: 145 Poland: Opportunity Assessment, By Grade
Figure: 146 Poland: Opportunity Assessment, By Purity
Figure: 147 Poland: Opportunity Assessment, By Application
Figure: 148 Poland: Opportunity Assessment, By End User
Figure: 149 Poland: Opportunity Assessment, By Distribution Channel
Figure: 150 Poland Magnesium Hydroxide Flame Retardant Market Share (%), By Grade, 2024
Figure: 151 Poland Magnesium Hydroxide Flame Retardant Market Share (%), By Grade, 2033
Figure: 152 Poland Magnesium Hydroxide Flame Retardant Market, By Purity, CAGR (%), 2024-2033
Figure: 153 Poland Magnesium Hydroxide Flame Retardant Market Share (%), By Purity, 2024
Figure: 154 Poland Magnesium Hydroxide Flame Retardant Market Share (%), By Purity, 2033
Figure: 155 Poland Magnesium Hydroxide Flame Retardant Market, By Application, CAGR (%), 2024-2033
Figure: 156 Poland Magnesium Hydroxide Flame Retardant Market Share (%), By Application, 2024
Figure: 157 Poland Magnesium Hydroxide Flame Retardant Market Share (%), By Application, 2033
Figure: 158 Poland Magnesium Hydroxide Flame Retardant Market, By End User, CAGR (%), 2024-2033
Figure: 159 Poland Magnesium Hydroxide Flame Retardant Market Share (%), By End User, 2024
Figure: 160 Poland Magnesium Hydroxide Flame Retardant Market Share (%), By End User, 2033
Figure: 161 Poland Magnesium Hydroxide Flame Retardant Market, By Distribution Channel, CAGR (%), 2024-2033
Figure: 162 Poland Magnesium Hydroxide Flame Retardant Market Share (%), By Distribution Channel, 2024
Figure: 163 Poland Magnesium Hydroxide Flame Retardant Market Share (%), By Distribution Channel, 2033
Figure: 164 Russia: Highest Share (%) Segment
Figure: 165 Russia: Net Opportunity Addition, in US$ Mn
Figure: 166 Russia: Text Analysis
Figure: 167 Russia: Opportunity Assessment, By Grade
Figure: 168 Russia: Opportunity Assessment, By Purity
Figure: 169 Russia: Opportunity Assessment, By Application
Figure: 170 Russia: Opportunity Assessment, By End User
Figure: 171 Russia: Opportunity Assessment, By Distribution Channel
Figure: 172 Russia Magnesium Hydroxide Flame Retardant Market Share (%), By Grade, 2024
Figure: 173 Russia Magnesium Hydroxide Flame Retardant Market Share (%), By Grade, 2033
Figure: 174 Russia Magnesium Hydroxide Flame Retardant Market, By Purity, CAGR (%), 2024-2033
Figure: 175 Russia Magnesium Hydroxide Flame Retardant Market Share (%), By Purity, 2024
Figure: 176 Russia Magnesium Hydroxide Flame Retardant Market Share (%), By Purity, 2033
Figure: 177 Russia Magnesium Hydroxide Flame Retardant Market, By Application, CAGR (%), 2024-2033
Figure: 178 Russia Magnesium Hydroxide Flame Retardant Market Share (%), By Application, 2024
Figure: 179 Russia Magnesium Hydroxide Flame Retardant Market Share (%), By Application, 2033
Figure: 180 Russia Magnesium Hydroxide Flame Retardant Market, By End User, CAGR (%), 2024-2033
Figure: 181 Russia Magnesium Hydroxide Flame Retardant Market Share (%), By End User, 2024
Figure: 182 Russia Magnesium Hydroxide Flame Retardant Market Share (%), By End User, 2033
Figure: 183 Russia Magnesium Hydroxide Flame Retardant Market, By Distribution Channel, CAGR (%), 2024-2033
Figure: 184 Russia Magnesium Hydroxide Flame Retardant Market Share (%), By Distribution Channel, 2024
Figure: 185 Russia Magnesium Hydroxide Flame Retardant Market Share (%), By Distribution Channel, 2033
Figure: 186 Rest of Europe: Highest Share (%) Segment
Figure: 187 Rest of Europe: Net Opportunity Addition, in US$ Mn
Figure: 188 Rest of Europe: Text Analysis
Figure: 189 Rest of Europe: Opportunity Assessment, By Grade
Figure: 190 Rest of Europe: Opportunity Assessment, By Purity
Figure: 191 Rest of Europe: Opportunity Assessment, By Application
Figure: 192 Rest of Europe: Opportunity Assessment, By End User
Figure: 193 Rest of Europe: Opportunity Assessment, By Distribution Channel
Figure: 194 Rest of Europe Magnesium Hydroxide Flame Retardant Market Share (%), By Grade, 2024
Figure: 195 Rest of Europe Magnesium Hydroxide Flame Retardant Market Share (%), By Grade, 2033
Figure: 196 Rest of Europe Magnesium Hydroxide Flame Retardant Market, By Purity, CAGR (%), 2024-2033
Figure: 197 Rest of Europe Magnesium Hydroxide Flame Retardant Market Share (%), By Purity, 2024
Figure: 198 Rest of Europe Magnesium Hydroxide Flame Retardant Market Share (%), By Purity, 2033
Figure: 199 Rest of Europe Magnesium Hydroxide Flame Retardant Market, By Application, CAGR (%), 2024-2033
Figure: 200 Rest of Europe Magnesium Hydroxide Flame Retardant Market Share (%), By Application, 2024
Figure: 201 Rest of Europe Magnesium Hydroxide Flame Retardant Market Share (%), By Application, 2033
Figure: 202 Rest of Europe Magnesium Hydroxide Flame Retardant Market, By End User, CAGR (%), 2024-2033
Figure: 203 Rest of Europe Magnesium Hydroxide Flame Retardant Market Share (%), By End User, 2024
Figure: 204 Rest of Europe Magnesium Hydroxide Flame Retardant Market Share (%), By End User, 2033
Figure: 205 Rest of Europe Magnesium Hydroxide Flame Retardant Market, By Distribution Channel, CAGR (%), 2024-2033
Figure: 206 Rest of Europe Magnesium Hydroxide Flame Retardant Market Share (%), By Distribution Channel, 2024
Figure: 207 Rest of Europe Magnesium Hydroxide Flame Retardant Market Share (%), By Distribution Channel, 2033
Figure: 208 ICL Group Ltd.: Business Revenue Segmentation, 2024
Figure: 209 ICL Group Ltd.: Geographical Revenue Segmentation, 2024
Figure: 210 Martin Marietta Magnesia Specialties, LLC: Business Area Segmentation, 2024
Figure: 211 Annexure : GDP, Current Prices (Billions of U.S. dollars)
Figure: 212 Annexure : GDP Per Capita, Current Prices (U.S. Dollars Per Capita)
Figure: 213 Annexure : Population Trend
Figure: 214 Annexure : Employment Growth By Industries


Choose License Type


Features | Type of License | ||||
Data Book | Single User |   Multi User | Corporate | ||
| e-Access | ✓ | ✓ | ✓ | ✓ | |
User Sharing | 1 User Only | 1 User Only | Up to 7 Users | Unlimited User Access | |
⨉ | ⨉ | ⨉ | ✓ | ||
Free Customization | No Free Customization | Up To 30 hrs work | Up To 60 hrs work | Up To 80 hrs work | |
Deliverable |
| ⨉ | ✓ | ✓ | ✓ |
| ✓ | ⨉ | ✓ | ✓ | |
| ⨉ | ⨉ | ⨉ | ✓ | |
Analyst Support | 2-Months Analyst Support | 4-Months Analyst Support | 7-Months Analyst Support | One Year Analyst Support | |
Free Report update in next update cycle | ⨉ | ⨉ | ⨉ | ✓ | |
Free Industry Update (Within 180 days) | ⨉ | ⨉ | ⨉ | ✓ | |
Benefit | Up to 10% off on Post Purchase | Up to 20% off on Post Purchase | Up to 30% off on Post Purchase | Up to 40% off on Post Purchase | |