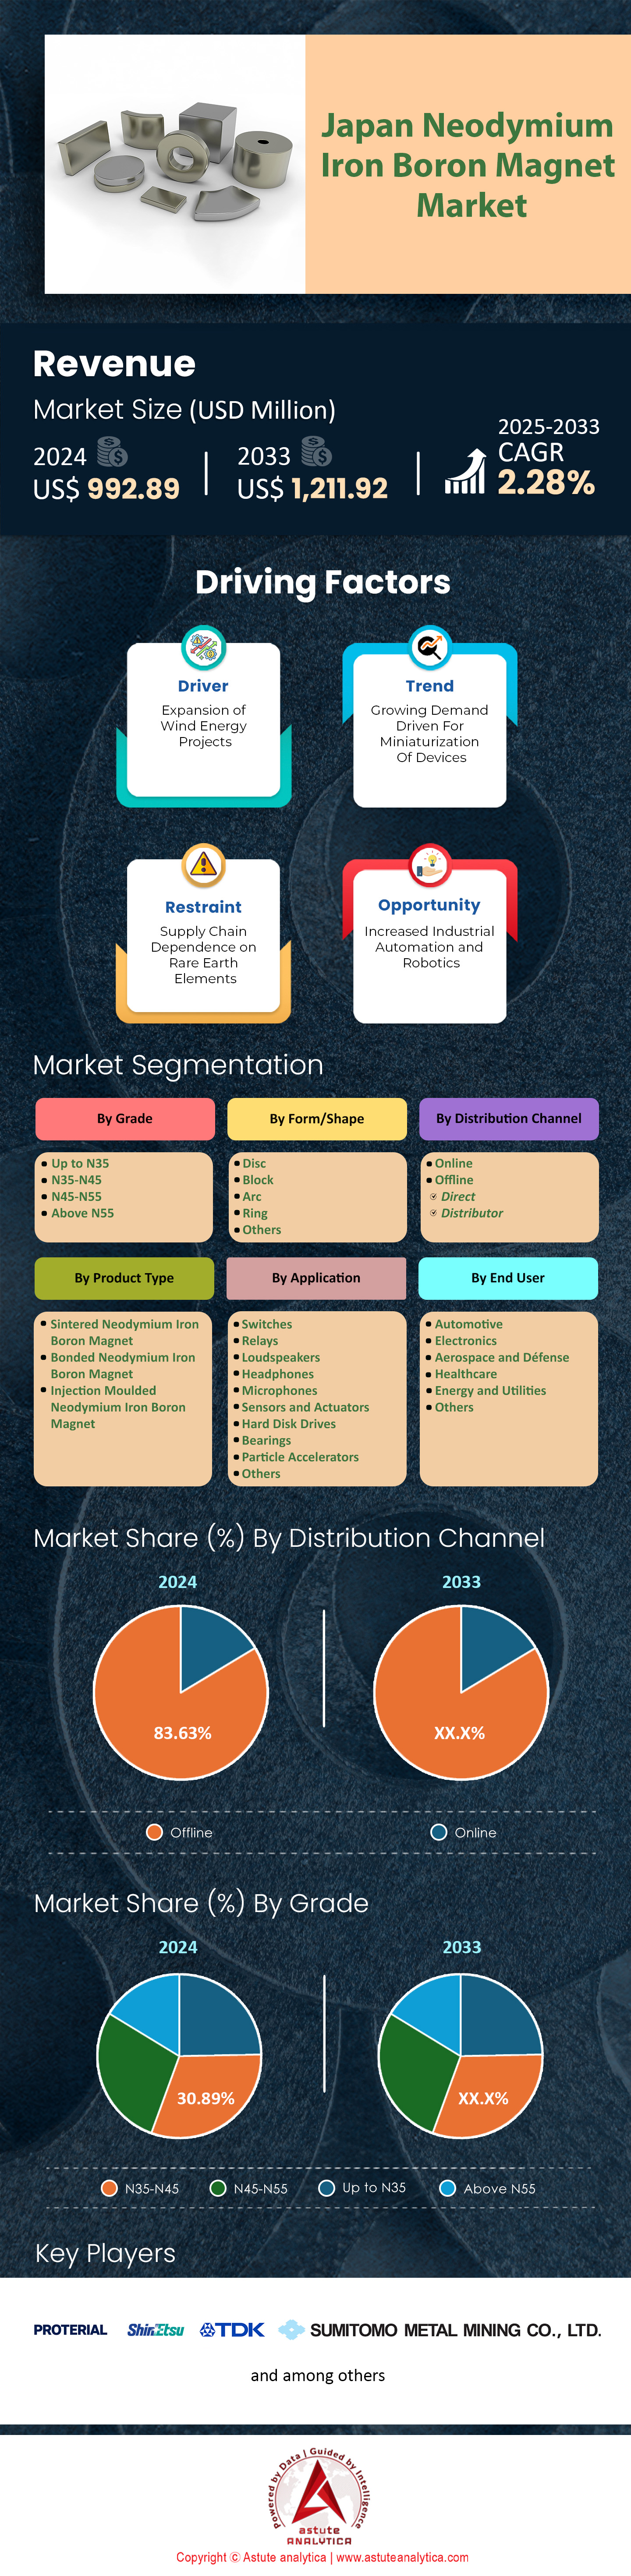
Japan Neodymium Iron Boron Magnet Market: By Product Type (Sintered Neodymium Iron Boron Magnet, Bonded Neodymium Iron Boron Magnet, Injection Moulded Neodymium Iron Boron Magnet); Grade (Up to N35, N35-N45, N45-N55, Above N55); Form (Disc, Block, Arc, Ring, Others); Application (Switches, Relays, Loudspeakers, Headphones, Microphones, Sensors and Actuators, Hard Disk Drives, Bearings, Particle Accelerators, Others); End Users (Automotive, Electronics, Aerospace and Défense, Healthcare, Energy and Utilities, Others); Distribution Channel (Online and Offline ( Direct and Distributor)—Market Size, Industry Dynamics, Opportunity Analysis and Forecast for 2025–2033
- Last Updated: Mar-2025 | Format:
![pdf]()
![powerpoint]()
![excel]() | Report ID: AA03251250 | Delivery: Immediate Access
| Report ID: AA03251250 | Delivery: Immediate Access


 | Report ID: AA03251250 | Delivery: Immediate Access
 Table: 1 Pestle Impact Analysis : Political Factors
Table: 2 Pestle Impact Analysis : Economic Factors
Table: 3 Pestle Impact Analysis : Social Factors
Table: 4 Pestle Impact Analysis : Technological Factors
Table: 5 Pestle Impact Analysis : Legal Factors
Table: 6 Pestle Impact Analysis : Environmental Factors
Table: 7 Market Dynamics And Trends: Impact Analysis of Market Dynamics
Table: 8 Product Price Analysis: By Product Type-Based Price Analysis
Table: 9 Japan Neodymium Iron Boron Magnet Market Size (Us$ Mn), By Product Type, 2020-2033
Table: 10 Japan Neodymium Iron Boron Magnet Market Size (Mn Units), By Product Type, 2020-2033
Table: 11 Japan Neodymium Iron Boron Magnet Market Size (Us$ Mn), By Grade, 2020-2033
Table: 12 Japan Neodymium Iron Boron Magnet Market Size (Mn Units), By Grade, 2020-2033
Table: 13 Japan Neodymium Iron Boron Magnet Market Size (Us$ Mn), By Form/Shape, 2020-2033
Table: 14 Japan Neodymium Iron Boron Magnet Market Size (Mn Units), By Form/Shape, 2020-2033
Table: 15 Japan Neodymium Iron Boron Magnet Market Size (Us$ Mn), By Application, 2020-2033
Table: 16 Japan Neodymium Iron Boron Magnet Market Size (Mn Units), By Application, 2020-2033
Table: 17 Japan Neodymium Iron Boron Magnet Market Size (Us$ Mn), By End User, 2020-2033
Table: 18 Japan Neodymium Iron Boron Magnet Market Size (Mn Units), By End User, 2020-2033
Table: 19 Japan Neodymium Iron Boron Magnet Market Size (Us$ Mn), By Distribution Channel, 2020-2033
Table: 20 Japan Neodymium Iron Boron Magnet Market Size (Mn Units), By Distribution Channel, 2020-2033
Table: 21 Proterial Ltd. (Formerly Hitachi Metals Ltd.) : Recent Development
Table: 22 Proterial Ltd. (Formerly Hitachi Metals Ltd.): Products
Table: 23 Proterial Ltd : Financial Analysis
Table: 24 Zhejiang Inuuovo Magnetics Co. Ltd.: Products
Table: 25 Sumitomo Metal Mining Co. Ltd.: Recent Developments
Table: 26 Sumitomo Metal Mining Co. Ltd.: Products
Table: 27 Sumitomo Metal Mining Co. Ltd. : Financial Analysis
Table: 28 Shin Etsu Chemical Co. Ltd.: Products
Table: 29 Shin Etsu Chemical Co. Ltd. : Financial Analysis
Table: 30 Tdk Corporation : Products
Table: 31 Tdk Corporation : Financial Analysis
Table: 32 Daido Kogyo Co. Ltd.: Products
Table: 33 Daido Kogyo Co. Ltd. : Financial Analysis
Table: 34 Magna Tokyo Co. Ltd.: Products
Table: 35 Kumar Magnet Industries : Products
Table: 36 Arnold Magnetic Technologies Corporation : Products
Table: 37 Compass Diversified (Parent Organization) : Financial Analysis
Table: 38 Other Prominent Players
Table: 39 List Of Secondary Sources: Secondary Sources
Figure: 1 Executive Summary : Japan Neodymium Iron Boron Magnet Market Revenue (Us$ Mn), 2020-2033
Figure: 2 Executive Summary : Japan Neodymium Iron Boron Magnet Market Volume (Mn Units), 2020-2033
Figure: 3 Industry Outlook : EXIM of Electromagnets , 2023
Figure: 4 Industry Outlook : EXIM of Rare-Earth Metal Compounds , 2023
Figure: 5 Industry Outlook : Global Production By Japanese Electronics And It Companies (Us$ Mn)
Figure: 6 Adoption Analysis : Adoption Rate (%), By Product Type
Figure: 7 Japan Neodymium Iron Boron Magnet Market, By Y-O-Y (%), 2021-2033
Figure: 8 Adoption Analysis : Revenue Comparison (Us$ Mn), By Grade
Figure: 9 Driver : Japan's Estimated Ev Market Value (In Us$ Mn)
Figure: 10 Driver : Annual Onshore And Offshore Wind Capacity Additions (Mw) In Japan
Figure: 11 Restraint : Rare Earths: World Mine Production (Metric Tons, Rare-Earth Oxide Equivalent), 2024
Figure: 12 Opportunity : Operational Stock Of Industrial Robots In Japan (000’ Units)
Figure: 13 Competitive Dashboard : Market Share Analysis By Company, Based On Revenue (2023)
Figure: 14 Japan Neodymium Iron Boron Magnet Market, By Product Type, Cagr (%), 2024-2033
Figure: 15 Japan Neodymium Iron Boron Magnet Market Share (%), By Product Type, 2024
Figure: 16 Japan Neodymium Iron Boron Magnet Market Share (%), By Product Type, 2033
Figure: 17 Japan Neodymium Iron Boron Magnet Market, By Grade, Cagr (%), 2024-2033
Figure: 18 Japan Neodymium Iron Boron Magnet Market Share (%), By Grade, 2024
Figure: 19 Japan Neodymium Iron Boron Magnet Market Share (%), By Grade, 2033
Figure: 20 Japan Neodymium Iron Boron Magnet Market, By Form/Shape, Cagr (%), 2024-2033
Figure: 21 Japan Neodymium Iron Boron Magnet Market Share (%), By Form/Shape, 2024
Figure: 22 Japan Neodymium Iron Boron Magnet Market Share (%), By Form/Shape, 2033
Figure: 23 Japan Neodymium Iron Boron Magnet Market, By Application, Cagr (%), 2024-2033
Figure: 24 Japan Neodymium Iron Boron Magnet Market Share (%), By Application, 2024
Figure: 25 Japan Neodymium Iron Boron Magnet Market Share (%), By Application, 2033
Figure: 26 Japan Neodymium Iron Boron Magnet Market, By End User, Cagr (%), 2024-2033
Figure: 27 Japan Neodymium Iron Boron Magnet Market Share (%), By End User, 2024
Figure: 28 Japan Neodymium Iron Boron Magnet Market Share (%), By End User, 2033
Figure: 29 Japan Neodymium Iron Boron Magnet Market, By Distribution Channel, Cagr (%), 2024-2033
Figure: 30 Japan Neodymium Iron Boron Magnet Market Share (%), By Distribution Channel, 2024
Figure: 31 Japan Neodymium Iron Boron Magnet Market Share (%), By Distribution Channel, 2033
Figure: 32 Proterial Ltd. (Formerly Hitachi Metals Ltd.): Business Revenue Segmentation, 2024
Figure: 33 Proterial Ltd. (Formerly Hitachi Metals Ltd.): Geographical Revenue Segmentation, 2024
Figure: 34 Sumitomo Metal Mining Co. Ltd.: Business Revenue Segmentation, 2024
Figure: 35 Sumitomo Metal Mining Co. Ltd.: Geographical Revenue Segmentation, 2024
Figure: 36 Shin Etsu Chemical Co. Ltd.: Business Revenue Segmentation, 2024
Figure: 37 Shin Etsu Chemical Co. Ltd.: Geographical Revenue Segmentation, 2024
Figure: 38 TDK Corporation: Business Revenue Segmentation, 2024
Figure: 39 TDK Corporation: Geographical Revenue Segmentation, 2024
Figure: 40 Daido Kogyo Co. Ltd.: Business Revenue Segmentation, 2024
Figure: 41 Arnold Magnetic Technologies Corporation: Business Revenue Segmentation, 2024
Figure: 42 Arnold Magnetic Technologies Corporation: Geographical Revenue Segmentation, 2024


Choose License Type


Features | Type of License | ||||
Data Book | Single User |   Multi User | Corporate | ||
| e-Access | ✓ | ✓ | ✓ | ✓ | |
User Sharing | 1 User Only | 1 User Only | Up to 7 Users | Unlimited User Access | |
⨉ | ⨉ | ⨉ | ✓ | ||
Free Customization | No Free Customization | Up To 30 hrs work | Up To 60 hrs work | Up To 80 hrs work | |
Deliverable |
| ⨉ | ✓ | ✓ | ✓ |
| ✓ | ⨉ | ✓ | ✓ | |
| ⨉ | ⨉ | ⨉ | ✓ | |
Analyst Support | 2-Months Analyst Support | 4-Months Analyst Support | 7-Months Analyst Support | One Year Analyst Support | |
Free Report update in next update cycle | ⨉ | ⨉ | ⨉ | ✓ | |
Free Industry Update (Within 180 days) | ⨉ | ⨉ | ⨉ | ✓ | |
Benefit | Up to 10% off on Post Purchase | Up to 20% off on Post Purchase | Up to 30% off on Post Purchase | Up to 40% off on Post Purchase | |