Japan Portable Power Station Market: By Product Type (Hybrid Power and Direct Power); Battery Type (Lithium-ion, Lithium Iron Phosphate (LiFePO4), Sealed Lead-Acid, Fossil Fuel); Capacity (Below 100 Wh, 101-250 Wh, 51-500 Wh, 501-1000 Wh, 1001-1500 Wh, More than 1500 Wh); Application (Emergency Power Supply (Power on Board) (Residential, Commercial, Industrial); Automotive (Emergency Road Assistance, Auxiliary Power, Others), Energy & Utilities (Solar Power Storage, Energy Backup, Others); Military & Defense (Remote Operations, Emergency Deployment, Others), Off-grid Power, Others); Distribution Channel (Online Sales and Offline Sales)—Market Size, Industry Dynamics, Opportunity Analysis and Forecast for 2025–2033
- Last Updated: 29-Apr-2025 | | Report ID: AA04251292
Table:1 PESTLE Impact Analysis: Political Factors
Table:2 PESTLE Impact Analysis: Economic Factors
Table:3 PESTLE Impact Analysis: Social Factors
Table:4 PESTLE Impact Analysis: Technological Factors
Table:5 PESTLE Impact Analysis: Environmental Factors
Table:6 PESTLE Impact Analysis: Legal Factors
Table:7 Market Dynamics And Trends: Impact Analysis of Market Dynamics
Table:8 Product Price Analysis: By Capacity based Price Analysis
Table:9 Japan Portable Power Station Market Size (US$ Mn), By Product Source, 2020-2033
Table:10 Japan Portable Power Station Market Size (000' Units), By Product Source, 2020-2033
Table:11 Japan Portable Power Station Market Size (US$ Mn), By Battery Type, 2020-2033
Table:12 Japan Portable Power Station Market Size (000' Units), By Battery Type, 2020-2033
Table:13 Japan Portable Power Station Market Size (US$ Mn), By Capacity, 2020-2033
Table:14 Japan Portable Power Station Market Size (000' Units), By Capacity, 2020-2033
Table:15 Japan Portable Power Station Market Size (US$ Mn), By Application, 2020-2033
Table:16 Japan Portable Power Station Market Size (000' Units), By Application, 2020-2033
Table:17 Japan Portable Power Station Market Size (US$ Mn), By Distribution Channel, 2020-2033
Table:18 Japan Portable Power Station Market Size (000' Units), By Distribution Channel, 2020-2033
Table:19 Japan Below 500Wh Portable Power Station Market Size (US$ Mn), By Battery Type, 2020-2033
Table:20 Japan Below 500Wh Portable Power Station Market Size (000' Units), By Battery Type, 2020-2033
Table:21 Japan Below 500Wh Portable Power Station Market Size (US$ Mn), By Capacity, 2020-2033
Table:22 Japan Below 500Wh Portable Power Station Market Size (000' Units), By Capacity, 2020-2033
Table:23 Japan Below 500Wh Portable Power Station Market Size (US$ Mn), By Application, 2020-2033
Table:24 Japan Below 500Wh Portable Power Station Market Size (000' Units), By Application, 2020-2033
Table:25 Japan Below 500Wh Portable Power Station Market Size (US$ Mn), By Distribution Channel, 2020-2033
Table:26 Japan Below 500Wh Portable Power Station Market Size (000' Units), By Distribution Channel, 2020-2033
Table:27 Jackery Inc.: Recent Developments
Table:28 Jackery Inc.: Products
Table:29 EcoFlow: Recent Developments
Table:30 EcoFlow: Products
Table:31 Duracell: Products
Table:32 BERKSHIRE HATHAWAY INC. (Parent Company) : Financial Analysis
Table:33 Milwaukee Tool: Recent Developments
Table:34 Milwaukee Tool: Products
Table:35 Techtronic Industries (Parent Company) : Financial Analysis
Table:36 Yoshino Technology, Inc.: Recent Developments
Table:37 Yoshino Technology, Inc.: Products
Table:38 KYOCERA Corporation: Products
Table:39 KYOCERA Corporation : Financial Analysis
Table:40 Bluetti: Recent Developments
Table:41 Bluetti: Products
Table:42 Lion Energy: Products
Table:43 DEENO: Products
Table:44 Furukawa Battery Co., Ltd.: Products
Table:45 Furukawa Battery Co., Ltd. : Financial Analysis
Table:46 Other Prominent Players
Table:47 Annexure: Secondary Sources
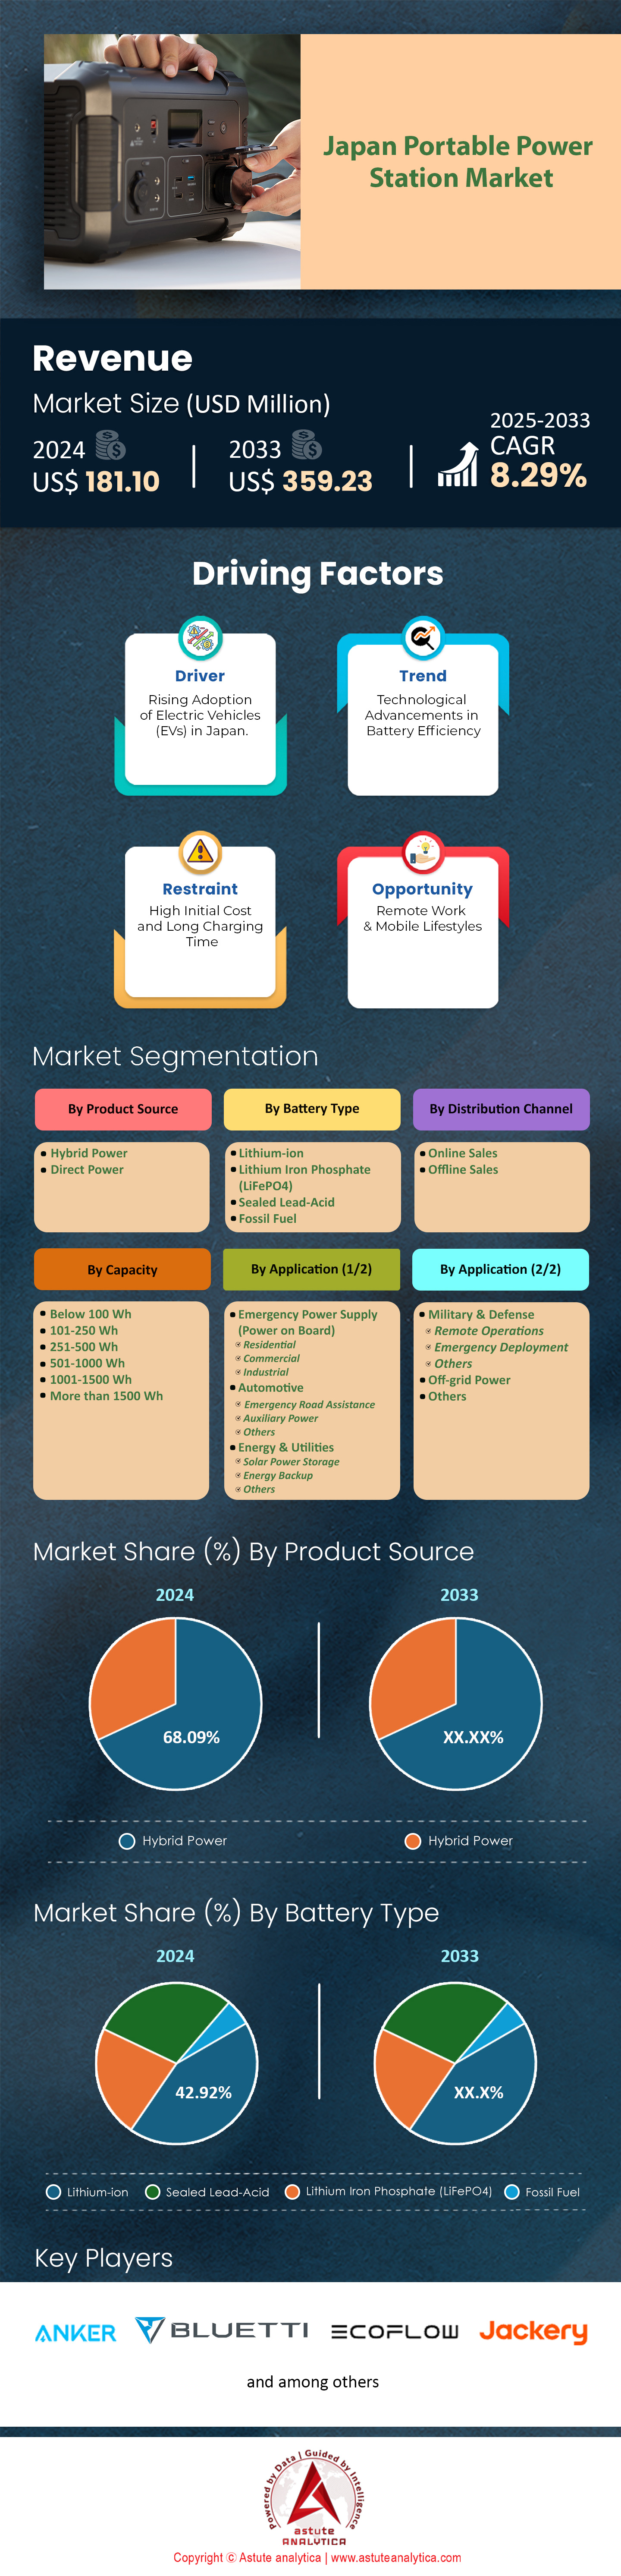
Figure: 1 Executive Summary- Portable Power Station Market: Japan Portable Power Station Market Size and Forecast, 2020-2033 (US$ Mn)
Figure: 2 Executive Summary – Below 500Wh Portable Power Station Market: Japan Below 500Wh Portable Power Station Market Size and Forecast, 2020-2033 (US$ Mn and Volume – 000’ Units)
Figure: 3 Industry Outlook: Number of Electric Vehicles Sold in Japan Each Year – In Million Units
Figure: 4 Industry Outlook: Domestic Energy Production, Japan, 2023 – In TJ
Figure: 5 Industry Outlook: Japan Power Sector Overview - 2024
Figure: 6 Industry Outlook: Electricity Generation in Japan – In % (By Source) - 2024
Figure: 7 Industry Outlook: Renewable Energy as a Percentage of Total Electricity Generated in Japan- 2023
Figure: 8 Industry Outlook: Renewable Energy as a Percentage of Total Electricity Generated in Japan – 2022 (In %)
Figure: 9 Industry Outlook: Major Exporters to Japan (2023) (US$ Mn)
Figure: 10 Industry Outlook: Major Importers from Japan (2023) (US$ Mn)
Figure: 11 Driver: Survey on Participation rates in sports teams/clubs – Japan (In %) – 2023 – By Age Group
Figure: 12 Driver: Number of Electric Cars Sold – By Type – 2023 (In Units)
Figure: 13 Driver: Number of Electric Cars Sold – By Type – 2023 (In Units)
Figure: 14 Driver: Top EV Brands Sold in Japan – 2023 (In %)
Figure: 15 Opportunity: Remote Work Policy in Japan – 2024 (In %)
Figure: 16 Capacity-based Price Analysis, By Y-o-Y (%), 2020-2033
Figure: 17 Product Price Analysis: Capacity-based Price Analysis, By Y-o-Y (%), 2020-2033
Figure: 18 Market Share Analysis by Company, Based on Revenue (2024)
Figure: 19 Japan Portable Power Station Market, By Product Source, CAGR (%), 2024-2033
Figure: 20 Japan Portable Power Station Market Share (%), By Product Source, 2024
Figure: 21 Japan Portable Power Station Market Share (%), By Product Source, 2033
Figure: 22 Japan Portable Power Station Market, By Battery Type, CAGR (%), 2024-2033
Figure: 23 Japan Portable Power Station Market Share (%), By Battery Type, 2024
Figure: 24 Japan Portable Power Station Market Share (%), By Battery Type, 2033
Figure: 25 Japan Portable Power Station Market, By Capacity, CAGR (%), 2024-2033
Figure: 26 Japan Portable Power Station Market Share (%), By Capacity, 2024
Figure: 27 Japan Portable Power Station Market Share (%), By Capacity, 2033
Figure: 28 Japan Portable Power Station Market, By Application, CAGR (%), 2024-2033
Figure: 29 Japan Portable Power Station Market Share (%), By Application, 2024
Figure: 30 Japan Portable Power Station Market Share (%), By Application, 2033
Figure: 31 Japan Portable Power Station Market, By Distribution Channel, CAGR (%), 2024-2033
Figure: 32 Japan Portable Power Station Market Share (%), By Distribution Channel, 2024
Figure: 33 Japan Portable Power Station Market Share (%), By Distribution Channel, 2033
Figure: 34 Japan Below 500Wh Portable Power Station Market, By Battery Type, CAGR (%), 2024-2033
Figure: 35 Japan Below 500Wh Portable Power Station Market Share (%), By Battery Type, 2024
Figure: 36 Japan Below 500Wh Portable Power Station Market Share (%), By Battery Type, 2033
Figure: 37 Japan Below 500Wh Portable Power Station Market, By Capacity, CAGR (%), 2024-2033
Figure: 38 Japan Below 500Wh Portable Power Station Market Share (%), By Capacity, 2024
Figure: 39 Japan Below 500Wh Portable Power Station Market Share (%), By Capacity, 2033
Figure: 40 Japan Below 500Wh Portable Power Station Market, By Application, CAGR (%), 2024-2033
Figure: 41 Japan Below 500Wh Portable Power Station Market Share (%), By Application, 2024
Figure: 42 Japan Below 500Wh Portable Power Station Market Share (%), By Application, 2033
Figure: 43 Japan Below 500Wh Portable Power Station Market, By Distribution Channel, CAGR (%), 2024-2033
Figure: 44 Japan Below 500Wh Portable Power Station Market Share (%), By Distribution Channel, 2024
Figure: 45 Japan Below 500Wh Portable Power Station Market Share (%), By Distribution Channel, 2033
Figure: 46 Duracell: Business Revenue Segmentation, 2024
Figure: 47 Milwaukee Tool: Business Revenue Segmentation, 2024
Figure: 48 Milwaukee Tool: Geographical Revenue Segmentation, 2024
Figure: 49 KYOCERA Corporation: Business Revenue Segmentation, 2024
Figure: 50 KYOCERA Corporation: Geographical Revenue Segmentation, 2024
Figure: 51 Furukawa Battery Co., Ltd.: Business Revenue Segmentation, 2024
Figure: 52 Furukawa Battery Co., Ltd.: Geographical Revenue Segmentation, 2024
Figure: 53 Annexure: GDP, Current Prices (Billions of U.S. dollars)
Figure: 54 Annexure: GDP Per Capita, Current Prices (U.S. Dollars Per Capita)
Figure: 55 Annexure: Population By Age Group, (In Thousands)


Features | Type of License | ||||
Data Book | Single User |   Multi User | Corporate | ||
| e-Access | ✓ | ✓ | ✓ | ✓ | |
User Sharing | 1 User Only | 1 User Only | Up to 7 Users | Unlimited User Access | |
⨉ | ⨉ | ⨉ | ✓ | ||
Free Customization | No Free Customization | Up To 30 hrs work | Up To 60 hrs work | Up To 80 hrs work | |
Deliverable |
| ⨉ | ✓ | ✓ | ✓ |
| ✓ | ⨉ | ✓ | ✓ | |
| ⨉ | ⨉ | ⨉ | ✓ | |
Analyst Support | 2-Months Analyst Support | 4-Months Analyst Support | 7-Months Analyst Support | One Year Analyst Support | |
Free Report update in next update cycle | ⨉ | ⨉ | ⨉ | ✓ | |
Free Industry Update (Within 180 days) | ⨉ | ⨉ | ⨉ | ✓ | |
Benefit | Up to 10% off on Post Purchase | Up to 20% off on Post Purchase | Up to 30% off on Post Purchase | Up to 40% off on Post Purchase | |