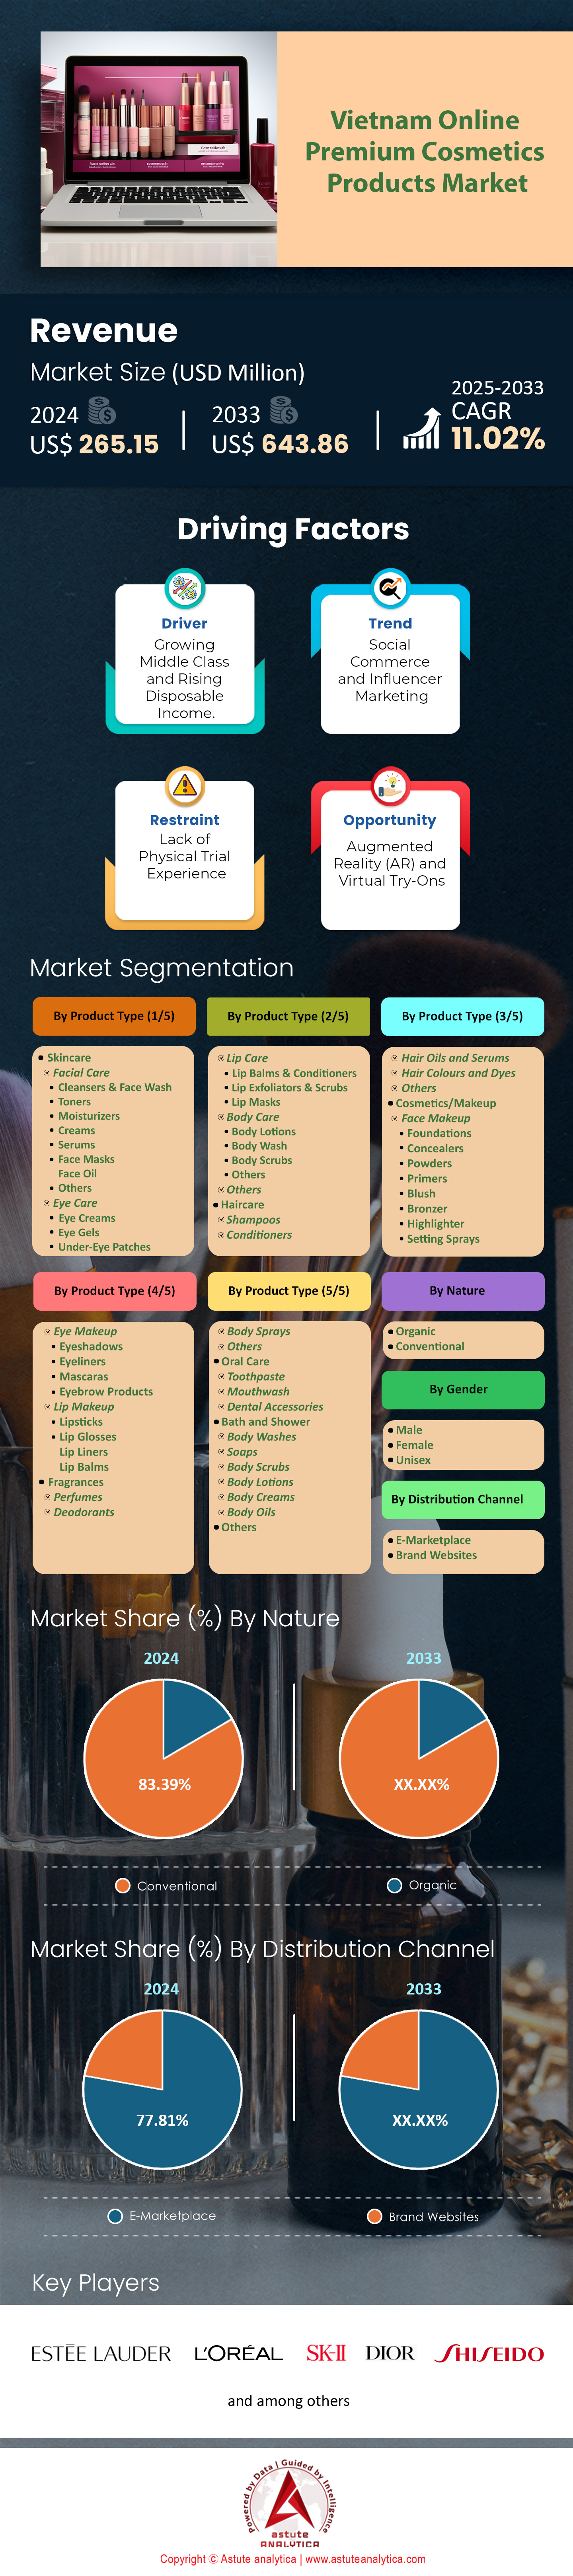
Vietnam Online Premium Cosmetics Products Market: By Products (Skincare (Facial Care (Cleansers & Face Wash, Toners, Moisturizers, Creams, Serums, Face Masks, Face Oil, Others), Eye Care (Eye Creams, Eye Gels, Under-Eye PatchesLip Care, Lip Balms & Conditioners, Lip Exfoliators & Scrubs, Lip Masks, Body Care, Body Lotions, Body Wash, Body Scrubs, Others,), Others), Haircare (Shampoos, Conditioners, Hair Oils and Serums, Hair Colours and Dyes, Others), Cosmetics/Makeup (Face Makeup, Foundations, Concealers, Powders, Primers, Blush, Bronzer, Highlighter, Setting Sprays, Eye Makeup, Eyeshadows, Eyeliners, Mascaras, Eyebrow Products, Lip Makeup, Lipsticks, Lip Glosses, Lip Liners, Lip Balms), Fragrances (Perfumes, Deodorants, Body Sprays, Others), Oral Care (Toothpaste, Mouthwash, Dental Accessories), Bath and Shower (Body Washes, Soaps, Body Scrubs, Body Lotions, Body Creams, Body Oils), Others); Nature (Organic and Conventional); Gender (Male, Female, Unisex); Distribution Channel (E-Marketplace and Brand Websites)—Market Size, Industry Dynamics, Opportunity Analysis and Forecast for 2025–2033
- Last Updated: Apr-2025 | Format:
![pdf]()
![powerpoint]()
![excel]() | Report ID: AA04251289 | Delivery: Immediate Access
| Report ID: AA04251289 | Delivery: Immediate Access


 | Report ID: AA04251289 | Delivery: Immediate Access
 Table 1 Industry Outlook: Overview of Global Wellness Economy by Sector, 2023
Table 2 Industry Outlook: Overview of Global Wellness Economy by Sector, 2023
Table 3 Industry Outlook: Global Personal Care & Beauty Market by Region 2019-2023
Table 4 ASEAN Online Premium Cosmetics Products Market Size (US$ Mn), By Country, 2020-2033
Table 5 Pestle Impact Analysis: Political Factors
Table 6 Pestle Impact Analysis: Economic Factors
Table 7 Pestle Impact Analysis: Social Factors
Table 8 Pestle Impact Analysis: Technological Factors
Table 9 Pestle Impact Analysis: Legal Factors
Table 10 Pestle Impact Analysis: Environmental Factors
Table 11 Market Dynamics And Trends: Impact Analysis of Market Dynamics
Table 12 Product Price Analysis: By Product Type-based Price Analysis
Table 13 Vietnam Online Premium Cosmetics Products Market Size (US$ Mn), By Product Type, 2020-2033
Table 14 Vietnam Online Premium Cosmetics Products Market Size (US$ Mn), By Nature, 2020-2033
Table 15 Vietnam Online Premium Cosmetics Products Market Size (US$ Mn), By Gender, 2020-2033
Table 16 Vietnam Online Premium Cosmetics Products Market Size (US$ Mn), By Distribution Channel, 2020-2033
Table 17 Loreal Groupe: Recent Developments
Table 18 Loreal Groupe: Offering
Table 19 Loreal Groupe: Financial Analysis
Table 20 Shiseido Cosmetics Vietnam Co., Ltd .: Recent Developments
Table 21 Shiseido Cosmetics Vietnam Co., Ltd .: Offering
Table 22 Shiseido Cosmetics Vietnam Co., Ltd .: Financial Analysis
Table 23 The Estée Lauder Companies Inc.: Offering
Table 24 The Estée Lauder Companies Inc.: Financial Analysis
Table 25 TIRTIR Inc.: Offering
Table 26 SK-II Cosmetics: Recent Developments
Table 27 SK-II Cosmetics: Offering
Table 28 The Procter & Gamble Company : Financial Analysis
Table 29 NEUD: Offering
Table 30 Charlotte Tilbury Beauty Limited: Recent Developments
Table 31 Charlotte Tilbury Beauty Limited: Offering
Table 32 OHUI Cosmetics: Offering
Table 33 LG Electronics: Financial Analysis
Table 34 Dior: Offering
Table 35 Christian Dior Couture, S.A. : Financial Analysis
Table 36 DHC Corporation: Recent Developments
Table 37 DHC Corporation: Offering
Table 38 Other Prominent Players
Table 39 Annexure: Secondary Sources
Figure 1 Executive Summary: Vietnam Online Premium Cosmetics Products Market Size and Forecast, 2020-2033 (US$ Mn)
Figure 2 Executive Summary: Top Segments, CAGR % (2024-2033)
Figure 3 Industry Outlook: EXIM of Beauty Products, 2023
Figure 4 Industry Outlook: Overview of Cosmetics Industry of Vietnam
Figure 5 ASEAN Online Premium Cosmetics Products Market Share (%), By Country, 2024
Figure 6 ASEAN Online Premium Cosmetics Products Market Share (%), By Country, 2033
Figure 7 Consumer Behavior Analysis – Vietnam: Demographic Profile: Age Group (yrs)
Figure 8 Consumer Behavior Analysis – Vietnam: Demographic Profile: Gender
Figure 9 Consumer Behavior Analysis – Vietnam: Demographic Profile: Income Level
Figure 10 Consumer Behavior Analysis – Vietnam: Purchasing Frequency: Frequency of purchasing Skincare
Figure 11 Consumer Behavior Analysis – Vietnam: Purchasing Frequency: Average monthly spending on Skincare
Figure 12 Consumer Behavior Analysis – Vietnam: Purchasing Frequency: Purchase Frequency based on Price
Figure 13 Consumer Behavior Analysis – Vietnam: Competitive & Brand Perception: Most important factor when selecting a brand
Figure 14 Consumer Behavior Analysis – Vietnam: Competitive & Brand Perception: Perception of premium skincare brands compared to budget brands
Figure 15 Consumer Behavior Analysis – Vietnam: Competitive & Brand Perception: Most trusted type of brand
Figure 16 Consumer Behavior Analysis – Vietnam: Sales Channel Preferences: Preferred Sales Channel
Figure 17 Consumer Behavior Analysis – Vietnam: Sales Channel Preferences: Frequency of purchasing skincare online
Figure 18 Consumer Behavior Analysis – Vietnam: Sales Channel Preferences: Reason For Choosing Particular Online Channel
Figure 19 Consumer Behavior Analysis – Vietnam: Sales Channel Preferences: Frequency of checking online reviews before purchasing
Figure 20 Consumer Behavior Analysis – Vietnam: Sales Channel Preferences: Sales Channel Switching
Figure 21 Consumer Behavior Analysis – Vietnam: Sales Channel Preferences: Features Most Likely to Influence a Switch in Sales Channels
Figure 22 Consumer Behavior Analysis – Vietnam: Future Market Trends & Demand Insights: Upcoming Trend In Skincare
Figure 23 Consumer Behavior Analysis – Vietnam: Future Market Trends & Demand Insights: Interest in receiving personalized skincare recommendations
Figure 24 Consumer Behavior Analysis – Vietnam: Future Market Trends & Demand Insights: Opinion on AI-powered skincare recommendations
Figure 25 Consumer Behavior Analysis – Vietnam: Future Market Trends & Demand Insights: Future Market Trends & Demand Insights: Tech-driven Skincare
Figure 26 Consumer Behavior Analysis – Vietnam: Future Market Trends & Demand Insights: Influence of Social Media
Figure 27 Consumer Behavior Analysis – Vietnam: Future Market Trends & Demand Insights: Importance of ethical sourcing and cruelty-free certifications
Figure 28 Consumer Behavior Analysis – Vietnam: Future Market Trends & Demand Insights: Upcoming Trend In Skincare
Figure 29 Consumer Behavior Analysis – Vietnam: Future Market Trends & Demand Insights: Interest in receiving personalized skincare recommendations
Figure 30 Consumer Behavior Analysis – Vietnam: Future Market Trends & Demand Insights: Opinion on AI-powered skincare recommendations
Figure 31 Consumer Behavior Analysis – Vietnam: Future Market Trends & Demand Insights: Tech-driven Skincare
Figure 32 Consumer Behavior Analysis – Vietnam: Future Market Trends & Demand Insights: Influence of Social Media
Figure 33 Consumer Behavior Analysis – Vietnam: Future Market Trends & Demand Insights: Importance of ethical sourcing and cruelty-free certifications
Figure 34 Consumer Behavior Analysis – ASEAN: Demographic Profile: Age Group (yrs)
Figure 35 Consumer Behavior Analysis – ASEAN: Demographic Profile: Gender
Figure 36 Consumer Behavior Analysis – ASEAN: Demographic Profile: Income Level
Figure 37 Consumer Behavior Analysis – ASEAN: Purchasing Frequency: Frequency of purchasing Skincare
Figure 38 Consumer Behavior Analysis – ASEAN: Purchasing Frequency: Average monthly spending on Skincare
Figure 39 Consumer Behavior Analysis – ASEAN: Purchasing Frequency: Purchase Frequency based on Price
Figure 40 Consumer Behavior Analysis – ASEAN: Competitive & Brand Perception: Most important factor when selecting a brand
Figure 41 Consumer Behavior Analysis – ASEAN: Competitive & Brand Perception: Perception of premium skincare brands compared to budget brands
Figure 42 Consumer Behavior Analysis – ASEAN: Competitive & Brand Perception: Most trusted type of brand
Figure 43 Consumer Behavior Analysis – ASEAN: Sales Channel Preferences: Preferred Sales Channel
Figure 44 Consumer Behavior Analysis – ASEAN: Sales Channel Preferences: Frequency of purchasing skincare online
Figure 45 Consumer Behavior Analysis – ASEAN: Sales Channel Preferences: Reason For Choosing Particular Online Channel
Figure 46 Consumer Behavior Analysis – ASEAN: Sales Channel Preferences: Frequency of checking online reviews before purchasing
Figure 47 Consumer Behavior Analysis – ASEAN: Sales Channel Preferences: Sales Channel Switching
Figure 48 Consumer Behavior Analysis – ASEAN: Sales Channel Preferences: Features Most Likely to Influence a Switch in Sales Channels
Figure 49 Consumer Behavior Analysis – ASEAN:Future Market Trends & Demand Insights: Upcoming Trend In Skincare
Figure 50 Consumer Behavior Analysis – ASEAN:Future Market Trends & Demand Insights: Interest in receiving personalized skincare recommendations
Figure 51 Consumer Behavior Analysis – ASEAN:Future Market Trends & Demand Insights: Opinion on AI-powered skincare recommendations
Figure 52 Consumer Behavior Analysis – ASEAN:Future Market Trends & Demand Insights: Tech-driven Skincare
Figure 53 Consumer Behavior Analysis – ASEAN:Future Market Trends & Demand Insights: Influence of Social Media
Figure 54 Consumer Behavior Analysis – ASEAN:Future Market Trends & Demand Insights: Importance of ethical sourcing and cruelty-free certifications
Figure 55 Driver: Biggest E-Commerce Platforms in Vietnam – By Market Share (%) - 2024
Figure 56 Opportunity: Response of Customers with Virtual Try On Facility – Vietnam (%) - 2022
Figure 57 Opportunity: Response of Customers with Virtual Try On Facility – Vietnam (%) – 2022
Figure 58 Product Price Analysis: Product Type-based Price Analysis, By Y-o-Y (%), 2020-2033
Figure 59 Competitive Dashboard: Market Share Analysis by Company, Based on Revenue (2024)
Figure 60 Vietnam Online Premium Cosmetics Products Market, By Product Type, CAGR (%), 2024-2033
Figure 61 Vietnam Online Premium Cosmetics Products Market Share (%), By Product Type, 2024
Figure 62 Vietnam Online Premium Cosmetics Products Market Share (%), By Product Type, 2033
Figure 63 Vietnam Online Premium Cosmetics Products Market, By Nature, CAGR (%), 2024-2033
Figure 64 Vietnam Online Premium Cosmetics Products Market Share (%), By Nature, 2024
Figure 65 Vietnam Online Premium Cosmetics Products Market Share (%), By Nature, 2033
Figure 66 Vietnam Online Premium Cosmetics Products Market, By Gender, CAGR (%), 2024-2033
Figure 67 Vietnam Online Premium Cosmetics Products Market Share (%), By Gender, 2024
Figure 68 Vietnam Online Premium Cosmetics Products Market Share (%), By Gender, 2033
Figure 69 Vietnam Online Premium Cosmetics Products Market, By Distribution Channel, CAGR (%), 2024-2033
Figure 70 Vietnam Online Premium Cosmetics Products Market Share (%), By Distribution Channel, 2024
Figure 71 Vietnam Online Premium Cosmetics Products Market Share (%), By Distribution Channel, 2033
Figure 72 Loreal Groupe: Business Revenue Segmentation, 2024
Figure 73 Loreal Groupe: Geographical Revenue Segmentation, 2024
Figure 74 Shiseido Cosmetics Vietnam Co., Ltd .: Business Revenue Segmentation, 2024
Figure 75 The Estée Lauder Companies Inc.: Business Revenue Segmentation, 2024
Figure 76 The Estée Lauder Companies Inc.: Geographical Revenue Segmentation, 2024
Figure 77 SK-II Cosmetics: Business Revenue Segmentation, 2024
Figure 78 SK-II Cosmetics: Geographical Revenue Segmentation, 2024
Figure 79 Dior: Business Revenue Segmentation, 2024
Figure 80 Dior: Geographical Revenue Segmentation, 2024
Figure 81 Macro Factors: Vietnam GDP (Nominal, $US) 2018-2023
Figure 82 Macro Factors: Vietnam Population – In Numbers (Yearly)


Choose License Type


Features | Type of License | ||||
Data Book | Single User |   Multi User | Corporate | ||
| e-Access | ✓ | ✓ | ✓ | ✓ | |
User Sharing | 1 User Only | 1 User Only | Up to 7 Users | Unlimited User Access | |
⨉ | ⨉ | ⨉ | ✓ | ||
Free Customization | No Free Customization | Up To 30 hrs work | Up To 60 hrs work | Up To 80 hrs work | |
Deliverable |
| ⨉ | ✓ | ✓ | ✓ |
| ✓ | ⨉ | ✓ | ✓ | |
| ⨉ | ⨉ | ⨉ | ✓ | |
Analyst Support | 2-Months Analyst Support | 4-Months Analyst Support | 7-Months Analyst Support | One Year Analyst Support | |
Free Report update in next update cycle | ⨉ | ⨉ | ⨉ | ✓ | |
Free Industry Update (Within 180 days) | ⨉ | ⨉ | ⨉ | ✓ | |
Benefit | Up to 10% off on Post Purchase | Up to 20% off on Post Purchase | Up to 30% off on Post Purchase | Up to 40% off on Post Purchase | |