Tabelle 1: Weltweiter Markt für Datenannotationstools (Mrd. US$), nach Datentyp, 2019–2032 Tabelle 2: Weltweiter Markt für Datenannotationstools (Mrd. US$), nach Datentyp, 2019–2032 Tabelle 3: Weltweiter Markt für Datenannotationstools (Mrd. US$), nach Technologie, 2019–2032 Tabelle 4: Weltweiter Markt für Datenannotationstools (Mrd. US$), nach Gerätetyp, 2019–2032 Tabelle 5: Weltweiter Markt für Datenannotationstools (Mrd. US$), nach Endnutzer, 2019–2032 Tabelle 6: Weltweiter Markt für Datenannotationstools (Mrd. US$), nach Region, 2019–2032 Tabelle 7: Marktgröße für Datenannotationstools in Nordamerika (Mrd. US$), nach Land, 2019–2032 Tabelle 8: Marktgröße für Datenannotationstools in Nordamerika (Mrd. US$), nach Datentyp Tabelle 9: Marktgröße für Datenannotationstools in Nordamerika (Mrd. US$), nach Datentyp, 2019–2032 ; Tabelle 10: Marktgröße für Datenannotationstools in Nordamerika (Mrd. US$), nach Technologie, 2019–2032; Tabelle 11: Marktgröße für Datenannotationstools in Nordamerika (Mrd. US$), nach Gerätetyp, 2019–2032; Tabelle 12: Marktgröße für Datenannotationstools in Nordamerika (Mrd. US$), nach Endnutzer, 2019–2032; Tabelle 13: Marktgröße für Datenannotationstools in Europa (Mrd. US$), nach Land, 2019–2032; Tabelle 14: Marktgröße für Datenannotationstools in Europa (Mrd. US$), nach Datentyp, 2019–2032; Tabelle 15: Marktgröße für Datenannotationstools in Europa (Mrd. US$), nach Datentyp, 2019–2032 Tabelle 16: Marktgröße für Datenannotationstools in Europa (Mrd. US$), nach Technologie, 2019–2032 Tabelle 17: Marktgröße für Datenannotationstools in Europa (Mrd. US$), nach Gerätetyp, 2019–2032 Tabelle 18: Marktgröße für Datenannotationstools in Europa (Mrd. US$), nach Endnutzer, 2019–2032 Tabelle 19: Marktgröße für Datenannotationstools im asiatisch-pazifischen Raum (Mrd. US$), nach Land, 2019–2032 Tabelle 20: Marktgröße für Datenannotationstools im asiatisch-pazifischen Raum (Mrd. US$), nach Datentyp, 2019–2032 Tabelle 21: Marktgröße für Datenannotationstools im asiatisch-pazifischen Raum (Mrd. US$), nach Datentyp, 2019–2032 Tabelle 22: Marktgröße für Datenannotationstools im asiatisch-pazifischen Raum (Mrd. US$), nach Technologie, 2019–2032 Tabelle 23: Daten Marktgröße für Annotationswerkzeuge (Mrd. US$), nach Gerätetyp, 2019–2032 Tabelle 24: Marktgröße für Datenannotationswerkzeuge im asiatisch-pazifischen Raum (Mrd. US$), nach Endnutzer, 2019–2032 Tabelle 25: Marktgröße für Datenannotationswerkzeuge im Nahen Osten und Afrika (Mrd. US$), nach Land, 2019–2032 Tabelle 26: Marktgröße für Datenannotationswerkzeuge im Nahen Osten und Afrika (Mrd. US$), nach Datentyp, 2019–2032 Tabelle 27: Marktgröße für Datenannotationswerkzeuge im Nahen Osten und Afrika (Mrd. US$), nach Datentyp, 2019–2032 Tabelle 28: Marktgröße für Datenannotationswerkzeuge im Nahen Osten und Afrika (Mrd. US$), nach Technologie, 2019–2032 Tabelle 29: Marktgröße für Datenannotationswerkzeuge im Nahen Osten und Afrika (Mrd. US$), nach Gerätetyp, 2019–2032 Tabelle 30: Marktgröße für Datenannotationstools im Nahen Osten und Afrika (Mrd. US-Dollar), nach Endnutzer, 2019–2032 Tabelle 31: Marktgröße für Datenannotationstools in Südamerika (Mrd. US-Dollar), nach Land, 2019–2032 Tabelle 32: Marktgröße für Datenannotationstools in Südamerika (Mrd. US-Dollar), nach Datentyp, 2019–2032 Tabelle 33: Marktgröße für Datenannotationstools in Südamerika (Mrd. US-Dollar), nach Datentyp, 2019–2032 Tabelle 34: Marktgröße für Datenannotationstools in Südamerika (Mrd. US-Dollar), nach Technologie, 2019–2032 Tabelle 35: Marktgröße für Datenannotationstools in Südamerika (Mrd. US-Dollar), nach Gerätetyp, 2019–2032 Tabelle 36: Marktgröße für Datenannotationstools in Südamerika (Mrd. US-Dollar), nach Endnutzer, 2019–2032 Tabelle 37: Alphabet Appen Limited: Finanzanalyse Tabelle 38: Appen Limited: Finanzanalyse
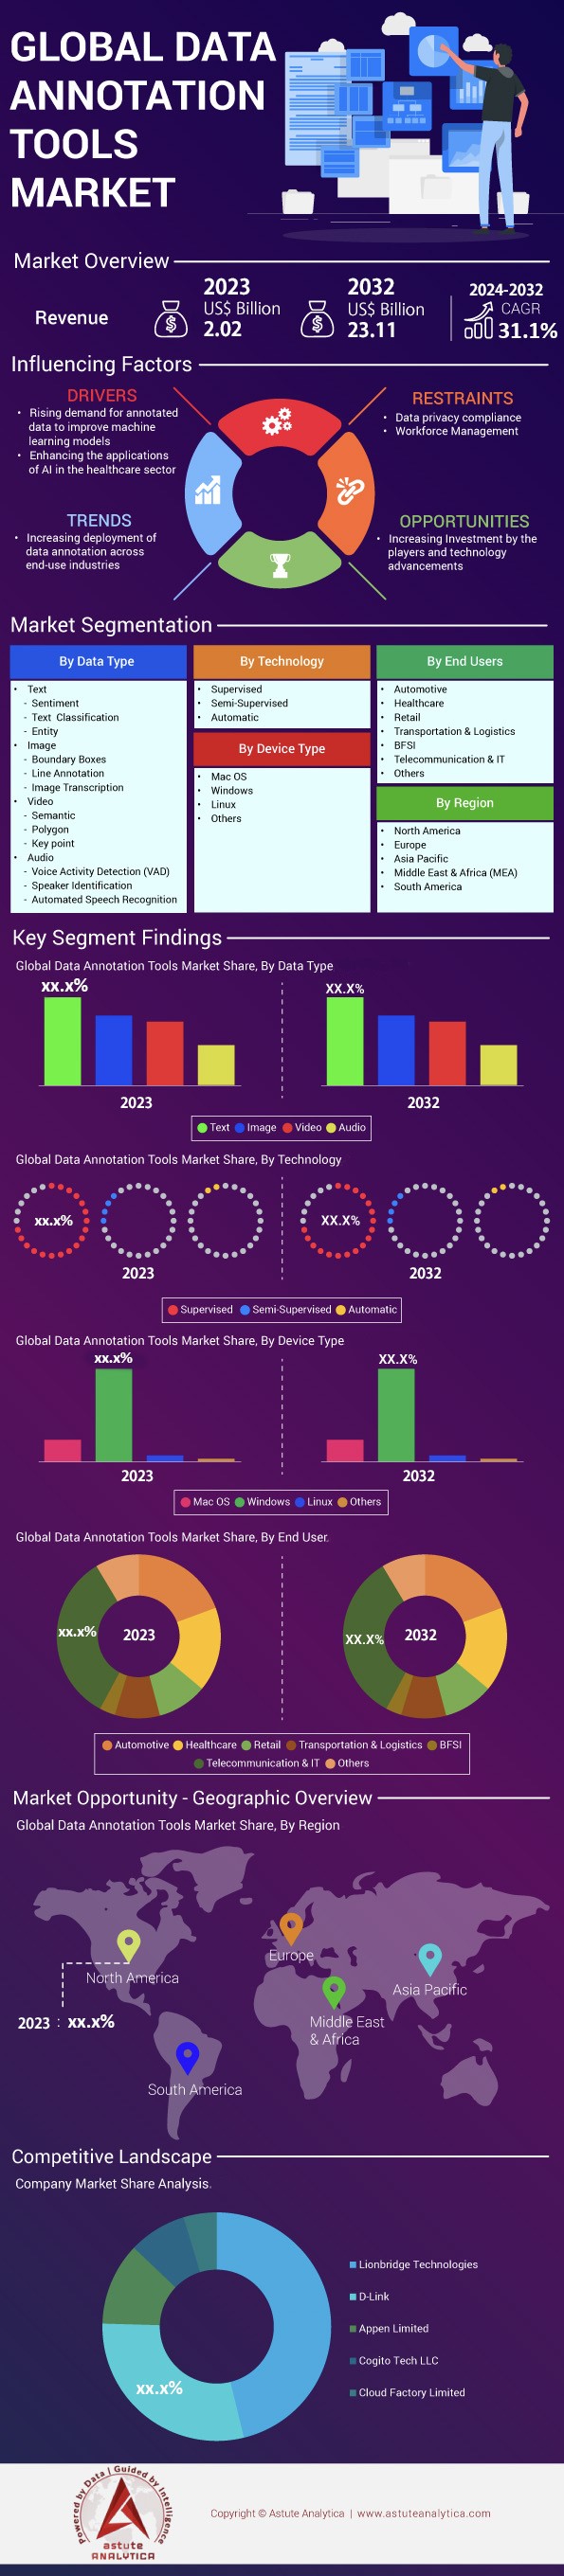
Abbildung 1: Zusammenfassung: Weltweiter Markt für Datenannotationstools, Wert (Mio. US$), 2019–2032
Abbildung 2: Marktdynamik und Trends: Städtische Bevölkerung (in Milliarden)
Abbildung 3: Marktdynamik und Trends: F&E-Ausgaben (% des globalen BIP)
Abbildung 4: Auswirkungen und Erholung durch COVID-19: Weltweiter Markt für Datenannotationstools, Auswirkungen und Erholung durch COVID-19, 2019–2032 (in %)
Abbildung 5: Produktpreisanalyse: Preisanalyse nach Kategorien
Abbildung 6: Wettbewerbsübersicht: Marktanteilsanalyse nach Unternehmen, basierend auf dem Umsatz (2020)
Abbildung 7: Analyse des globalen Marktes für Datenannotationstools nach Datentyp, CAGR (%), 2019–2032
Abbildung 8: Weltweiter Marktanteil für Datenannotationstools (%), nach Datentyp, 2023
Abbildung 9: Weltweiter Marktanteil für Datenannotationstools (%), nach Datentyp, 2032
Abbildung 10: Analyse des globalen Marktes für Datenannotationstools nach Technologie, CAGR (%)
Abbildung 11: Weltweiter Marktanteil von Datenannotationstools (%) nach Technologie,
Abbildung 12: Weltweiter Marktanteil von Datenannotationstools (%) nach Technologie,
; Abbildung 13: Weltweite Marktanalyse für Datenannotationstools nach Gerätetyp, CAGR (%), 2023–2032
; Abbildung 14: Weltweiter Marktanteil von Datenannotationstools (%) nach Gerätetyp, 2023;
Abbildung 15: Weltweiter Marktanteil von Datenannotationstools (%) nach Gerätetyp, 2032;
Abbildung 16: Weltweite Marktanalyse für Datenannotationstools nach Endnutzer, CAGR (%), 2019–2032;
Abbildung 17: Weltweiter Marktanteil von Datenannotationstools (%) nach Endnutzer, 2023;
Abbildung 18: Weltweiter Marktanteil von Datenannotationstools (%) nach Endnutzer, 2032;
Abbildung 19: Weltweite Marktanalyse für Datenannotationstools nach Region, CAGR (%), 2019–2032
Abbildung 20: Globaler Markt für Datenannotationstools nach Region, 2023
Abbildung 21: Globaler Markt für Datenannotationstools nach Region, 2032
Abbildung 22: Markt für Datenannotationstools in Nordamerika: Segment mit dem höchsten Anteil (%)
Abbildung 23: Wichtigste Erkenntnisse zum Markt für Datenannotationstools in Nordamerika: Nettopotenzial (in Mio. US$)
Abbildung 24: Wichtigste Erkenntnisse zum Markt für Datenannotationstools in Nordamerika: Potenzialanalyse nach Datentyp
Abbildung 25: Wichtigste Erkenntnisse zum Markt für Datenannotationstools in Nordamerika: Potenzialanalyse nach Technologie
Abbildung 26: Wichtigste Erkenntnisse zum Markt für Datenannotationstools in Nordamerika: Potenzialanalyse nach Gerätetyp
Abbildung 27: Wichtigste Erkenntnisse zum Markt für Datenannotationstools in Nordamerika: Potenzialanalyse nach Endnutzer
Abbildung 28: Marktanteil (%) des Marktes für Datenannotationstools in Nordamerika nach Land, 2023
Abbildung 29: Marktanteil (%) des Marktes für Datenannotationstools in Nordamerika nach Land, 2032
Abbildung 30: Marktanteil (%) des Marktes für Datenannotationstools in Nordamerika Nach Datentyp, 2023
Abbildung 31: Marktanteil von Datenannotationstools in Nordamerika (%), nach Datentyp, 2032
Abbildung 32: Marktanteil von Datenannotationstools in Nordamerika (%) nach Technologie, 2023
Abbildung 33: Marktanteil von Datenannotationstools in Nordamerika (%) nach Technologie, 2032
Abbildung 34: Marktanteil von Datenannotationstools in Nordamerika (%) nach Gerätetyp, 2023
Abbildung 35: Marktanteil von Datenannotationstools in Nordamerika (%) nach Gerätetyp, 2032
Abbildung 36: Marktanteil von Datenannotationstools in Nordamerika (%) nach Endnutzer, 2023
Abbildung 37: Marktanteil von Datenannotationstools in Nordamerika (%) nach Endnutzer, 2032
Abbildung 38: Markt für Datenannotationstools in Europa: Segment mit dem höchsten Anteil (%)
Abbildung 39: Wichtigste Erkenntnisse zum Markt für Datenannotationstools in Europa: Nettopotenzial, in Mio. US$
Abbildung 40: Wichtigste Erkenntnisse zum Markt für Datenannotationstools in Europa: Potenzialanalyse
Abbildung 41: Wichtigste Erkenntnisse zum europäischen Markt für Datenannotationstools: Chancenanalyse
Abbildung 42: Wichtigste Erkenntnisse zum europäischen Markt für Datenannotationstools: Chancenanalyse
; Abbildung 43: Wichtigste Erkenntnisse zum europäischen Markt für Datenannotationstools: Chancenanalyse
Abbildung 44: Marktanteil (%) des europäischen Marktes für Datenannotationstools: Chancenanalyse
Abbildung 45: Marktanteil (%) des europäischen Marktes für Datenannotationstools: nach Land, 2023; Abbildung 46
: Marktanteil (%) des europäischen Marktes für Datenannotationstools: nach Land, 2032;
Abbildung 47: Marktanteil (%) des europäischen Marktes für Datenannotationstools: nach Datentyp, 2032;
Abbildung 48: Marktanteil (%) des europäischen Marktes für Datenannotationstools: nach Technologie, 2023;
Abbildung 49: Marktanteil (%) des europäischen Marktes für Datenannotationstools: nach Technologie, 2032;
Abbildung 50: Marktanteil (%) des europäischen Marktes für Datenannotationstools: nach Gerätetyp, 2023;
Abbildung 51: Marktanteil des europäischen Marktes für Datenannotationstools
in Europa: Datenannotationstools;
Abbildung 53: Marktanteil (%) nach Endnutzer, 2023 in Europa: Datenannotationstools; Abbildung 54
: Markt für Datenannotationstools im asiatisch-pazifischen Raum: Segment mit dem höchsten Anteil (%); Abbildung
55: Wichtigste Erkenntnisse zum Markt für Datenannotationstools im asiatisch-pazifischen Raum: Nettopotenzial (in Mio. US-Dollar);
Abbildung 56: Wichtigste Erkenntnisse zum Markt für Datenannotationstools im asiatisch-pazifischen Raum: Potenzialanalyse nach Datentyp;
Abbildung 57: Wichtigste Erkenntnisse zum Markt für Datenannotationstools im asiatisch-pazifischen Raum: Potenzialanalyse nach Technologie;
Abbildung 58: Wichtigste Erkenntnisse zum Markt für Datenannotationstools im asiatisch-pazifischen Raum: Potenzialanalyse nach Gerätetyp;
Abbildung 59: Wichtigste Erkenntnisse zum Markt für Datenannotationstools im asiatisch-pazifischen Raum: Potenzialanalyse nach Endnutzer;
Abbildung 60: Marktanteil (%) nach Ländern, 2023;
Abbildung 61: Markt für Datenannotationstools im asiatisch-pazifischen Raum Marktanteil (%), nach Land, 2032
Abbildung 62: Marktanteil (%) für Datenannotationstools im asiatisch-pazifischen Raum, nach Datentyp, 2023
Abbildung 63: Marktanteil (%) für Datenannotationstools im asiatisch-pazifischen Raum, nach Datentyp, 2032
Abbildung 64: Marktanteil (%) für Datenannotationstools im asiatisch-pazifischen Raum, nach Technologie, 2023 Abbildung
65: Marktanteil (%) für Datenannotationstools im asiatisch-pazifischen Raum, nach Technologie, 2032
Abbildung 66: Marktanteil (%) für Datenannotationstools im asiatisch-pazifischen Raum, nach Gerätetyp, 2023
Abbildung 67: Marktanteil (%) für Datenannotationstools im asiatisch-pazifischen Raum, nach Gerätetyp, 2032
Abbildung 68: Marktanteil (%) für Datenannotationstools im asiatisch-pazifischen Raum, nach Endnutzer, 2023
Abbildung 69: Marktanteil (%) für Datenannotationstools im asiatisch-pazifischen Raum, nach Endnutzer, 2032
Abbildung 70: Markt für Datenannotationstools im Nahen Osten und Afrika: Segment mit dem höchsten Anteil (%) Abbildung
71: Naher Osten Wichtigste Erkenntnisse zum Markt für Datenannotationstools im Nahen Osten und Afrika: Nettopotenzial (in Mio. US$)
Abbildung 72: Wichtigste Erkenntnisse zum Markt für Datenannotationstools im Nahen Osten und Afrika: Potenzialanalyse nach Datentyp
Abbildung 73: Wichtigste Erkenntnisse zum Markt für Datenannotationstools im Nahen Osten und Afrika: Potenzialanalyse nach Technologie
Abbildung 74: Wichtigste Erkenntnisse zum Markt für Datenannotationstools
im Nahen Osten und Afrika: Potenzialanalyse nach Gerätetyp Abbildung 75: Wichtigste Erkenntnisse zum Markt für Datenannotationstools im Nahen
Osten und Afrika: Potenzialanalyse nach Endnutzer Abbildung 76: Marktanteile (%) nach Ländern im Nahen
Osten und Afrika bis 2023 Abbildung 77: Marktanteile (%) nach Ländern im Nahen Osten und Afrika bis 2032
Abbildung 78: Marktanteile (%) nach Datentyp im Nahen Osten und Afrika bis 2023
Abbildung 79: Marktanteile (%) nach Datentyp im Nahen Osten und Afrika bis 2032
Abbildung 80: Marktanteile von Datenannotationstools im Nahen Osten und Afrika (%) nach Technologie, 2023
Abbildung 81: Marktanteile von Datenannotationstools im Nahen Osten und Afrika (%) nach Technologie, 2032
Abbildung 82: Marktanteile von Datenannotationstools im Nahen Osten und Afrika (%) nach Gerätetyp, 2023
Abbildung 83: Marktanteile von Datenannotationstools im Nahen Osten und Afrika (%) nach Gerätetyp, 2032
Abbildung 84: Marktanteile von Datenannotationstools im Nahen Osten und Afrika (%) nach Endnutzer, 2023
Abbildung 85: Marktanteile von Datenannotationstools im Nahen Osten und Afrika (%) nach Endnutzer, 2032
Abbildung 86: Markt für Datenannotationstools in Südamerika: Segment mit dem höchsten Anteil (%)
Abbildung 87: Wichtigste Erkenntnisse zum Markt für Datenannotationstools in Südamerika: Nettopotenzial (in Mio. US$)
Abbildung 88: Wichtigste Erkenntnisse zum Markt für Datenannotationstools in Südamerika: Potenzialanalyse nach Datentyp
Abbildung 89: Datenannotation in Südamerika Wichtigste Erkenntnisse zum Markt für Datenannotationstools: Chancenanalyse nach Technologie
(Abbildung 90): Wichtigste Erkenntnisse zum Markt für Datenannotationstools in Südamerika: Chancenanalyse nach Gerätetyp (
Abbildung 91): Wichtigste Erkenntnisse zum Markt für Datenannotationstools in Südamerika: Chancenanalyse nach Endnutzer
(Abbildung 92): Marktanteile (%) für Datenannotationstools in Südamerika nach Land, 2023
(Abbildung 93): Marktanteile (%) für Datenannotationstools in Südamerika nach Land, 2032
(Abbildung 94): Marktanteile (%) für Datenannotationstools
in Südamerika nach Datentyp, 2023 (Abbildung 95): Marktanteile (%) für Datenannotationstools in Südamerika nach Datentyp, 2032
(Abbildung 96): Marktanteile (%) für Datenannotationstools in Südamerika nach Technologie, 2023
(Abbildung 97): Marktanteile (%) für Datenannotationstools in Südamerika nach Technologie, 2032
(Abbildung 98): Marktanteile (%) für Datenannotationstools in Südamerika nach Gerätetyp, 2023
(Abbildung 99): Marktanteile für Datenannotationstools in Südamerika (%), nach Gerätetyp, 2032
Abbildung 100: Marktanteil von Datenannotationstools in Südamerika (%), nach Endnutzer, 2023
Abbildung 101: Marktanteil von Datenannotationstools in Südamerika (%), nach Endnutzer, 2032
Abbildung 102: Alphabet Inc.: Umsatzsegmentierung nach Geschäftsfeld, 2023 Abbildung
103: Alphabet Inc.: Umsatzsegmentierung nach geografischer Region, 2023
Abbildung 104: Appen Limited: Umsatzsegmentierung nach Geschäftsfeld, 2023
Abbildung 105: Appen Limited: Umsatzsegmentierung nach geografischer Region, 2023


Merkmale | Lizenzart | ||||
Datenbuch | Einzelbenutzer |   Mehrere Benutzer | Unternehmen | ||
| E-Zugang | ✓ | ✓ | ✓ | ✓ | |
Benutzerfreigabe | Nur für 1 Benutzer | Nur für 1 Benutzer | Bis zu 7 Benutzer | Unbegrenzter Benutzerzugriff | |
⨉ | ⨉ | ⨉ | ✓ | ||
Kostenlose Anpassung | Keine kostenlose Anpassung | Bis zu 30 Stunden Arbeit | Bis zu 60 Stunden Arbeit | Bis zu 80 Arbeitsstunden | |
Lieferformat |
| ⨉ | ✓ | ✓ | ✓ |
| ✓ | ⨉ | ✓ | ✓ | |
| ⨉ | ⨉ | ⨉ | ✓ | |
Analystenunterstützung | 2 Monate Analystenunterstützung | 4 Monate Analystenunterstützung | 7 Monate Analystenunterstützung | Ein Jahr Analystenbetreuung | |
Kostenloses Bericht-Update im nächsten Aktualisierungszyklus | ⨉ | ⨉ | ⨉ | ✓ | |
Kostenloses Branchen-Update (Innerhalb von 180 Tagen) | ⨉ | ⨉ | ⨉ | ✓ | |
Nutzen | Bis zu 10 % Rabatt nach dem Kauf | Bis zu 20 % Rabatt nach dem Kauf | Bis zu 30 % Rabatt nach dem Kauf | Bis zu 40 % Rabatt nach dem Kauf | |