Tabelle 1: Trends: Vergleich von Satellitenkonstellationsprojekten
Tabelle 2: Marktdynamik und Trends: Wirkungsanalyse der Marktdynamik
Tabelle 3: Wettbewerbsübersicht: Wettbewerberanalyse und Benchmarking
Tabelle 4: Weltweiter Markt für Laserkommunikation (Mio. US$), nach Typ, 2020–2033
Tabelle 5: Weltweiter Markt für Laserkommunikation (Mio. US$), nach Lösung, 2020–2033
Tabelle 6: Weltweiter Markt für Laserkommunikation (Mio. US$), nach Bereich,
Tabelle 7: Weltweiter Markt für Laserkommunikation (Mio. US$), nach Komponente, 2020–2033
Tabelle 8: Weltweiter Markt für Laserkommunikation (Mio. US$), nach Anwendung, 2020–2033
Tabelle 9: Weltweiter Markt für Laserkommunikation (Mio. US$), nach Endnutzern, 2020–2033
Tabelle 10: Weltweiter Markt für Laserkommunikation (Mio. US$), nach Region
Tabelle 11: Marktgröße für Laserkommunikation in Nordamerika (Mio. US$), nach Land,
Tabelle 12: Marktgröße für Laserkommunikation in Nordamerika (Mio. US$), nach Typ, 2020–2033;
Tabelle 13: Marktgröße für Laserkommunikation in Nordamerika (Mio. US$), nach Lösung, 2020–2033;
Tabelle 14: Marktgröße für Laserkommunikation in Nordamerika (Mio. US$), nach Bereich, 2020–2033;
Tabelle 15: Marktgröße für Laserkommunikation in Nordamerika (Mio. US$), nach Komponente, 2020–2033;
Tabelle 16: Marktgröße für Laserkommunikation in Nordamerika (Mio. US$), nach Anwendung, 2020–2033;
Tabelle 17: Marktgröße für Laserkommunikation in Nordamerika (Mio. US$), nach Endnutzern, 2020–2033;
Tabelle 18: Marktgröße für Laserkommunikation in Europa (Mio. US$), nach Land
Tabelle 19: Marktgröße für Laserkommunikation in Europa (Mio. US$), nach Typ,
Tabelle 20: Marktgröße für Laserkommunikation in Europa (Mio. US$), nach Lösung, 2020–2033
; Tabelle 21: Marktgröße für Laserkommunikation in Europa (Mio. US$), nach Bereich, 2020–2033;
Tabelle 22: Marktgröße für Laserkommunikation in Europa (Mio. US$), nach Komponente, 2020–2033;
Tabelle 23: Marktgröße für Laserkommunikation in Europa (Mio. US$), nach Anwendung, 2020–2033;
Tabelle 24: Marktgröße für Laserkommunikation in Europa (Mio. US$), nach Endnutzern, 2020–2033;
Tabelle 25: Marktgröße für Laserkommunikation im asiatisch-pazifischen Raum (Mio. US$), nach Land, 2020–2033;
Tabelle 26: Marktgröße für Laserkommunikation im asiatisch-pazifischen Raum (Mio. US$), nach Typ
Tabelle 27: Marktgröße für Laserkommunikation im asiatisch-pazifischen Raum (Mio. US$), nach Lösung,
Tabelle 28: Marktgröße für Laserkommunikation im asiatisch-pazifischen Raum (Mio. US$), nach Bereich, 2020–2033;
Tabelle 29: Marktgröße für Laserkommunikation im asiatisch-pazifischen Raum (Mio. US$), nach Komponente, 2020–2033;
Tabelle 30: Marktgröße für Laserkommunikation im asiatisch-pazifischen Raum (Mio. US$), nach Anwendung, 2020–2033
; Tabelle 31: Marktgröße für Laserkommunikation im asiatisch-pazifischen Raum (Mio. US$), nach Endnutzern, 2020–2033
; Tabelle 32: Marktgröße für Laserkommunikation in Südostasien (Mio. US$), nach Land, 2020–2033;
Tabelle 33: Marktgröße für Laserkommunikation in Südostasien (Mio. US$), nach Typ, 2020–2033;
Tabelle 34: Marktgröße für Laserkommunikation in Südostasien (Mio. US$), nach Lösung, 2020–2033
Tabelle 35: Marktgröße für Laserkommunikation in Südostasien (Mio. USD), nach Bereich 2020–2033
Tabelle 36: Marktgröße für Laserkommunikation in Südostasien (Mio. USD), nach Komponente 2020–2033
Tabelle 37: Marktgröße für Laserkommunikation in Südostasien (Mio. USD), nach Anwendung 2020–2033
Tabelle 38: Marktgröße für Laserkommunikation in Südostasien (Mio. USD), nach Endnutzer 2020–2033
Tabelle 39: Marktgröße für Laserkommunikation in Australien (Mio. USD), nach Typ 2020–2033
Tabelle 40: Marktgröße für Laserkommunikation in Australien (Mio. USD), nach Lösung 2020–2033
Tabelle 41: Marktgröße für Laserkommunikation in Australien (Mio. USD), nach Bereich 2020–2033
Tabelle 42: Marktgröße für Laserkommunikation in Australien (Mio. USD), nach Komponente
Tabelle 43: Marktgröße für Laserkommunikation in Australien (Mio. US$), nach Anwendung,
Tabelle 44: Marktgröße für Laserkommunikation in Australien (Mio. US$), nach Endnutzern, 2020–2033;
Tabelle 45: Marktgröße für Laserkommunikation im Nahen Osten und Afrika (Mio. US$), nach Land, 2020–2033;
Tabelle 46: Marktgröße für Laserkommunikation im Nahen Osten und Afrika (Mio. US$), nach Typ, 2020–2033;
Tabelle 47: Marktgröße für Laserkommunikation im Nahen Osten und Afrika (Mio. US$), nach Lösung, 2020–2033;
Tabelle 48: Marktgröße für Laserkommunikation im Nahen Osten und Afrika (Mio. US$), nach Bereich, 2020–2033;
Tabelle 49: Marktgröße für Laserkommunikation im Nahen Osten und Afrika (Mio. US$), nach Komponente, 2020–2033;
Tabelle 50: Markt für Laserkommunikation im Nahen Osten und Afrika Marktgröße (Mio. US$), nach Anwendung, 2020–2033
Tabelle: 51 Marktgröße für Laserkommunikation im Nahen Osten und Afrika (Mio. US$), nach Endnutzern, 2020–2033
Tabelle: 52 Marktgröße für Laserkommunikation in Südamerika (Mio. US$), nach Land, 2020–2033
Tabelle: 53 Marktgröße für Laserkommunikation in Südamerika (Mio. US$), nach Typ, 2020–2033
Tabelle: 54 Marktgröße für Laserkommunikation in Südamerika (Mio. US$), nach Lösung, 2020–2033
Tabelle: 55 Marktgröße für Laserkommunikation in Südamerika (Mio. US$), nach Bereich, 2020–2033
Tabelle: 56 Marktgröße für Laserkommunikation in Südamerika (Mio. US$), nach Komponente, 2020–2033
Tabelle: 57 Marktgröße für Laserkommunikation in Südamerika (Mio. US$), nach Anwendung, 2020–2033
Tabelle: 58 Südamerika Marktgröße für Laserkommunikation (Mio. US$), nach Endnutzern, 2020–2033
Tabelle: 59 AAC Clyde Space: Produkte
Tabelle: 60 AAC Clyde Space: Finanzanalyse
Tabelle: 61 Ball Aerospace and Technologies: Produkte
Tabelle: 62 Ball Aerospace and Technologies: Finanzanalyse
Tabelle: 63 Bridgecomm, Inc.: Produkte
Tabelle: 64 Fibertek, Inc.: Produkte
Tabelle: 65 Mynaric: Produkte
Tabelle: 66 Odysseus Space SA: Produkte
Tabelle: 67 Optical Physics Company: Produkte
Tabelle: 68 Space Micro Inc.: Produkte
Tabelle: 69 Tesat – Space Com GmbH & Co. KG: Produkte
Tabelle: 70 Thales Alenia Space: Produkte
Tabelle: 71 Thales-Gruppe (Muttergesellschaft): Finanzanalyse
Tabelle: 72 Weitere bedeutende Akteure
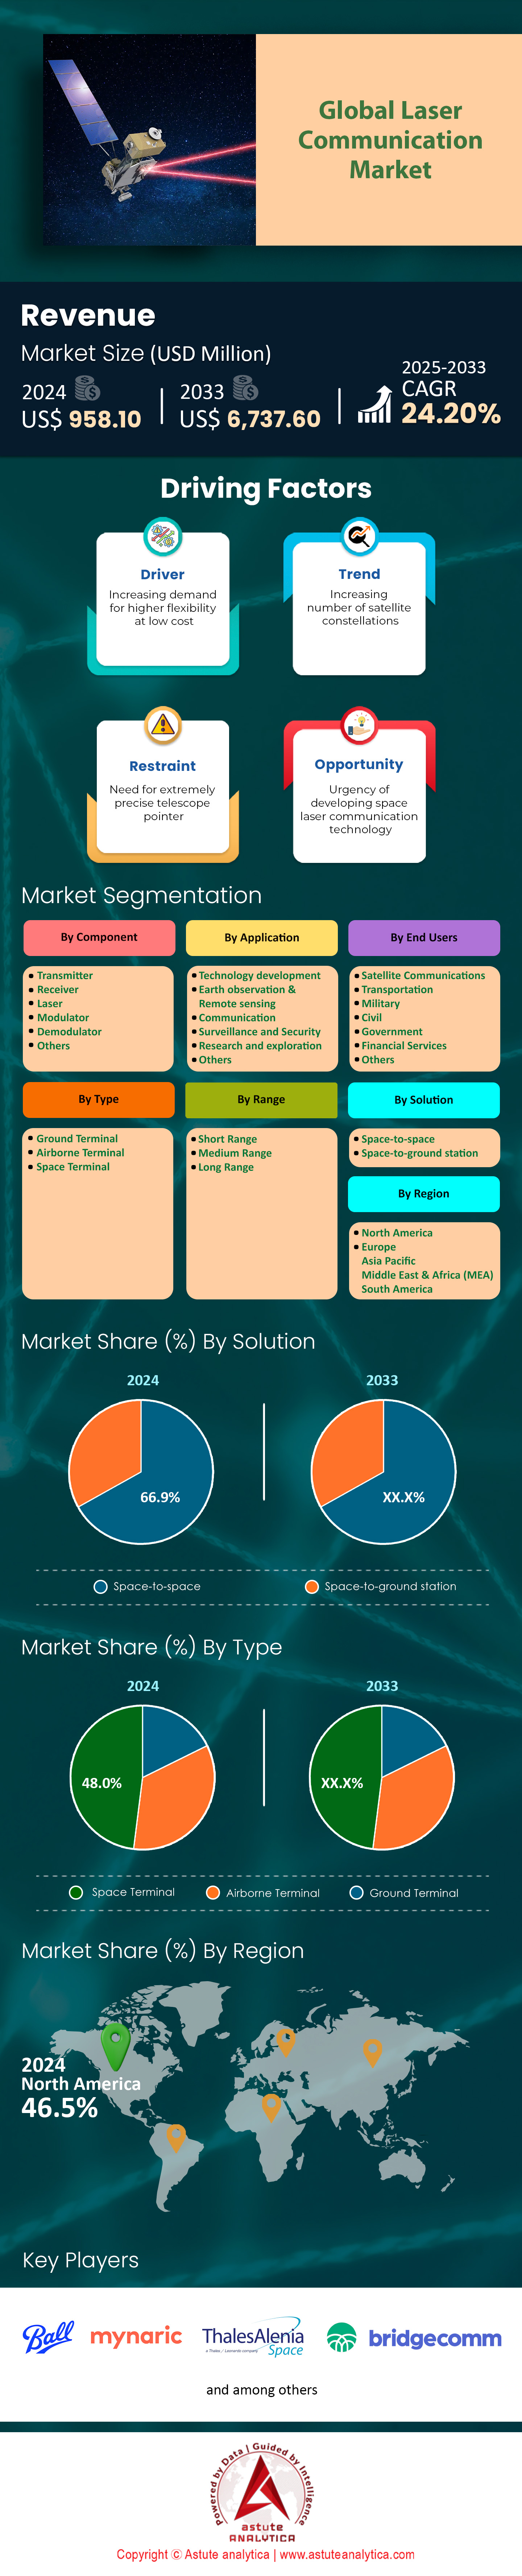
Abbildung 1: Zusammenfassung: Weltweiter Markt für Laserkommunikation, Wert (Mio. USD), 2020–2033.
Abbildung 2: Auswirkungen von Covid-19 und Erholung: Weltweiter Markt für Laserkommunikation, Auswirkungen von Covid-19 und Erholung, 2017–2033 (in %)
. Abbildung 3: Wettbewerbsübersicht – Weltweit: Marktanteilsanalyse nach Unternehmen, basierend auf dem Umsatz (2023).
Abbildung 4: Wettbewerbsübersicht – Südostasien und Australien: Marktanteilsanalyse nach Unternehmen, basierend auf dem Umsatz (2020) – Südostasien.
Abbildung 5: Wettbewerbsübersicht – Südostasien und Australien: Marktanteilsanalyse nach Unternehmen, basierend auf dem Umsatz (2020) – Australien.
Abbildung 6: Weltweiter Markt für Laserkommunikation, nach Typ, CAGR (%), 2024–2033.
Abbildung 7: Weltweiter Marktanteil für Laserkommunikation (%), nach Typ, 2024.
Abbildung 8: Weltweiter Marktanteil für Laserkommunikation (%), nach Typ, 2033.
Abbildung 9: Weltweiter Markt für Laserkommunikation, nach Lösung, CAGR. (%), 2024–2033
Abbildung 10: Weltweiter Marktanteil der Laserkommunikation (%), nach Lösung, 2024
Abbildung 11: Weltweiter Marktanteil der Laserkommunikation (%), nach Lösung, 2033
Abbildung 12: Weltweiter Markt für Laserkommunikation, nach Reichweite, CAGR (%), 2024–2033
Abbildung 13: Weltweiter Marktanteil der Laserkommunikation (%), nach Reichweite, 2024
Abbildung 14: Weltweiter Marktanteil der Laserkommunikation (%), nach Reichweite, 2033
Abbildung 15: Weltweiter Markt für Laserkommunikation, nach Komponente, CAGR (%), 2024–2033
Abbildung 16: Weltweiter Marktanteil der Laserkommunikation (%), nach Komponente, 2024
Abbildung 17: Weltweiter Marktanteil der Laserkommunikation (%), nach Komponente, 2033
Abbildung 18: Weltweiter Markt für Laserkommunikation, nach Anwendung, CAGR (%), 2024–2033
Abbildung 19: Weltweiter Marktanteil der Laserkommunikation (%), nach Anwendung, 2024
Abbildung 20: Weltweiter Marktanteil der Laserkommunikation (%), nach Anwendung, 2033;
Abbildung 21: Weltweiter Markt für Laserkommunikation, nach Endnutzern, CAGR (%), 2024–2033;
Abbildung 22: Weltweiter Marktanteil der Laserkommunikation (%), nach Endnutzern, 2024;
Abbildung 23: Weltweiter Marktanteil der Laserkommunikation (%), nach Endnutzern, 2033;
Abbildung 24: Weltweiter Markt für Laserkommunikation, nach Region, CAGR (%), 2024–2033;
Abbildung 25: Weltweiter Marktanteil der Laserkommunikation (%), nach Region, 2024;
Abbildung 26: Weltweiter Marktanteil der Laserkommunikation (%), nach Region, 2033;
Abbildung 27: Nordamerika: Segment mit dem höchsten Anteil (%)
; Abbildung 28: Nordamerika: Nettopotenzialzuwachs, Mio. USD;
Abbildung 29: Nordamerika: Wirkungsanalyse – Diagramm
; Abbildung 30: Nordamerika: Potenzialanalyse, nach Typ, 2024–2033;
Abbildung 31: Nordamerika: Chancenanalyse nach Lösung, 2024–2033
Abbildung: 32 Nordamerika: Chancenanalyse nach Bereich, 2024–2033
Abbildung: 33 Nordamerika: Chancenanalyse nach Komponente, 2024–2033
Abbildung: 34 Nordamerika: Chancenanalyse nach Anwendung, 2022–2020
Abbildung: 35 Nordamerika: Chancenanalyse nach Endnutzern, 2024–2033
Abbildung: 36 Marktanteil der Laserkommunikation in Nordamerika (%), nach Land, 2024
Abbildung: 37 Marktanteil der Laserkommunikation in Nordamerika (%), nach Land, 2033 Abbildung
: 38 Marktanteil der Laserkommunikation in Nordamerika (%), nach Typ, 2024 Abbildung:
39 Marktanteil der Laserkommunikation in Nordamerika (%), nach Typ, 2033
Abbildung: 40 Marktanteil der Laserkommunikation in Nordamerika (%), nach Lösung, 2024
Abbildung: 41 Markt für Laserkommunikation in Nordamerika Marktanteil (%), nach Lösung, 2033
Abbildung: 42 Marktanteil Nordamerika Laserkommunikation (%), nach Reichweite, 2024
Abbildung: 43 Marktanteil Nordamerika Laserkommunikation (%), nach Reichweite, 2033
Abbildung: 44 Marktanteil Nordamerika Laserkommunikation (%), nach Komponente, 2024
Abbildung: 45 Marktanteil Nordamerika Laserkommunikation (%), nach Komponente, 2033
Abbildung: 46 Marktanteil Nordamerika Laserkommunikation (%), nach Anwendung, 2024
Abbildung: 47 Marktanteil Nordamerika Laserkommunikation (%), nach Anwendung, 2033
Abbildung: 48 Marktanteil Nordamerika Laserkommunikation (%), nach Endnutzern, 2024
Abbildung: 49 Marktanteil Nordamerika Laserkommunikation (%), nach Endnutzern, 2033
Abbildung: 50 Europa: Segment mit dem höchsten Anteil (%)
Abbildung: 51 Europa: Nettopotenzialzuwachs, Mio. USD
Abbildung: 52 Europa: Wirkungsanalyse – Diagramm
Abbildung: 53 Europa: Chancenbewertung
Europa: Chancenanalyse
: Chancenanalyse nach Lösung, 2024–2033 Abbildung: 55 Europa
: Chancenanalyse nach Reichweite, 2024–2033 Abbildung: 56 Europa: Chancenanalyse nach Komponente, 2024–2033
Abbildung: 57 Europa: Chancenanalyse nach Anwendung, 2022–2020
Abbildung: 58 Europa: Chancenanalyse nach Endnutzern, 2024–2033
Abbildung: 59 Marktanteil der Laserkommunikation in Europa (%), nach Land, 2024
Abbildung: 60 Marktanteil der Laserkommunikation in Europa (%), nach Land, 2033
Abbildung: 61 Marktanteil der Laserkommunikation in Europa (%), nach Typ, 2024
Abbildung: 62 Marktanteil der Laserkommunikation in Europa (%), nach Typ, 2033
Abbildung: 63 Marktanteil der Laserkommunikation in Europa (%), nach Lösung
: Marktanteil der Laserkommunikation in Europa (%), nach Lösung, 2033
; Abbildung 65: Marktanteil der Laserkommunikation in Europa (%), nach Reichweite, 2024;
Abbildung 66: Marktanteil der Laserkommunikation in Europa (%), nach Reichweite, 2033;
Abbildung 67: Marktanteil der Laserkommunikation in Europa (%), nach Komponente, 2024
; Abbildung 68: Marktanteil der Laserkommunikation in Europa (%), nach Komponente, 2033;
Abbildung 69: Marktanteil der Laserkommunikation in Europa (%), nach Anwendung, 2024;
Abbildung 70: Marktanteil der Laserkommunikation in Europa (%), nach Anwendung, 2033;
Abbildung 71: Marktanteil der Laserkommunikation in Europa (%), nach Endnutzern, 2024;
Abbildung 72: Marktanteil der Laserkommunikation in Europa (%), nach Endnutzern, 2033
; Abbildung 73: Asien-Pazifik: Segment mit dem höchsten Anteil (%)
; Abbildung 74: Asien-Pazifik: Nettopotenzialzuwachs (Mio. USD)
; Abbildung 75: Asien-Pazifik: Wirkungsanalyse –
Diagramm 76 Asien-Pazifik: Chancenanalyse nach Typ, 2024–2033
Abbildung: 77 Asien-Pazifik: Chancenanalyse nach Lösung, 2024–2033
Abbildung: 78 Asien-Pazifik: Chancenanalyse nach Bereich, 2024–2033
Abbildung: 79 Asien-Pazifik: Chancenanalyse nach Komponente, 2024–2033
Abbildung: 80 Asien-Pazifik: Chancenanalyse nach Anwendung, 2022–2020
Abbildung: 81 Asien-Pazifik: Chancenanalyse nach Endnutzern, 2024–2033
Abbildung: 82 Marktanteil der Laserkommunikation in Asien-Pazifik (%), nach Land, 2024
Abbildung: 83 Marktanteil der Laserkommunikation in Asien-Pazifik (%), nach Land, 2033
Abbildung: 84 Marktanteil der Laserkommunikation in Asien-Pazifik (%), nach Typ, 2024
Abbildung: 85 Marktanteil der Laserkommunikation in Asien-Pazifik (%), nach Typ 2033
Abbildung: 86 Marktanteil der Laserkommunikation im asiatisch-pazifischen Raum (%), nach Lösung, 2024
Abbildung: 87 Marktanteil der Laserkommunikation im asiatisch-pazifischen Raum (%), nach Lösung, 2033
Abbildung: 88 Marktanteil der Laserkommunikation im asiatisch-pazifischen Raum (%), nach Reichweite, 2024
Abbildung: 89 Marktanteil der Laserkommunikation im asiatisch-pazifischen Raum (%), nach Reichweite, 2033
Abbildung: 90 Marktanteil der Laserkommunikation im asiatisch-pazifischen Raum (%), nach Komponente, 2024
Abbildung: 91 Marktanteil der Laserkommunikation im asiatisch-pazifischen Raum (%), nach Komponente, 2033
Abbildung: 92 Marktanteil der Laserkommunikation im asiatisch-pazifischen Raum (%), nach Anwendung, 2024
Abbildung: 93 Marktanteil der Laserkommunikation im asiatisch-pazifischen Raum (%), nach Anwendung, 2033
Abbildung: 94 Marktanteil der Laserkommunikation im asiatisch-pazifischen Raum (%), nach Endnutzern, 2024
Abbildung: 95 Marktanteil der Laserkommunikation im asiatisch-pazifischen Raum (%), nach Endnutzern, 2033
Abbildung: 96 Südostasien: Segment mit dem höchsten Anteil (%) Abbildung
: 97 Südostasien: Netto-Potenzialzuwachs, Mio. USD
Abbildung: 98 Südostasien: Wirkungsanalyse – Diagramm
Abbildung: 99 Südostasien: Potenzialanalyse nach Typ, 2024–2033
Abbildung: 100 Südostasien: Potenzialanalyse nach Lösung, 2024–2033
Abbildung: 101 Südostasien: Potenzialanalyse nach Bereich, 2024–2033
Abbildung: 102 Südostasien: Potenzialanalyse nach Komponente, 2024–2033
Abbildung: 103 Südostasien: Potenzialanalyse nach Anwendung, 2022–2020
Abbildung: 104 Südostasien: Potenzialanalyse nach Endnutzern, 2024–2033
Abbildung: 105 Marktanteil der Laserkommunikation in Südostasien (%), nach Land, 2024
Abbildung: 106 Marktanteil der Laserkommunikation in Südostasien (%), nach Land, 2033
Abbildung: 107 Südostasien Marktanteile der Laserkommunikation in Asien (%), nach Typ, 2024
Abbildung: 108 Marktanteile der Laserkommunikation in Südostasien (%), nach Typ, 2033
Abbildung: 109 Marktanteile der Laserkommunikation in Südostasien (%), nach Lösung, 2024
Abbildung: 110 Marktanteile der Laserkommunikation in Südostasien (%), nach Lösung, 2033
Abbildung: 111 Marktanteile der Laserkommunikation in Südostasien (%), nach Reichweite, 2024
Abbildung: 112 Marktanteile der Laserkommunikation in Südostasien (%), nach Reichweite, 2033
Abbildung: 113 Marktanteile der Laserkommunikation in Südostasien (%), nach Komponente, 2024
Abbildung: 114 Marktanteile der Laserkommunikation in Südostasien (%), nach Komponente, 2033
Abbildung: 115 Marktanteile der Laserkommunikation in Südostasien (%), nach Anwendung, 2024
Abbildung: 116 Marktanteile der Laserkommunikation in Südostasien (%), nach Anwendung, 2033
Abbildung: 117 Marktanteile der Laserkommunikation in Südostasien (%), nach Endnutzern
: Marktanteil Südostasiens (%), nach Endnutzern, 2033;
Abbildung 119: Australien: Segment mit dem höchsten Anteil (%);
Abbildung 120: Australien: Netto-Potenzialzuwachs (Mio. USD)
; Abbildung 121: Australien: Wirkungsanalyse – Diagramm
; Abbildung 122: Australien: Potenzialanalyse nach Typ, 2024–2033;
Abbildung 123: Australien: Potenzialanalyse nach Lösung, 2024–2033
; Abbildung 124: Australien: Potenzialanalyse nach Produktpalette, 2024–2033;
Abbildung 125: Australien: Potenzialanalyse nach Komponente, 2024–2033
; Abbildung 126: Australien: Potenzialanalyse nach Anwendung, 2024–2033;
Abbildung 127: Australien: Potenzialanalyse nach Endnutzern, 2024–2033;
Abbildung 128: Australien Laser Marktanteile der Laserkommunikation
in Australien (%), nach Typ, 2024 Abbildung: 129 Marktanteile der Laserkommunikation
in Australien (%), nach Typ, 2033 Abbildung: 130 Marktanteile der Laserkommunikation in Australien (%), nach Lösung, 2024
Abbildung: 131 Marktanteile der Laserkommunikation in Australien (%), nach Lösung, 2033
Abbildung: 132 Marktanteile der Laserkommunikation in Australien (%), nach Reichweite, 2024
Abbildung: 133 Marktanteile der Laserkommunikation in Australien (%), nach Reichweite, 2033
Abbildung: 134 Marktanteile der Laserkommunikation in Australien (%), nach Komponente, 2024
Abbildung: 135 Marktanteile der Laserkommunikation in Australien (%), nach Komponente, 2033
Abbildung: 136 Marktanteile der Laserkommunikation in Australien (%), nach Anwendung, 2024
Abbildung: 137 Marktanteile der Laserkommunikation in Australien (%), nach Anwendung, 2033
Abbildung: 138 Marktanteile der Laserkommunikation in Australien (%), nach Endnutzern, 2024
Abbildung: 139 Marktanteile der Laserkommunikation in Australien (%), nach Endnutzern, 2033
Abbildung: 140 Naher Osten & Afrika: Segment mit dem höchsten Anteil (%)
Abbildung: 141 Naher Osten & Afrika: Netto-Potenzialzuwachs, Mio. USD
Abbildung: 142 Naher Osten & Afrika: Wirkungsanalyse – Diagramm
Abbildung: 143 Naher Osten & Afrika: Chancenbewertung nach Typ, 2024–2033
Abbildung: 144 Naher Osten & Afrika: Chancenbewertung nach Lösung, 2024–2033
Abbildung: 145 Naher Osten & Afrika: Chancenbewertung nach Bereich, 2024–2033
Abbildung: 146 Naher Osten & Afrika: Chancenbewertung nach Komponente, 2024–2033
Abbildung: 147 Naher Osten & Afrika: Chancenbewertung nach Anwendung, 2022–2020
Abbildung: 148 Naher Osten & Afrika: Chancenbewertung nach Endnutzern, 2024–2033
Abbildung: 149 Marktanteil der Laserkommunikation im Nahen Osten und Afrika (%), nach Ländern, 2024
Abbildung: 150 Marktanteil der Laserkommunikation im Nahen Osten und Afrika (%), nach Ländern, 2033
Abbildung: 151 Marktanteil der Laserkommunikation im Nahen Osten und Afrika (%), nach Typ, 2024
Abbildung: 152 Marktanteil der Laserkommunikation im Nahen Osten und Afrika (%), nach Typ, 2033
Abbildung: 153 Marktanteil der Laserkommunikation im Nahen Osten und Afrika (%), nach Lösung, 2024
Abbildung: 154 Marktanteil der Laserkommunikation im Nahen Osten und Afrika (%), nach Lösung, 2033
Abbildung: 155 Marktanteil der Laserkommunikation im Nahen Osten und Afrika (%), nach Reichweite, 2024
Abbildung: 156 Marktanteil der Laserkommunikation im Nahen Osten und Afrika (%), nach Reichweite, 2033
Abbildung: 157 Marktanteil der Laserkommunikation im Nahen Osten und Afrika (%), nach Komponente, 2024
Abbildung: 158 Marktanteil der Laserkommunikation im Nahen Osten und Afrika (%), nach Komponente
: Marktanteil der Laserkommunikation im Nahen Osten und Afrika (%), nach Anwendung, 2024;
Abbildung 160: Marktanteil der Laserkommunikation im Nahen Osten und Afrika (%), nach Anwendung, 2033;
Abbildung 161: Marktanteil der Laserkommunikation im Nahen Osten und Afrika (%), nach Endnutzern, 2024;
Abbildung 162: Marktanteil der Laserkommunikation im Nahen Osten und Afrika (%), nach Endnutzern, 2033;
Abbildung 163: Südamerika: Segment mit dem höchsten Anteil (%)
; Abbildung 164: Südamerika: Nettopotenzialzuwachs (Mio. USD)
; Abbildung 165: Südamerika: Wirkungsanalyse – Diagramm
; Abbildung 166: Südamerika: Potenzialanalyse nach Typ, 2024–2033
; Abbildung 167: Südamerika: Potenzialanalyse nach Lösung, 2024–2033
; Abbildung 168: Südamerika: Potenzialanalyse nach Reichweite, 2024–2033
; Abbildung 169 Südamerika: Chancenanalyse nach Komponente, 2024–2033
Abbildung: 170 Südamerika: Chancenanalyse nach Anwendung, 2024–2033
Abbildung: 171 Südamerika: Chancenanalyse nach Endnutzern, 2024–2033
Abbildung: 172 Marktanteil der Laserkommunikation in Südamerika (%) nach Land, 2024
Abbildung: 173 Marktanteil der Laserkommunikation in Südamerika (%) nach Land, 2033
Abbildung: 174 Marktanteil der Laserkommunikation in Südamerika (%) nach Typ,
Abbildung: 175 Marktanteil der Laserkommunikation in Südamerika (%) nach Typ, 2033
Abbildung: 176 Marktanteil der Laserkommunikation in Südamerika (%) nach Lösung, 2024
Abbildung: 177 Marktanteil der Laserkommunikation in Südamerika (%) nach Lösung, 2033
Abbildung: 178 Marktanteil der Laserkommunikation in Südamerika (%) nach Reichweite, 2024
Abbildung: 179 Marktanteile der Laserkommunikation in Südamerika (%), nach Reichweite, 2033
Abbildung: 180 Marktanteile der Laserkommunikation in Südamerika (%), nach Komponente, 2024
Abbildung: 181 Marktanteile der Laserkommunikation in Südamerika (%), nach Komponente, 2033
Abbildung: 182 Marktanteile der Laserkommunikation in Südamerika (%), nach Anwendung, 2024
Abbildung: 183 Marktanteile der Laserkommunikation in Südamerika (%), nach Anwendung, 2033
Abbildung: 184 Marktanteile der Laserkommunikation in Südamerika (%), nach Endnutzern, 2024
Abbildung: 185 Marktanteile der Laserkommunikation in Südamerika (%), nach Endnutzern, 2033
Abbildung: 186 AAC Clyde Space: Umsatzsegmentierung, 2024
Abbildung: 187 AAC Clyde Space: Geografische Umsatzsegmentierung, 2024
Abbildung: 188 Ball Aerospace and Technologies: Umsatzsegmentierung, 2024
Abbildung: 189 Thales Alenia Space: Umsatzsegmentierung
: 190 Thales Alenia Space: Geografische Umsatzsegmentierung, 2024


Merkmale | Lizenzart | ||||
Datenbuch | Einzelbenutzer |   Mehrere Benutzer | Unternehmen | ||
| E-Zugang | ✓ | ✓ | ✓ | ✓ | |
Benutzerfreigabe | Nur für 1 Benutzer | Nur für 1 Benutzer | Bis zu 7 Benutzer | Unbegrenzter Benutzerzugriff | |
⨉ | ⨉ | ⨉ | ✓ | ||
Kostenlose Anpassung | Keine kostenlose Anpassung | Bis zu 30 Stunden Arbeit | Bis zu 60 Stunden Arbeit | Bis zu 80 Arbeitsstunden | |
Lieferformat |
| ⨉ | ✓ | ✓ | ✓ |
| ✓ | ⨉ | ✓ | ✓ | |
| ⨉ | ⨉ | ⨉ | ✓ | |
Analystenunterstützung | 2 Monate Analystenunterstützung | 4 Monate Analystenunterstützung | 7 Monate Analystenunterstützung | Ein Jahr Analystenbetreuung | |
Kostenloses Bericht-Update im nächsten Aktualisierungszyklus | ⨉ | ⨉ | ⨉ | ✓ | |
Kostenloses Branchen-Update (Innerhalb von 180 Tagen) | ⨉ | ⨉ | ⨉ | ✓ | |
Nutzen | Bis zu 10 % Rabatt nach dem Kauf | Bis zu 20 % Rabatt nach dem Kauf | Bis zu 30 % Rabatt nach dem Kauf | Bis zu 40 % Rabatt nach dem Kauf | |