Tabelle 1. Preisanalyse nach Gerätetyp (Durchschnittspreis in US-Dollar/Einheit)
Tabelle 2. Marktgröße für Neurostimulationsgeräte (Mrd. US-Dollar) nach Gerätetyp, 2020–2033
Tabelle 3. Marktgröße für Neurostimulationsgeräte (Tsd. Einheiten) nach Gerätetyp, 2020–2033
Tabelle 4. Marktgröße für Neurostimulationsgeräte (Mrd. US-Dollar) nach Anwendung, 2020–2033
Tabelle 5. Marktgröße für Neurostimulationsgeräte (Tsd. Einheiten) nach Anwendung, 2020–2033
Tabelle 6. Marktgröße für Neurostimulationsgeräte (Mrd. US-Dollar) nach Endnutzer, 2020–2033
Tabelle 7. Marktgröße für Neurostimulationsgeräte (Tsd. Einheiten) nach Endnutzer, 2020–2033
Tabelle 8. Weltweite Marktgröße für Neurostimulationsgeräte (Mrd. US-Dollar) nach Region,
2020–2033 9. Marktgröße für Neurostimulationsgeräte (in Tsd. Einheiten) nach Region, 2020–2033
Tabelle 10. Marktgröße für Neurostimulationsgeräte in Nordamerika (in Mrd. US-Dollar) nach Land, 2020–2033
Tabelle 11. Marktgröße für Neurostimulationsgeräte in Nordamerika (in Tsd. Einheiten) nach Land, 2020–2033
Tabelle 12. Marktgröße für Neurostimulationsgeräte in Nordamerika (in Mrd. US-Dollar) nach Gerätetyp, 2020–2033
Tabelle 13. Marktgröße für Neurostimulationsgeräte in Nordamerika (in Tsd. Einheiten) nach Gerätetyp, 2020–2033
Tabelle 14. Marktgröße für Neurostimulationsgeräte in Nordamerika (in Mrd. US-Dollar) nach Anwendung, 2020–2033
Tabelle 15. Marktgröße für Neurostimulationsgeräte in Nordamerika (in Tsd. Einheiten) nach Anwendung, 2020–2033
Tabelle 16. Marktgröße für Neurostimulationsgeräte in Nordamerika
Tabelle 17. Marktgröße für Neurostimulationsgeräte in Nordamerika
Tabelle 18. Marktgröße für Neurostimulationsgeräte in Europa (in Tsd. Einheiten), nach Land,
Tabelle 19. Marktgröße für Neurostimulationsgeräte in Europa (in Tsd. Einheiten), nach Land, 2020–2033 Tabelle 20.
Marktgröße für Neurostimulationsgeräte in Europa (in Tsd. Einheiten), nach Gerätetyp, 2020–2033
Tabelle 21. Marktgröße für Neurostimulationsgeräte in Europa (in Tsd. Einheiten), nach Gerätetyp, 2020–2033
Tabelle 22. Marktgröße für Neurostimulationsgeräte in Europa (in Tsd. Einheiten), nach Anwendung, 2020–2033
Tabelle 23. Marktgröße für Neurostimulationsgeräte in Europa (in Tsd. Einheiten), nach Anwendung
Tabelle 24. Marktgröße für Neurostimulationsgeräte in Europa (Mrd. US$), nach Endnutzer,
Tabelle 25. Marktgröße für Neurostimulationsgeräte in Europa (Tsd. Einheiten), nach Endnutzer, 2020–2033
Tabelle 26. Marktgröße für Neurostimulationsgeräte im asiatisch-pazifischen Raum (Mrd. US$), nach Land, 2020–2033
Tabelle 27. Marktgröße für Neurostimulationsgeräte im asiatisch-pazifischen Raum (Tsd. Einheiten), nach Land, 2020–2033
Tabelle 28. Marktgröße für Neurostimulationsgeräte im asiatisch-pazifischen Raum (Mrd. US$), nach Gerätetyp, 2020–2033
Tabelle 29. Marktgröße für Neurostimulationsgeräte im asiatisch-pazifischen Raum (Tsd. Einheiten), nach Gerätetyp, 2020–2033
Tabelle 30. Marktgröße für Neurostimulationsgeräte im asiatisch-pazifischen Raum (Mrd. US$), nach Anwendung
Tabelle 31. Marktgröße für Neurostimulationsgeräte im asiatisch-pazifischen Raum (in Tsd. Einheiten), nach Anwendung, 2020–2033
32. Marktgröße für Neurostimulationsgeräte im asiatisch-pazifischen Raum (in Mrd. US$), nach Endnutzer, 2020–2033
Tabelle 33. Marktgröße für Neurostimulationsgeräte im asiatisch-pazifischen Raum (in Tsd. Einheiten), nach Endnutzer, 2020–2033
Tabelle 34. Marktgröße für Neurostimulationsgeräte im Nahen Osten und Afrika (in Mrd. US$), nach Land, 2020–2033
Tabelle 35. Marktgröße für Neurostimulationsgeräte im Nahen Osten und Afrika (in Tsd. Einheiten), nach Land, 2020–2033
Tabelle 36. Marktgröße für Neurostimulationsgeräte im Nahen Osten und Afrika (in Mrd. US$), nach Gerätetyp, 2020–2033
Tabelle 37. Marktgröße für Neurostimulationsgeräte im Nahen Osten und Afrika (in Tsd. Einheiten)
Tabelle 38. Marktgröße für Neurostimulationsgeräte im Nahen Osten und Afrika (Mrd. US$), nach Anwendung, 2020–2033
39. Marktgröße für Neurostimulationsgeräte im Nahen Osten und Afrika (Tsd. Einheiten), nach Gerätetyp, 2020–2033
Tabelle 40. Marktgröße für Neurostimulationsgeräte im Nahen Osten und Afrika (Mrd. US$), nach Endnutzer, 2020–2033
Tabelle 41. Marktgröße für Neurostimulationsgeräte im Nahen Osten und Afrika (Tsd. Einheiten), nach Endnutzer, 2020–2033
Tabelle 42. Marktgröße für Neurostimulationsgeräte in Südamerika (Mrd. US$), nach Land, 2020–2033
Tabelle 43. Marktgröße für Neurostimulationsgeräte in Südamerika (Tsd. Einheiten), nach Land, 2020–2033
Tabelle 44. Marktgröße für Neurostimulationsgeräte in Südamerika (Mrd. US$)
Tabelle 45. Südamerika Marktgröße für Neurostimulationsgeräte (Tsd. Einheiten
Tabelle 46. Südamerika Marktgröße für Neurostimulationsgeräte (Mrd. US$),
Südamerika Marktgröße für Neurostimulationsgeräte (Tsd. Einheiten), nach Anwendung, 2020–2033 Tabelle 48. Südamerika Marktgröße für Neurostimulationsgeräte
(Mrd. US$), nach Endnutzer, 2020–2033
Tabelle 49. Südamerika Marktgröße für Neurostimulationsgeräte (Tsd. Einheiten), nach Endnutzer, 2020–2033
Tabelle 50. Abbott Laboratories: Finanzanalyse
Tabelle 51.B. Braun Melsungen AG: Finanzanalyse
Tabelle 52. Boston Scientific Corporation: Finanzanalyse
Tabelle 53. BrainsWay: Finanzanalyse
Tabelle 54. Cochlear: Finanzanalyse
Tabelle 55. CONMED Corporation: Finanzanalyse
Tabelle 56. Koninklijke Philips: Finanzanalyse
Tabelle 57. Medtronic PLC: Finanzanalyse
Tabelle 58. Zimmer Biomet Holdings, Inc.: Finanzanalyse
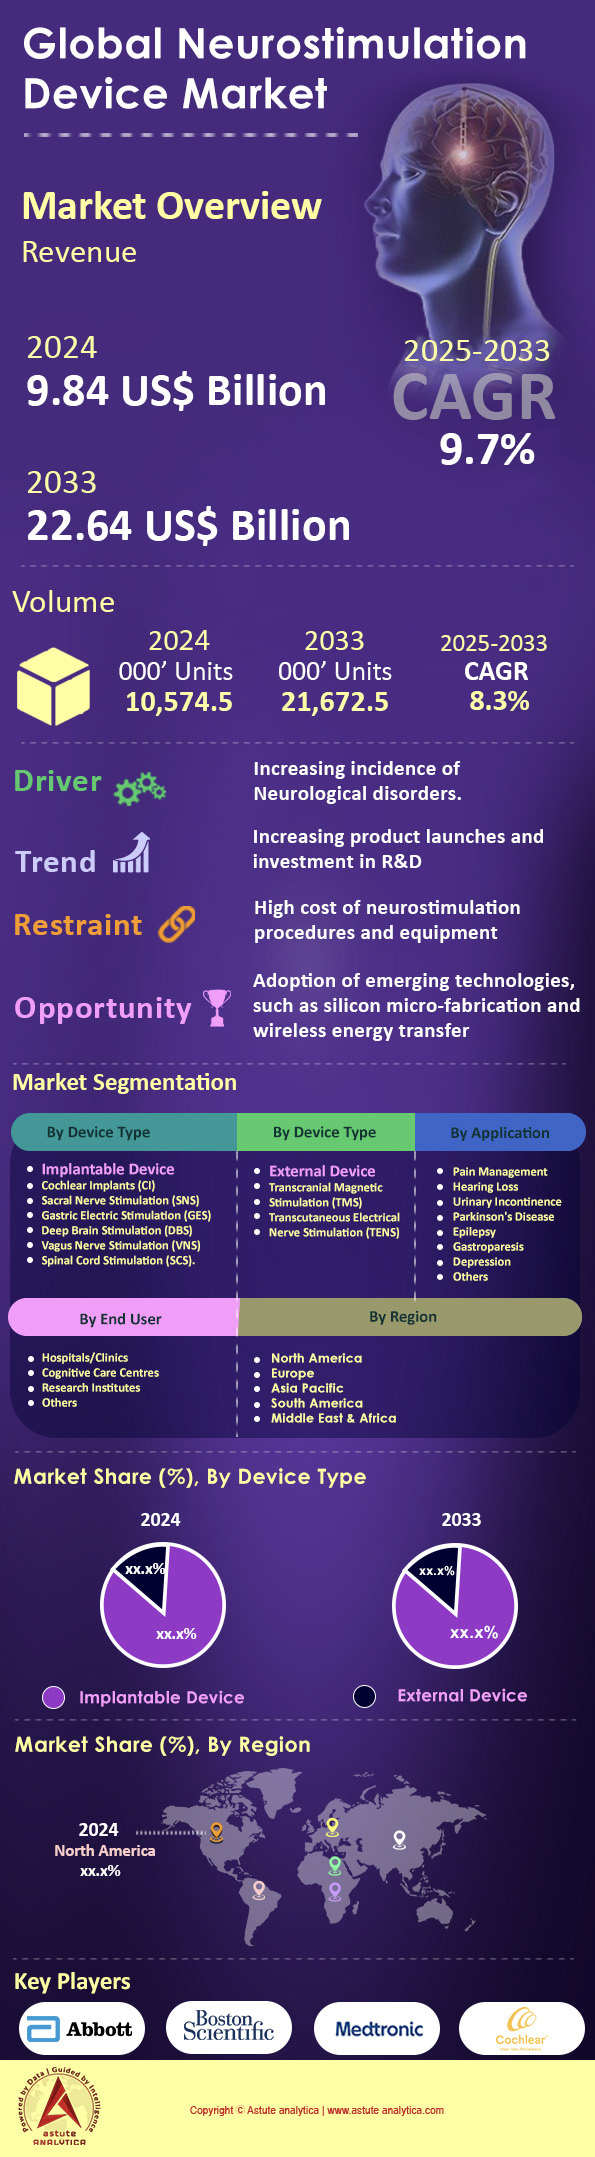
Abbildung 1: Weltweiter Markt für Neurostimulationsgeräte, Umsatz (Mio. US$) & Absatzmenge (Tsd. Einheiten), 2020–2033.
Abbildung 2: Belastung durch neurologische Erkrankungen in den USA nach Ländern, Rate pro 100.000 Einwohner.
Abbildung 3: Verlorene Lebensjahre und behinderungsbereinigte Lebensjahre nach Krankheitsbereich (2020).
Abbildung 4: Markt für Neurostimulationsgeräte, Auswirkungen von COVID-19 & Erholung, 2020–2033 (in %).
Abbildung 5: Marktanteilsanalyse nach Unternehmen, basierend auf dem Umsatz (2020).
Abbildung 6: Marktanalyse für Neurostimulationsgeräte nach Gerätetyp, CAGR (%), 2024–2033.
7: Marktanteil von Neurostimulationsgeräten (%), nach Gerätetyp, 2024.
Abbildung 8: Marktanteil von Neurostimulationsgeräten (%), nach Gerätetyp, 2033.
Abbildung 9: Marktanalyse für Neurostimulationsgeräte nach Anwendung, CAGR. (%), 2024–2033
Abbildung 10: Marktanteil von Neurostimulationsgeräten (%), nach Anwendung, 2024
Abbildung 11: Marktanteil von Neurostimulationsgeräten (%), nach Anwendung, 2033
Abbildung 12: Marktanalyse für Neurostimulationsgeräte, nach Endnutzer, CAGR (%), 2024–2033
Abbildung 13: Marktanteil von Neurostimulationsgeräten (%), nach Endnutzer, 2024
Abbildung 14: Marktanteil von Neurostimulationsgeräten (%), nach Endnutzer, 2033
Abbildung 15: Globale Marktanalyse für Neurostimulationsgeräte, nach Region, CAGR (%), 2024–2033
Abbildung 16: Globaler Markt für Neurostimulationsgeräte, nach Region, 2024
Abbildung 17: Globaler Markt für Neurostimulationsgeräte, nach Region, 2033
Abbildung 18: Nordamerikanischer Markt für Neurostimulationsgeräte: Segment mit dem höchsten Anteil (%)
Abbildung 19: Nordamerikanischer Markt für Neurostimulationsgeräte: Netto Zusätzliches Potenzial (in Mio. US$)
Abbildung 20: Markt für Neurostimulationsgeräte in Nordamerika: Wirkungsanalyse
Abbildung 21: Markt für Neurostimulationsgeräte in Nordamerika: Potenzialanalyse nach Gerätetyp
Abbildung 22: Markt für Neurostimulationsgeräte in Nordamerika: Potenzialanalyse nach Anwendung
Abbildung 23: Markt für Neurostimulationsgeräte in Nordamerika: Potenzialanalyse nach Endnutzer
Abbildung 24: Marktanteil (%) am nordamerikanischen Markt für Neurostimulationsgeräte nach Land, 2024
Abbildung 25: Marktanteil (%) am nordamerikanischen Markt für Neurostimulationsgeräte nach Land, 2033
Abbildung 26: Marktanteil (%) am nordamerikanischen Markt für Neurostimulationsgeräte nach Gerätetyp, 2024
Abbildung 27: Marktanteil (%) am nordamerikanischen Markt für Neurostimulationsgeräte nach Gerätetyp, 2033
Abbildung 28: Marktanteil (%) am nordamerikanischen Markt für Neurostimulationsgeräte nach Anwendung, 2024
Abbildung 29: Marktanteil (%) am nordamerikanischen Markt für Neurostimulationsgeräte nach Anwendung, 2033
Abbildung 30: Nordamerika Marktanteile von Neurostimulationsgeräten (%), nach Endnutzer, 2024
Abbildung 31: Marktanteile von Neurostimulationsgeräten in Nordamerika (%), nach Endnutzer, 2033
Abbildung 32: Markt für Neurostimulationsgeräte in Europa: Segment mit dem höchsten Anteil (%)
Abbildung 33: Markt für Neurostimulationsgeräte in Europa: Nettopotenzialzuwachs in Mio. US$
Abbildung 34: Markt für Neurostimulationsgeräte in Europa: Wirkungsanalyse
Abbildung 35: Markt für Neurostimulationsgeräte in Europa: Potenzialanalyse nach Gerätetyp
Abbildung 36: Markt für Neurostimulationsgeräte in Europa: Potenzialanalyse nach Anwendung
Abbildung 37: Markt für Neurostimulationsgeräte in Europa: Potenzialanalyse nach Endnutzer
Abbildung 38: Marktanteile von Neurostimulationsgeräten in Europa (%), nach Land, 2024
Abbildung 39: Marktanteile von Neurostimulationsgeräten in Europa (%), nach Land, 2033
Abbildung 40: Marktanteile von Neurostimulationsgeräten in Europa (%), nach Gerätetyp, 2024
Abbildung 41: Marktanteile von Neurostimulationsgeräten in Europa (%), nach Gerätetyp, 2033
Abbildung 42: Marktanteil von Neurostimulationsgeräten in Europa (%), nach Anwendung, 2024
Abbildung 43: Marktanteil von Neurostimulationsgeräten in Europa (%), nach Anwendung, 2033 Abbildung
44: Marktanteil von Neurostimulationsgeräten in Europa (%), nach Endnutzer, 2024 Abbildung
45: Marktanteil von Neurostimulationsgeräten in Europa (%), nach Endnutzer, 2033
Abbildung 46: Markt für Neurostimulationsgeräte im asiatisch-pazifischen Raum: Segment mit dem höchsten Anteil (%) Abbildung
47: Markt für Neurostimulationsgeräte im asiatisch-pazifischen Raum: Nettopotenzialzuwachs in Mio. US$
Abbildung 48: Markt für Neurostimulationsgeräte im asiatisch-pazifischen Raum: Wirkungsanalyse
Abbildung 49: Markt für Neurostimulationsgeräte im asiatisch-pazifischen Raum: Potenzialanalyse nach Gerätetyp
Abbildung 50: Markt für Neurostimulationsgeräte im asiatisch-pazifischen Raum: Potenzialanalyse nach Anwendung
Abbildung 51: Markt für Neurostimulationsgeräte im asiatisch-pazifischen Raum: Potenzialanalyse nach Endnutzer
Abbildung 52: Asien-Pazifik Marktanteile von Neurostimulationsgeräten (%), nach Land, 2024
Abbildung 53: Marktanteile von Neurostimulationsgeräten im asiatisch-pazifischen Raum (%), nach Land, 2033
Abbildung 54: Marktanteile von Neurostimulationsgeräten im asiatisch-pazifischen Raum (%), nach Gerätetyp, 2024
Abbildung 55: Marktanteile von Neurostimulationsgeräten im asiatisch-pazifischen Raum (%), nach Gerätetyp, 2033
Abbildung 56: Marktanteile von Neurostimulationsgeräten im asiatisch-pazifischen Raum (%), nach Anwendung, 2024
Abbildung 57: Marktanteile von Neurostimulationsgeräten im asiatisch-pazifischen Raum (%), nach Anwendung, 2033
Abbildung 58: Marktanteile von Neurostimulationsgeräten im asiatisch-pazifischen Raum (%), nach Endnutzer, 2024
Abbildung 59: Marktanteile von Neurostimulationsgeräten im asiatisch-pazifischen Raum (%), nach Endnutzer, 2033
Abbildung 60: Markt für Neurostimulationsgeräte im Nahen Osten und Afrika: Segment mit dem höchsten Marktanteil (%)
Abbildung 61: Markt für Neurostimulationsgeräte im Nahen Osten und Afrika: Zusätzliches Marktpotenzial in US$ Abbildung
62: Markt für Neurostimulationsgeräte im Nahen Osten und Afrika: Wirkungsanalyse
Abbildung 63: Markt für Neurostimulationsgeräte im Nahen Osten und Afrika: Chancenanalyse nach Gerätetyp
Abbildung 64: Markt für Neurostimulationsgeräte im Nahen Osten und Afrika: Chancenanalyse nach Anwendung
Abbildung 65: Markt für Neurostimulationsgeräte im Nahen Osten und Afrika: Chancenanalyse nach Endnutzer
Abbildung 66: Marktanteil (%) für Neurostimulationsgeräte im Nahen Osten und Afrika nach Land, 2024
Abbildung 67: Marktanteil (%) für Neurostimulationsgeräte im Nahen Osten und Afrika nach Land, 2033
Abbildung 68: Marktanteil (%) für Neurostimulationsgeräte im Nahen Osten und Afrika nach Gerätetyp, 2024
Abbildung 69: Marktanteil (%) für Neurostimulationsgeräte im Nahen Osten und Afrika nach Gerätetyp, 2033
Abbildung 70: Marktanteil (%) für Neurostimulationsgeräte im Nahen Osten und Afrika nach Anwendung, 2024
Abbildung 71: Markt für Neurostimulationsgeräte im Nahen Osten und Afrika Marktanteil (%), nach Anwendung, 2033
Abbildung 72: Marktanteil (%) des Marktes für Neurostimulationsgeräte im Nahen Osten und Afrika, nach Endnutzer, 2024
Abbildung 73: Marktanteil (%) des Marktes für Neurostimulationsgeräte im Nahen Osten und Afrika, nach Endnutzer, 2033
Abbildung 74: Markt für Neurostimulationsgeräte in Südamerika: Segment mit dem höchsten Anteil (%)
Abbildung 75: Markt für Neurostimulationsgeräte in Südamerika: Nettopotenzialzuwachs in Mio. US$
Abbildung 76: Markt für Neurostimulationsgeräte in Südamerika: Wirkungsanalyse
Abbildung 77: Markt für Neurostimulationsgeräte in Südamerika: Potenzialanalyse, nach Gerätetyp
Abbildung 78: Markt für Neurostimulationsgeräte in Südamerika: Potenzialanalyse, nach Anwendung
Abbildung 79: Markt für Neurostimulationsgeräte in Südamerika: Potenzialanalyse, nach Endnutzer
Abbildung 80: Marktanteil (%) des Marktes für Neurostimulationsgeräte in Südamerika, nach Land, 2024
Abbildung 81: Marktanteil (%) des Marktes für Neurostimulationsgeräte in Südamerika, nach Land,
2033 82: Marktanteile von Neurostimulationsgeräten in Südamerika (%), nach Gerätetyp, 2024
Abbildung 83: Marktanteile von Neurostimulationsgeräten in Südamerika (%), nach Gerätetyp, 2033
Abbildung 84: Marktanteile von Neurostimulationsgeräten in Südamerika (%), nach Anwendung, 2024
Abbildung 85: Marktanteile von Neurostimulationsgeräten in Südamerika (%), nach Anwendung, 2033
Abbildung 86: Marktanteile von Neurostimulationsgeräten in Südamerika (%), nach Endnutzer, 2024
Abbildung 87: Marktanteile von Neurostimulationsgeräten in Südamerika (%), nach Endnutzer, 2033
Abbildung 88: Abbott Laboratories: Umsatzsegmentierung nach Geschäftsbereich, 2024
Abbildung 89: Abbott Laboratories: Umsatzsegmentierung nach Region, 2024
Abbildung 90:B. Braun Melsungen AG: Geografische Umsatzsegmentierung, 2024
Abbildung 91: Boston Scientific Corporation: Umsatzsegmentierung nach Geschäftsbereichen, 2024
Abbildung 92: Boston Scientific Corporation: Geografische Umsatzsegmentierung, 2024
Abbildung 93: BrainsWay: Geografische Umsatzsegmentierung, 2024
Abbildung 94: Cochlear: Umsatzsegmentierung nach Geschäftsbereichen, 2024
Abbildung 95: Cochlear: Geografische Umsatzsegmentierung, 2024
Abbildung 96: CONMED Corporation: Umsatzsegmentierung nach Geschäftsbereichen, 2024
Abbildung 97: CONMED Corporation: Geografische Umsatzsegmentierung, 2024
Abbildung 98: Koninklijke Philips: Umsatzsegmentierung nach Geschäftsbereichen, 2024
Abbildung 99: Koninklijke Philips: Geografische Umsatzsegmentierung, 2024
Abbildung 100: Medtronic PLC: Umsatzsegmentierung nach Geschäftsbereichen, 2024
Abbildung 101: Medtronic PLC: Geografische Umsatzsegmentierung Segmentierung, 2024
Abbildung 102: Zimmer Biomet Holdings, Inc.: Umsatzsegmentierung nach Geschäftsbereichen, 2024
Abbildung 103: Zimmer Biomet Holdings, Inc.: Geografische Umsatzsegmentierung, 2024


Merkmale | Lizenzart | ||||
Datenbuch | Einzelbenutzer |   Mehrere Benutzer | Unternehmen | ||
| E-Zugang | ✓ | ✓ | ✓ | ✓ | |
Benutzerfreigabe | Nur für 1 Benutzer | Nur für 1 Benutzer | Bis zu 7 Benutzer | Unbegrenzter Benutzerzugriff | |
⨉ | ⨉ | ⨉ | ✓ | ||
Kostenlose Anpassung | Keine kostenlose Anpassung | Bis zu 30 Stunden Arbeit | Bis zu 60 Stunden Arbeit | Bis zu 80 Arbeitsstunden | |
Lieferformat |
| ⨉ | ✓ | ✓ | ✓ |
| ✓ | ⨉ | ✓ | ✓ | |
| ⨉ | ⨉ | ⨉ | ✓ | |
Analystenunterstützung | 2 Monate Analystenunterstützung | 4 Monate Analystenunterstützung | 7 Monate Analystenunterstützung | Ein Jahr Analystenbetreuung | |
Kostenloses Bericht-Update im nächsten Aktualisierungszyklus | ⨉ | ⨉ | ⨉ | ✓ | |
Kostenloses Branchen-Update (Innerhalb von 180 Tagen) | ⨉ | ⨉ | ⨉ | ✓ | |
Nutzen | Bis zu 10 % Rabatt nach dem Kauf | Bis zu 20 % Rabatt nach dem Kauf | Bis zu 30 % Rabatt nach dem Kauf | Bis zu 40 % Rabatt nach dem Kauf | |