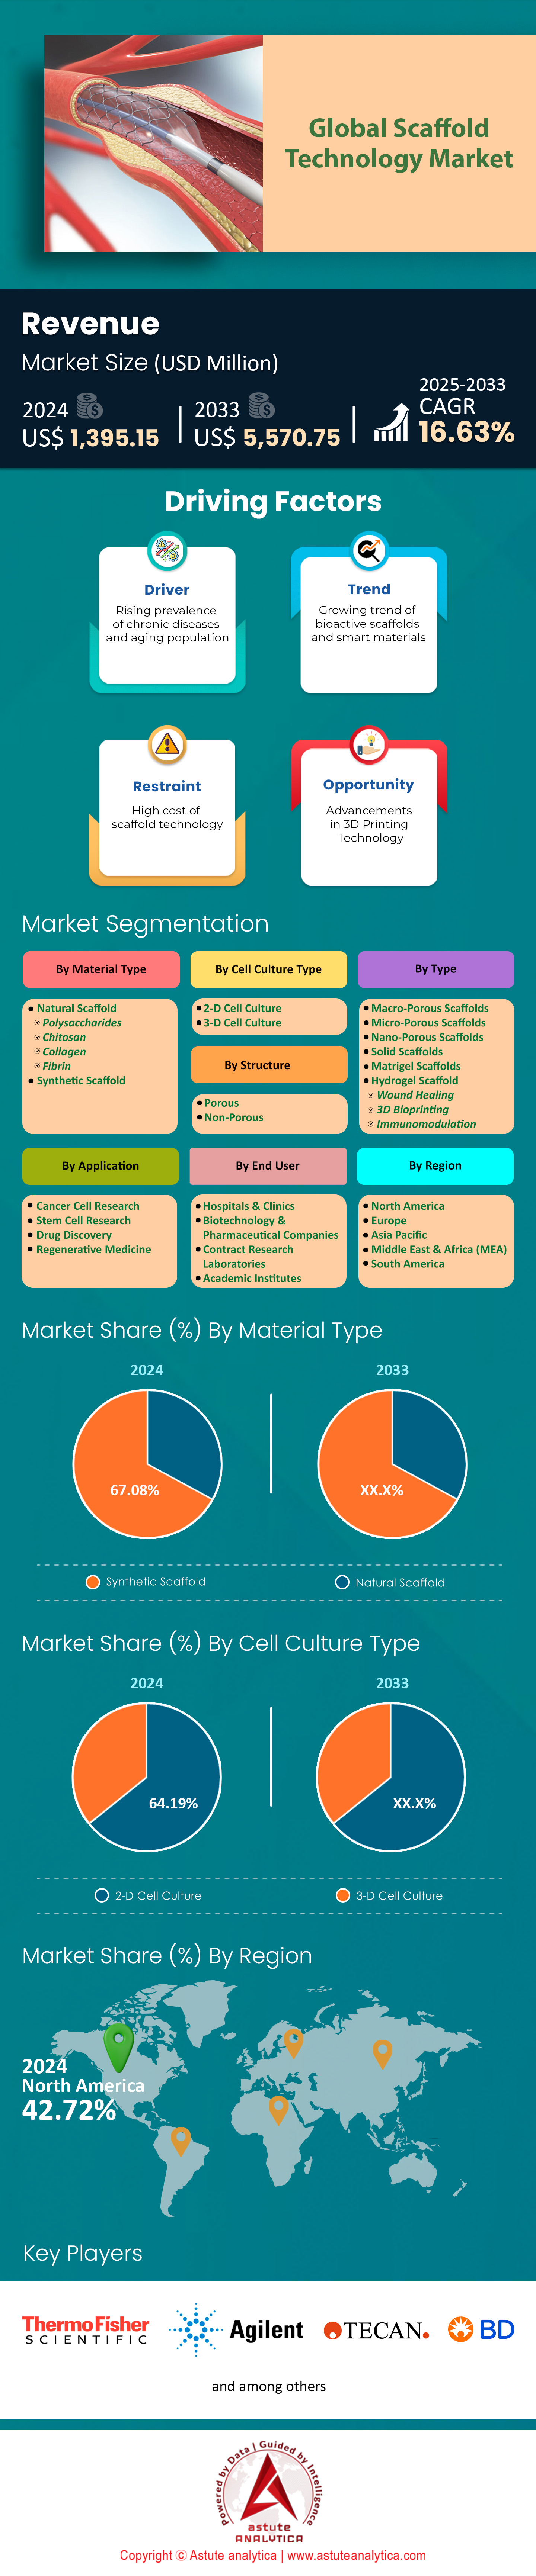
Markt für Gerüsttechnologie: Nach Typ (makroporöse, mikroporöse, nanoporöse, massive, Matrigel- und Hydrogelgerüste (Wundheilung, 3D-Biodruck, Immunmodulation)); Zellkulturtyp (2D- und 3D-Zellkultur); Materialtyp (synthetische und natürliche Gerüste (Polysaccharide, Chitosan, Kollagen, Fibrin)); Struktur (porös und nicht-porös); Anwendung (Krebsforschung, Stammzellforschung, Wirkstoffforschung, regenerative Medizin); Endnutzer (Krankenhäuser und Kliniken, Biotechnologie- und Pharmaunternehmen, Auftragsforschungslabore, akademische Einrichtungen); Region – Marktgröße, Branchendynamik, Chancenanalyse und Prognose für 2025–2033
- Letzte Aktualisierung: 18. März 2025 | | Bericht-ID: AA0124733
Tabelle 1: Marktdynamik und -trends: Wirkungsanalyse der Marktdynamik
Tabelle 2: Wettbewerbsübersicht: Wettbewerber-Mapping und Benchmarking
Tabelle 3: Weltweiter Markt für Gerüsttechnologie (Mio. US$), nach Typ, 2020–2033
Tabelle 4: Weltweiter Markt für Gerüsttechnologie (Mio. US$), nach Materialart, 2020–2033
Tabelle 5: Weltweiter Markt für Gerüsttechnologie (Mio. US$), nach Struktur, 2020–2033
Tabelle 6: Weltweiter Markt für Gerüsttechnologie (Mio. US$), nach Anwendung, 2020–2033
Tabelle 7: Weltweiter Markt für Gerüsttechnologie (Mio. US$), nach Branchen, 2020–2033
Tabelle 8: Weltweiter Markt für Gerüsttechnologie (Mio. US$), nach Endnutzer, 2020–2033
Tabelle 9: Weltweiter Markt für Gerüsttechnologie (Mio. US$), nach Region, 2020–2033
Tabelle 10: Gerüsttechnologie in Nordamerika Marktgröße (Mio. US$), nach Land, 2020–2033
Tabelle 11: Marktgröße für Gerüsttechnologie in Nordamerika (Mio. US$), nach Typ, 2020–2033
Tabelle 12: Marktgröße für Gerüsttechnologie in Nordamerika (Mio. US$), nach Materialart, 2020–2033
Tabelle 13: Marktgröße für Gerüsttechnologie in Nordamerika (Mio. US$), nach Struktur, 2020–2033
Tabelle 14: Marktgröße für Gerüsttechnologie in Nordamerika (Mio. US$), nach Anwendung, 2020–2033
Tabelle 15: Marktgröße für Gerüsttechnologie in Nordamerika (Mio. US$), nach Branchen, 2020–2033
Tabelle 16: Marktgröße für Gerüsttechnologie in Nordamerika (Mio. US$), nach Endnutzer, 2020–2033
Tabelle 17: Marktgröße für Gerüsttechnologie in den USA (Mio. US$), nach Typ, 2020–2033
Tabelle 18: USA Marktgröße für Gerüsttechnologie (Mio. US$), nach Materialart, 2020–2033
Tabelle 19 USA Marktgröße für Gerüsttechnologie (Mio. US$), nach Struktur, 2020–2033
Tabelle 20 Marktgröße für Gerüsttechnologie (Mio. US$), nach Anwendung, 2020–2033
Tabelle 21 Marktgröße für Gerüsttechnologie (Mio. US$), nach Branchen, 2020–2033
Tabelle 22 Marktgröße für Gerüsttechnologie (Mio. US$), nach Endnutzer, 2020–2033
Tabelle 23 Marktgröße für Gerüsttechnologie (Mio. US$), nach Typ, 2020–2033
Tabelle 24 Marktgröße für Gerüsttechnologie (Mio. US$), nach Materialart, 2020–2033
Tabelle 25 Marktgröße für Gerüsttechnologie (Mio. US$), nach Struktur, 2020–2033
Tabelle 26 Kanada Marktgröße für Gerüsttechnologie (Mio. US$), nach Anwendung, 2020–2033
Tabelle 27 Marktgröße für Gerüsttechnologie in Kanada (Mio. US$), nach Branchen, 2020–2033
Tabelle 28 Marktgröße für Gerüsttechnologie in Kanada (Mio. US$), nach Endnutzer, 2020–2033
Tabelle 29 Marktgröße für Gerüsttechnologie in Mexiko (Mio. US$), nach Typ, 2020–2033
Tabelle 30 Marktgröße für Gerüsttechnologie in Mexiko (Mio. US$), nach Materialart, 2020–2033
Tabelle 31 Marktgröße für Gerüsttechnologie in Mexiko (Mio. US$), nach Struktur, 2020–2033
Tabelle 32 Marktgröße für Gerüsttechnologie in Mexiko (Mio. US$), nach Anwendung, 2020–2033
Tabelle 33 Marktgröße für Gerüsttechnologie in Mexiko (Mio. US$), nach Branchen, 2020–2033
Tabelle 34 Mexiko Marktgröße für Gerüsttechnologie (Mio. US$), nach Endnutzer, 2020–2033
Tabelle 35 Marktgröße für Gerüsttechnologie in Europa (Mio. US$), nach Land, 2020–2033
Tabelle 36 Marktgröße für Gerüsttechnologie in Europa (Mio. US$), nach Typ, 2020–2033
Tabelle 37 Marktgröße für Gerüsttechnologie in Europa (Mio. US$), nach Materialart, 2020–2033
Tabelle 38 Marktgröße für Gerüsttechnologie in Europa (Mio. US$), nach Struktur, 2020–2033
Tabelle 39 Marktgröße für Gerüsttechnologie in Europa (Mio. US$), nach Anwendung, 2020–2033
Tabelle 40 Marktgröße für Gerüsttechnologie in Europa (Mio. US$), nach Branchen, 2020–2033
Tabelle 41 Marktgröße für Gerüsttechnologie in Europa (Mio. US$), nach Endnutzer, 2020–2033
Tabelle 42 Vereinigtes Königreich Marktgröße für Gerüsttechnik (Mio. US$), nach Typ, 2020–2033
Tabelle 43 Marktgröße für Gerüsttechnik im Vereinigten Königreich (Mio. US$), nach Materialart, 2020–2033
Tabelle 44 Marktgröße für Gerüsttechnik im Vereinigten Königreich (Mio. US$), nach Struktur, 2020–2033
Tabelle 45 Marktgröße für Gerüsttechnik im Vereinigten Königreich (Mio. US$), nach Anwendung, 2020–2033
Tabelle 46 Marktgröße für Gerüsttechnik im Vereinigten Königreich (Mio. US$), nach Branchen, 2020–2033
Tabelle 47 Marktgröße für Gerüsttechnik im Vereinigten Königreich (Mio. US$), nach Endnutzer, 2020–2033
Tabelle 48 Marktgröße für Gerüsttechnik in Deutschland (Mio. US$), nach Typ, 2020–2033
Tabelle 49 Marktgröße für Gerüsttechnik in Deutschland (Mio. US$), nach Materialart, 2020–2033
Tabelle 50 Deutschland Marktgröße für Gerüsttechnik (Mio. US$), nach Struktur, 2020–2033
Tabelle 51 Deutschland Marktgröße für Gerüsttechnik (Mio. US$), nach Anwendung, 2020–2033
Tabelle 52 Deutschland Marktgröße für Gerüsttechnik (Mio. US$), nach Branchen, 2020–2033
Tabelle 53 Deutschland Marktgröße für Gerüsttechnik (Mio. US$), nach Endnutzer, 2020–2033
Tabelle 54 Frankreich Marktgröße für Gerüsttechnik (Mio. US$), nach Typ, 2020–2033
Tabelle 55 Frankreich Marktgröße für Gerüsttechnik (Mio. US$), nach Materialart, 2020–2033
Tabelle 56 Frankreich Marktgröße für Gerüsttechnik (Mio. US$), nach Struktur, 2020–2033
Tabelle 57 Frankreich Marktgröße für Gerüsttechnik (Mio. US$), nach Anwendung, 2020–2033
Tabelle 58 Frankreich Marktgröße für Gerüsttechnologie (Mio. US$), nach Branchen, 2020–2033
Tabelle 59 Frankreich Marktgröße für Gerüsttechnologie (Mio. US$), nach Endnutzer, 2020–2033
Tabelle 60 Italien Marktgröße für Gerüsttechnologie (Mio. US$), nach Typ, 2020–2033
Tabelle 61 Italien Marktgröße für Gerüsttechnologie (Mio. US$), nach Materialart, 2020–2033
Tabelle 62 Italien Marktgröße für Gerüsttechnologie (Mio. US$), nach Struktur, 2020–2033
Tabelle 63 Italien Marktgröße für Gerüsttechnologie (Mio. US$), nach Anwendung, 2020–2033
Tabelle 64 Italien Marktgröße für Gerüsttechnologie (Mio. US$), nach Branchen, 2020–2033
Tabelle 65 Italien Marktgröße für Gerüsttechnologie (Mio. US$), nach Endnutzer, 2020–2033
Tabelle 66 Marktgröße für Gerüsttechnologie in Spanien (Mio. US$), nach Typ, 2020–2033
Tabelle 67 Marktgröße für Gerüsttechnologie in Spanien (Mio. US$), nach Materialart, 2020–2033
Tabelle 68 Marktgröße für Gerüsttechnologie in Spanien (Mio. US$), nach Struktur, 2020–2033
Tabelle 69 Marktgröße für Gerüsttechnologie in Spanien (Mio. US$), nach Anwendung, 2020–2033
Tabelle 70 Marktgröße für Gerüsttechnologie in Spanien (Mio. US$), nach Branchen, 2020–2033
Tabelle 71 Marktgröße für Gerüsttechnologie in Spanien (Mio. US$), nach Endnutzer, 2020–2033
Tabelle 72 Marktgröße für Gerüsttechnologie im übrigen Westeuropa (Mio. US$), nach Typ, 2020–2033
Tabelle 73 Marktgröße für Gerüsttechnologie im übrigen Westeuropa (Mio. US$), nach Materialart2020–2033
Tabelle 74: Marktgröße für Gerüsttechnologie im übrigen Westeuropa (Mio. US$), nach Struktur,
; Tabelle 75: Marktgröße für Gerüsttechnologie im übrigen Westeuropa (Mio. US$), nach Anwendung, 2020–2033;
Tabelle 76: Marktgröße für Gerüsttechnologie im übrigen Westeuropa (Mio. US$), nach Branchen, 2020–2033
; Tabelle 77: Marktgröße für Gerüsttechnologie im übrigen Westeuropa (Mio. US$), nach Endnutzer, 2020–2033;
Tabelle 78: Marktgröße für Gerüsttechnologie in Polen (Mio. US$), nach Typ, 2020–2033;
Tabelle 79: Marktgröße für Gerüsttechnologie in Polen (Mio. US$), nach Materialart, 2020–2033
; Tabelle 80: Marktgröße für Gerüsttechnologie in Polen (Mio. US$), nach Struktur, 2020–2033;
Tabelle 81: Markt für Gerüsttechnologie in Polen Marktgröße (Mio. US$), nach Anwendung, 2020–2033
Tabelle 82 Marktgröße für Gerüsttechnologie in Polen (Mio. US$), nach Branchen, 2020–2033
Tabelle 83 Marktgröße für Gerüsttechnologie in Polen (Mio. US$), nach Endnutzer, 2020–2033
Tabelle 84 Marktgröße für Gerüsttechnologie in Russland (Mio. US$), nach Typ, 2020–2033
Tabelle 85 Marktgröße für Gerüsttechnologie in Russland (Mio. US$), nach Materialart, 2020–2033
Tabelle 86 Marktgröße für Gerüsttechnologie in Russland (Mio. US$), nach Struktur, 2020–2033
Tabelle 87 Marktgröße für Gerüsttechnologie in Russland (Mio. US$), nach Anwendung, 2020–2033
Tabelle 88 Marktgröße für Gerüsttechnologie in Russland (Mio. US$), nach Branchen, 2020–2033
Tabelle 89 Marktgröße für Gerüsttechnologie in Russland Marktgröße (Mio. US$), nach Endnutzer, 2020–2033
Tabelle 90: Marktgröße für Gerüsttechnologie im übrigen Osteuropa (Mio. US$), nach Typ, 2020–2033
Tabelle 91: Marktgröße für Gerüsttechnologie im übrigen Osteuropa (Mio. US$), nach Materialart, 2020–2033
Tabelle 92: Marktgröße für Gerüsttechnologie im übrigen Osteuropa (Mio. US$), nach Struktur, 2020–2033
Tabelle 93: Marktgröße für Gerüsttechnologie im übrigen Osteuropa (Mio. US$), nach Anwendung, 2020–2033
Tabelle 94: Marktgröße für Gerüsttechnologie im übrigen Osteuropa (Mio. US$), nach Branchen, 2020–2033
Tabelle 95: Marktgröße für Gerüsttechnologie im übrigen Osteuropa (Mio. US$), nach Endnutzer, 2020–2033
Tabelle 96: Marktgröße für Gerüsttechnologie im asiatisch-pazifischen Raum (Mio. US$), nach Land97
: Marktgröße für Gerüsttechnologie im asiatisch-pazifischen Raum (Mio. US$), nach Typ;
Tabelle 98: Marktgröße für Gerüsttechnologie im asiatisch-pazifischen Raum (Mio. US$), nach Materialart;
Tabelle 99: Marktgröße für Gerüsttechnologie im asiatisch-pazifischen Raum (Mio. US$), nach Struktur;
Tabelle 100: Marktgröße für Gerüsttechnologie im asiatisch-pazifischen Raum (Mio. US$), nach Anwendung;
Tabelle 101: Marktgröße für Gerüsttechnologie im asiatisch-pazifischen Raum (Mio. US$), nach Branchen;
Tabelle 102: Marktgröße für Gerüsttechnologie im asiatisch-pazifischen Raum (Mio. US$), nach Endnutzer;
Tabelle 103: Marktgröße für Gerüsttechnologie in China (Mio. US$), nach Typ;
Tabelle 104: Marktgröße für Gerüsttechnologie in China(Mio. US$), nach Materialart, 2020–2033
Marktgröße für Gerüsttechnologie in China
Tabelle 106 Marktgröße für Gerüsttechnologie in China (Mio. US$), nach Anwendung, 2020–2033
Tabelle 107 Marktgröße für Gerüsttechnologie in China (Mio. US$), nach Branchen, 2020–2033
Tabelle 108 Marktgröße für Gerüsttechnologie in China (Mio. US$), nach Endnutzer, 2020–2033
Tabelle 109 Marktgröße für Gerüsttechnologie in Indien (Mio. US$), nach Typ, 2020–2033
Tabelle 110 Marktgröße für Gerüsttechnologie in Indien (Mio. US$), nach Materialart, 2020–2033
Tabelle 111 Marktgröße für Gerüsttechnologie in Indien (Mio. US$), nach Struktur, 2020–2033
Tabelle 112 Marktgröße für Gerüsttechnologie in Indien (Mio. US$), nach Anwendung, 2020–2033
Tabelle 113 Marktgröße für Gerüsttechnologie in Indien (Mio. US$), nach Branchen, 2020–2033
Tabelle 114 Marktgröße für Gerüsttechnologie in Indien (Mio. US$), nach Endnutzer, 2020–2033
Tabelle 115 Marktgröße für Gerüsttechnologie in Japan (Mio. US$), nach Typ, 2020–2033
Tabelle 116 Marktgröße für Gerüsttechnologie in Japan (Mio. US$), nach Materialart, 2020–2033
Tabelle 117 Marktgröße für Gerüsttechnologie in Japan (Mio. US$), nach Struktur, 2020–2033
Tabelle 118 Marktgröße für Gerüsttechnologie in Japan (Mio. US$), nach Anwendung, 2020–2033
Tabelle 119 Marktgröße für Gerüsttechnologie in Japan (Mio. US$), nach Branchen120
: Marktgröße für Gerüsttechnologie in Japan (Mio. US$), nach Endnutzer, 2020–2033;
Tabelle 121: Marktgröße für Gerüsttechnologie in Südkorea (Mio. US$), nach Typ, 2020–2033
; Tabelle 122: Marktgröße für Gerüsttechnologie in Südkorea (Mio. US$), nach Materialart, 2020–2033;
Tabelle 123: Marktgröße für Gerüsttechnologie in Südkorea (Mio. US$), nach Struktur, 2020–2033;
Tabelle 124: Marktgröße für Gerüsttechnologie in Südkorea (Mio. US$), nach Anwendung, 2020–2033;
Tabelle 125: Marktgröße für Gerüsttechnologie in Südkorea (Mio. US$), nach Branchen, 2020–2033;
Tabelle 126: Marktgröße für Gerüsttechnologie in Südkorea (Mio. US$), nach Endnutzer, 2020–2033;
Tabelle 127: Australien & Neuseeland Marktgröße für Gerüsttechnologie in Neuseeland (Mio. US$), nach Typ, 2020–2033
Tabelle: 128 Marktgröße für Gerüsttechnologie in Australien und Neuseeland (Mio. US$), nach Materialart, 2020–2033
Tabelle: 129 Marktgröße für Gerüsttechnologie in Australien und Neuseeland (Mio. US$), nach Struktur, 2020–2033
Tabelle: 130 Marktgröße für Gerüsttechnologie in Australien und Neuseeland (Mio. US$), nach Anwendung, 2020–2033
Tabelle: 131 Marktgröße für Gerüsttechnologie in Australien und Neuseeland (Mio. US$), nach Branchen, 2020–2033
Tabelle: 132 Marktgröße für Gerüsttechnologie in Australien und Neuseeland (Mio. US$), nach Endnutzer, 2020–2033
Tabelle: 133 Marktgröße für Gerüsttechnologie in ASEAN (Mio. US$), nach Typ, 2020–2033
Tabelle: 134 Marktgröße für Gerüsttechnologie in ASEAN (Mio. US$), nach Materialart, 2020–2033
Tabelle 135: ASEAN-Marktgröße für Gerüsttechnologie (Mio. US$), nach Struktur, 2020–2033
Tabelle 136: ASEAN-Marktgröße für Gerüsttechnologie (Mio. US$), nach Anwendung, 2020–2033
Tabelle 137: ASEAN-Marktgröße für Gerüsttechnologie (Mio. US$), nach Branchen, 2020–2033
Tabelle 138: ASEAN-Marktgröße für Gerüsttechnologie (Mio. US$), nach Endnutzer, 2020–2033
Tabelle 139: Marktgröße für Gerüsttechnologie im übrigen Asien-Pazifik-Raum (Mio. US$), nach Typ, 2020–2033
Tabelle 140: Marktgröße für Gerüsttechnologie im übrigen Asien-Pazifik-Raum (Mio. US$), nach Materialart, 2020–2033
Tabelle 141: Marktgröße für Gerüsttechnologie im übrigen Asien-Pazifik-Raum (Mio. US$), nach StrukturTabelle
Tabelle 142: Marktgröße für Gerüsttechnologie im übrigen Asien-Pazifik-Raum (Mio. US$), nach Anwendung, 2020–2033;
143: Marktgröße für Gerüsttechnologie im übrigen Asien-Pazifik-Raum (Mio. US$), nach Branchen, 2020–2033;
Tabelle 144: Marktgröße für Gerüsttechnologie im übrigen Asien-Pazifik-Raum (Mio. US$), nach Endnutzer, 2020–2033;
Tabelle 145: Marktgröße für Gerüsttechnologie im Rest der Welt (Mio. US$), nach Land, 2020–2033
; Tabelle 146: Marktgröße für Gerüsttechnologie im
Rest der Welt (Mio. US$), nach Typ, 2020–2033; Tabelle 147: Marktgröße für Gerüsttechnologie im Rest der Welt (Mio. US$), nach Materialart, 2020–2033
; Tabelle 148: Marktgröße für Gerüsttechnologie im Rest der Welt (Mio. US$), nach StrukturTabelle
Tabelle 149: Marktgröße für Gerüsttechnologie im Rest der Welt (Mio. US$), nach Anwendung, 2020–2033;
150: Marktgröße für Gerüsttechnologie im Rest der Welt (Mio. US$), nach Branchen, 2020–2033;
Tabelle 151: Marktgröße für Gerüsttechnologie im Rest der Welt (Mio. US$), nach Endnutzer, 2020–2033;
Tabelle 152: 3D Biotek LLC: Aktuelle Entwicklungen
; Tabelle 153: 3D Biotek LLC: Produkt
; Tabelle 154: Agilent Technologies Inc.: Aktuelle Entwicklungen;
Tabelle 155: Agilent Technologies Inc.: Produkt
; Tabelle 156: Agilent Technologies Inc.: Finanzanalyse;
Tabelle 157: Becton, Dickinson and Company: Aktuelle Entwicklungen
; Tabelle 158: Becton, Dickinson and Company: Produkt;
Tabelle 159: Becton, Dickinson and Company: Finanzanalyse;
Tabelle 160: BICO Group: Aktuelle Entwicklungen
Tabelle 161: BICO Group: Produkt
Tabelle 162: BICO Group: Finanzanalyse
Tabelle 163: BioVision Incorporated: Aktuelle Entwicklungen
Tabelle 164: BioVision Incorporated: Produkt
Tabelle 165: Corning Incorporated: Produkte
Tabelle 166: Corning Incorporated: Finanzanalyse
Tabelle 167: Merck KGaA: Aktuelle Entwicklungen
Tabelle 168: Merck KGaA: Produkte
Tabelle 169: Merck KGaA: Finanzanalyse
Tabelle 170: Promo Cell GmbH: Aktuelle Entwicklungen
Tabelle 171: Promo Cell GmbH: Produkt
Tabelle 172: Reprocell Incorporated: Produkte
Tabelle 173: Synthecon Incorporated: Produkt
Tabelle 174: Tecan Trading AG: Aktuelle Entwicklungen
Tabelle 175: Tecan Trading AG: Produkt
Tabelle 176: Tecan Trading AG: Finanzanalyse
Tabelle 177: Thermo Fisher Scientific, Inc.: Aktuelle Entwicklungen
Tabelle 178: Thermo Fisher Scientific, Inc.: Produkt
Tabelle 179: Thermo Fisher Scientific, Inc.: Finanzanalyse
Tabelle 180: Sonstige Prominente Spieler
Abbildung 1: Zusammenfassung: Weltweiter Markt für Gerüsttechnologie – Größe und Prognose, 2020–2033 (Mio. US$)
Abbildung 2: Treiber: Trends bei der alternden Bevölkerung Japans (in Mio.), 2000–2020
Abbildung 3: Treiber: Geschätzte Anzahl neuer Krebsfälle, beide Geschlechter, alle Altersgruppen, 2020
Abbildung 4: Treiber: Geschätzte altersstandardisierte Inzidenzraten verschiedener Krebsarten im Jahr 2020, weltweit, beide Geschlechter, alle Altersgruppen
Abbildung 5: Treiber: Erkrankungen des Bewegungsapparates, weltweit, altersstandardisiert, beide Geschlechter, Prävalenzfälle pro 100.000;6
: Auswirkungen von Covid-19 und Erholung: Globaler Markt für Gerüsttechnologie, Auswirkungen von Covid-19 und Erholung, jährliche Veränderung (%), 2019–2033.
Abbildung 7: Wettbewerbsübersicht: Marktanteilsanalyse nach Unternehmen, basierend auf dem Umsatz (2024).
Abbildung 8: Globaler Markt für Gerüsttechnologie nach Typ, CAGR (%), 2024–2033.
9: Globaler Marktanteil für Gerüsttechnologie (%), nach Typ, 2024.
Abbildung 10: Globaler Marktanteil für Gerüsttechnologie (%), nach Typ, 2033.
Abbildung 11: Globaler Markt für Gerüsttechnologie nach Materialart, CAGR (%), 2024–2033.
12: Globaler Marktanteil für Gerüsttechnologie (%), nach Materialart, 2024.
Abbildung 13: Globaler Marktanteil für Gerüsttechnologie (%), nach Materialart, 2033.
Abbildung 14: Globaler Markt für Gerüsttechnologie nach Struktur, CAGR (%).;
Abbildung 15: Weltweiter Marktanteil der Gerüsttechnologie (%), nach Struktur, 2024;
Abbildung 16: Weltweiter Marktanteil der Gerüsttechnologie (%), nach Struktur, 2033;
Abbildung 17: Weltweiter Markt für Gerüsttechnologie, nach Anwendung, CAGR (%), 2024–2033
Abbildung 18: Weltweiter Marktanteil der Gerüsttechnologie (%), nach Anwendung, 2024;
Abbildung 19: Weltweiter Marktanteil der Gerüsttechnologie (%), nach Anwendung, 2033;
Abbildung 20: Weltweiter Markt für Gerüsttechnologie, nach Branchen, CAGR (%), 2024–2033;
Abbildung 21: Weltweiter Marktanteil der Gerüsttechnologie (%), nach Branchen, 2024;
Abbildung 22: Weltweiter Marktanteil der Gerüsttechnologie (%), nach Branchen, 2033;
Abbildung 23: Weltweiter Markt für Gerüsttechnologie, nach Endnutzer, CAGR (%), 2024–2033
Abbildung 24: Weltweiter Marktanteil der Gerüsttechnologie (%), nach Endnutzer, 2024;
Abbildung 25: Weltweiter Marktanteil der Gerüsttechnologie (%), nach Endnutzer, 2033;
Abbildung 26: Weltweiter Markt für Gerüsttechnologie, nach Region, CAGR (%), 2024–2033;
Abbildung 27: Weltweiter Marktanteil der Gerüsttechnologie (%), nach Region, 2024;
Abbildung 28: Weltweiter Marktanteil der Gerüsttechnologie (%), nach Region, 2033
; Abbildung 29: Nordamerika: Segment mit dem höchsten Anteil (%)
; Abbildung 30: Nordamerika: Nettopotenzialzuwachs in Mio. US$
; Abbildung 31: Nordamerika: Wirkungsanalyse – Diagramm
; Abbildung 32: Nordamerika: Potenzialanalyse, nach Typ
; Abbildung 33: Nordamerika: Potenzialanalyse, nach Materialart
; Abbildung 34: Nordamerika: Potenzialanalyse, nach Struktur
; Abbildung 35: Nordamerika: Potenzialanalyse, nach Anwendung
; Abbildung 36: Nordamerika Chancenanalyse nach Branchen
(Abbildung 37): Nordamerika: Chancenanalyse nach Endnutzer
(Abbildung 38): Marktanteil der Gerüsttechnologie in Nordamerika (%) nach Land, 2024
(Abbildung 39): Marktanteil der Gerüsttechnologie in Nordamerika (%) nach Land, 2033 (
Abbildung 40): Marktanteil der Gerüsttechnologie in Nordamerika (%) nach Typ, 2024
(Abbildung 41): Marktanteil der Gerüsttechnologie in Nordamerika (%) nach Typ, 2033
(Abbildung 42): Marktanteil der Gerüsttechnologie in Nordamerika (%) nach Materialart, 2024
(Abbildung 43): Marktanteil der Gerüsttechnologie in Nordamerika (%) nach Materialart, 2033 (
Abbildung 44): Marktanteil der Gerüsttechnologie in Nordamerika (%) nach Struktur, 2024
(Abbildung 45): Marktanteil der Gerüsttechnologie in Nordamerika (%) nach Struktur, 2033
(Abbildung 46): Marktanteil der Gerüsttechnologie in Nordamerika (%) nach Anwendung, 2024
Abbildung 47: Marktanteil der Gerüsttechnologie in Nordamerika (%), nach Anwendung, 2033;
Abbildung 48: Marktanteil der Gerüsttechnologie in Nordamerika (%), nach Branchen, 2024;
Abbildung 49: Marktanteil der Gerüsttechnologie in Nordamerika (%), nach Branchen, 2033
; Abbildung 50: Marktanteil der Gerüsttechnologie in Nordamerika (%), nach Endnutzer, 2024;
Abbildung 51: Marktanteil der Gerüsttechnologie in Nordamerika (%), nach Endnutzer, 2033;
Abbildung 52: USA: Segment mit dem höchsten Anteil (%);
Abbildung 53: Marktanteil der Gerüsttechnologie in den USA (%), nach Typ, 2024;
Abbildung 54: Marktanteil der Gerüsttechnologie in den USA (%), nach Typ, 2033;
Abbildung 55: Marktanteil der Gerüsttechnologie in den USA (%), nach Materialart, 2024
; Abbildung 56: Marktanteil der Gerüsttechnologie in den USA (%), nach Materialart, 2033;
Abbildung 57: Marktanteil der Gerüsttechnologie in den USA (%), nach Struktur, 2024
Abbildung: 58 Marktanteil der Gerüsttechnologie in den USA (%), nach Struktur, 2033
Abbildung: 59 Marktanteil der Gerüsttechnologie in den USA (%), nach Anwendung, 2024
Abbildung: 60 Marktanteil der Gerüsttechnologie in den USA (%), nach Anwendung, 2033
Abbildung: 61 Marktanteil der Gerüsttechnologie in den USA (%), nach Branchen, 2024
Abbildung: 62 Marktanteil der Gerüsttechnologie in den USA (%), nach Branchen, 2033
Abbildung: 63 Marktanteil der Gerüsttechnologie in den USA (%), nach Endnutzer, 2024
Abbildung: 64 Marktanteil der Gerüsttechnologie in den USA (%), nach Endnutzer, 2033
Abbildung: 65 Kanada: Segment mit dem höchsten Anteil (%)
Abbildung: 66 Marktanteil der Gerüsttechnologie in Kanada (%), nach Typ, 2024
Abbildung: 67 Marktanteil der Gerüsttechnologie in Kanada (%), nach Typ, 2033
Abbildung: 68 Kanada Gerüst Technologie-Marktanteil (%), nach Materialart, 2024
Abbildung: 69 Kanada Gerüsttechnologie-Marktanteil (%), nach Materialart, 2033
Abbildung: 70 Kanada Gerüsttechnologie-Marktanteil (%), nach Struktur, 2024
Abbildung: 71 Kanada Gerüsttechnologie-Marktanteil (%), nach Struktur, 2033
Abbildung: 72 Kanada Gerüsttechnologie-Marktanteil (%), nach Anwendung, 2024
Abbildung: 73 Kanada Gerüsttechnologie-Marktanteil (%), nach Anwendung, 2033
Abbildung: 74 Kanada Gerüsttechnologie-Marktanteil (%), nach Branchen, 2024
Abbildung: 75 Kanada Gerüsttechnologie-Marktanteil (%), nach Branchen, 2033
Abbildung: 76 Kanada Gerüsttechnologie-Marktanteil (%), nach Endnutzer, 2024
Abbildung: 77 Kanada Gerüsttechnologie-Marktanteil (%), nach Endnutzer, 2033
Abbildung: 78 Mexiko: Segment mit dem höchsten Anteil (%
) 79 Marktanteil der Gerüsttechnologie in Mexiko (%), nach Typ, 2024
Abbildung: 80 Marktanteil der Gerüsttechnologie in Mexiko (%), nach Typ, 2033
Abbildung: 81 Marktanteil der Gerüsttechnologie in Mexiko (%), nach Materialart, 2024
Abbildung: 82 Marktanteil der Gerüsttechnologie in Mexiko (%), nach Materialart, 2033
Abbildung: 83 Marktanteil der Gerüsttechnologie in Mexiko (%), nach Struktur, 2024
Abbildung: 84 Marktanteil der Gerüsttechnologie in Mexiko (%), nach Struktur, 2033
Abbildung: 85 Marktanteil der Gerüsttechnologie in Mexiko (%), nach Anwendung, 2024
Abbildung: 86 Marktanteil der Gerüsttechnologie in Mexiko (%), nach Anwendung, 2033
Abbildung: 87 Marktanteil der Gerüsttechnologie in Mexiko (%), nach Branchen, 2024
Abbildung: 88 Marktanteil der Gerüsttechnologie in Mexiko (%), nach Branchen, 2033
Abbildung: 89 Marktanteil der Gerüsttechnologie in Mexiko (%), nach Endnutzer, 2024
Abbildung: 90 Marktanteil Mexiko Gerüsttechnologie (%), nach Endnutzer, 2033
Abbildung: 91 Europa: Segment mit dem höchsten Anteil (%)
Abbildung: 92 Europa: Netto-Potenzialzuwachs in Mio. US$
Abbildung: 93 Europa: Wirkungsanalyse – Diagramm
Abbildung: 94 Europa: Potenzialanalyse nach Typ
Abbildung: 95 Europa: Potenzialanalyse nach Materialart
Abbildung: 96 Europa: Potenzialanalyse nach Struktur
Abbildung: 97 Europa: Potenzialanalyse nach Anwendung
Abbildung: 98 Europa: Potenzialanalyse nach Branchensegmenten
Abbildung: 99 Europa: Potenzialanalyse nach Endnutzer
Abbildung: 100 Marktanteil Europa Gerüsttechnologie (%), nach Land, 2024
Abbildung: 101 Marktanteil Europa Gerüsttechnologie (%), nach Land, 2033
Abbildung: 102 Marktanteil Europa Gerüsttechnologie (%), nach Typ, 2024
Abbildung 103: Marktanteil der Gerüsttechnologie in Europa (%), nach Typ, 2033;
Abbildung 104: Marktanteil der Gerüsttechnologie in Europa (%), nach Materialart, 2024;
Abbildung 105: Marktanteil der Gerüsttechnologie in Europa (%), nach Materialart, 2033;
Abbildung 106: Marktanteil der Gerüsttechnologie in Europa (%), nach Struktur, 2024
; Abbildung 107: Marktanteil der Gerüsttechnologie in Europa (%), nach Struktur, 2033;
Abbildung 108: Marktanteil der Gerüsttechnologie in Europa (%), nach Anwendung, 2024;
Abbildung 109: Marktanteil der Gerüsttechnologie in Europa (%), nach Anwendung, 2033
; Abbildung 110: Marktanteil der Gerüsttechnologie in Europa (%), nach Branchen, 2024;
Abbildung 111: Marktanteil der Gerüsttechnologie in Europa (%), nach Branchen, 2033;
Abbildung 112: Marktanteil der Gerüsttechnologie in Europa (%), nach Endnutzer113
: Marktanteil der Gerüsttechnologie in Europa (%), nach Endnutzer, 2033;
Abbildung 114: Vereinigtes Königreich: Segment mit dem höchsten Anteil (%); Abbildung
115: Marktanteil der Gerüsttechnologie im Vereinigten Königreich (%), nach Typ, 2024;
Abbildung 116: Marktanteil der Gerüsttechnologie im Vereinigten Königreich (%), nach Typ, 2033;
Abbildung 117: Marktanteil der Gerüsttechnologie im Vereinigten Königreich (%), nach Materialart, 2024;
Abbildung 118: Marktanteil der Gerüsttechnologie im Vereinigten Königreich (%), nach Materialart, 2033;
Abbildung 119: Marktanteil der Gerüsttechnologie im Vereinigten Königreich (%), nach Struktur, 2024;
Abbildung 120: Marktanteil der Gerüsttechnologie im Vereinigten Königreich (%), nach Struktur, 2033;
Abbildung 121: Marktanteil der Gerüsttechnologie im Vereinigten Königreich (%), nach Anwendung, 2024;
Abbildung 122: Marktanteil der Gerüsttechnologie im Vereinigten Königreich (%), nach Anwendung, 2033;
Abbildung 123: Vereinigtes Königreich Marktanteile der Gerüsttechnologie (%), nach Branchen, 2024
Abbildung: 124 Marktanteile der Gerüsttechnologie im Vereinigten Königreich (%), nach Branchen, 2033
Abbildung: 125 Marktanteile der Gerüsttechnologie im Vereinigten Königreich (%), nach Endnutzer, 2024
Abbildung: 126 Marktanteile der Gerüsttechnologie im Vereinigten Königreich (%), nach Endnutzer, 2033
Abbildung: 127 Deutschland: Segment mit dem höchsten Anteil (%)
Abbildung: 128 Marktanteile der Gerüsttechnologie in Deutschland (%), nach Typ, 2024
Abbildung: 129 Marktanteile der Gerüsttechnologie in Deutschland (%), nach Typ, 2033
Abbildung: 130 Marktanteile der Gerüsttechnologie in Deutschland (%), nach Materialart, 2024
Abbildung: 131 Marktanteile der Gerüsttechnologie in Deutschland (%), nach Materialart, 2033
Abbildung: 132 Marktanteile der Gerüsttechnologie in Deutschland (%), nach Struktur, 2024
Abbildung: 133 Marktanteil der Gerüsttechnologie in Deutschland (%), nach Struktur, 2033
Abbildung: 134 Marktanteil der Gerüsttechnologie in Deutschland (%), nach Anwendung, 2024
Abbildung: 135 Marktanteil der Gerüsttechnologie in Deutschland (%), nach Anwendung, 2033
Abbildung: 136 Marktanteil der Gerüsttechnologie in Deutschland (%), nach Branchen, 2024
Abbildung: 137 Marktanteil der Gerüsttechnologie in Deutschland (%), nach Branchen, 2033
Abbildung: 138 Marktanteil der Gerüsttechnologie in Deutschland (%), nach Endnutzer, 2024
Abbildung: 139 Marktanteil der Gerüsttechnologie in Deutschland (%), nach Endnutzer, 2033
Abbildung: 140 Frankreich: Segment mit dem höchsten Anteil (%)
Abbildung: 141 Marktanteil der Gerüsttechnologie in Frankreich (%), nach Typ, 2024
Abbildung: 142 Marktanteil der Gerüsttechnologie in Frankreich (%), nach Typ, 2033
Abbildung: 143 Marktanteil der Gerüsttechnologie in Frankreich (%), nach Materialart144
: Marktanteil der Gerüsttechnologie in Frankreich (%), nach Materialart;
Abbildung 145: Marktanteil der Gerüsttechnologie in Frankreich (%), nach Struktur;
Abbildung 146: Marktanteil der Gerüsttechnologie in Frankreich (%), nach Struktur;
Abbildung 147: Marktanteil der Gerüsttechnologie in Frankreich (%), nach Anwendung;
Abbildung 148: Marktanteil der Gerüsttechnologie in Frankreich (%), nach Anwendung;
Abbildung 149: Marktanteil der Gerüsttechnologie in Frankreich (%), nach Branchen
; Abbildung 150: Marktanteil der Gerüsttechnologie in Frankreich (%), nach Branchen;
Abbildung 151: Marktanteil der Gerüsttechnologie in Frankreich (%), nach Endnutzer;
Abbildung 152: Marktanteil der Gerüsttechnologie in Frankreich (%), nach Endnutzer;
Abbildung 153: Italien: Segment mit dem höchsten Anteil (%
) 154 Marktanteil der Gerüsttechnologie in Italien (%), nach Typ, 2024
Abbildung: 155 Marktanteil der Gerüsttechnologie in Italien (%), nach Typ, 2033
Abbildung: 156 Marktanteil der Gerüsttechnologie in Italien (%), nach Materialart, 2024
Abbildung: 157 Marktanteil der Gerüsttechnologie in Italien (%), nach Materialart, 2033
Abbildung: 158 Marktanteil der Gerüsttechnologie in Italien (%), nach Struktur, 2024
Abbildung: 159 Marktanteil der Gerüsttechnologie in Italien (%), nach Struktur, 2033
Abbildung: 160 Marktanteil der Gerüsttechnologie in Italien (%), nach Anwendung, 2024
Abbildung: 161 Marktanteil der Gerüsttechnologie in Italien (%), nach Anwendung, 2033
Abbildung: 162 Marktanteil der Gerüsttechnologie in Italien (%), nach Branchen, 2024
Abbildung: 163 Marktanteil der Gerüsttechnologie in Italien (%), nach Branchen, 2033
Abbildung: 164 Marktanteil der Gerüsttechnologie in Italien (%), nach Endnutzer, 2024
Abbildung: 165 Marktanteil der Gerüsttechnologie in Italien (%), nach Endnutzer, 2033
Abbildung: 166 Spanien: Segment mit dem höchsten Anteil (%)
Abbildung: 167 Marktanteil der Gerüsttechnologie in Spanien (%), nach Typ, 2024
Abbildung: 168 Marktanteil der Gerüsttechnologie in Spanien (%), nach Typ, 2033
Abbildung: 169 Marktanteil der Gerüsttechnologie in Spanien (%), nach Materialart, 2024
Abbildung: 170 Marktanteil der Gerüsttechnologie in Spanien (%), nach Materialart, 2033
Abbildung: 171 Marktanteil der Gerüsttechnologie in Spanien (%), nach Struktur, 2024
Abbildung: 172 Marktanteil der Gerüsttechnologie in Spanien (%), nach Struktur, 2033
Abbildung: 173 Marktanteil der Gerüsttechnologie in Spanien (%), nach Anwendung, 2024
Abbildung: 174 Marktanteil der Gerüsttechnologie in Spanien (%), nach Anwendung, 2033
Abbildung: 175 Marktanteil Spaniens für Gerüsttechnologie (%), nach Branchen, 2024
Abbildung: 176 Marktanteil Spaniens für Gerüsttechnologie (%), nach Branchen, 2033
Abbildung: 177 Marktanteil Spaniens für Gerüsttechnologie (%), nach Endnutzer, 2024
Abbildung: 178 Marktanteil Spaniens für Gerüsttechnologie (%), nach Endnutzer, 2033
Abbildung: 179 Übriges Westeuropa: Segment mit dem höchsten Anteil (%)
Abbildung: 180 Marktanteil Übriges Westeuropa für Gerüsttechnologie (%), nach Typ, 2024
Abbildung: 181 Marktanteil Übriges Westeuropa für Gerüsttechnologie (%), nach Typ, 2033
Abbildung: 182 Marktanteil Übriges Westeuropa für Gerüsttechnologie (%), nach Materialart, 2024
Abbildung: 183 Marktanteil Übriges Westeuropa für Gerüsttechnologie (%), nach Materialart, 2033
Abbildung: 184 Marktanteil der Gerüsttechnologie im übrigen Westeuropa (%), nach Struktur, 2024
Abbildung: 185 Marktanteil der Gerüsttechnologie im übrigen Westeuropa (%), nach Struktur, 2033
Abbildung: 186 Marktanteil der Gerüsttechnologie im übrigen Westeuropa (%), nach Anwendung, 2024
Abbildung: 187 Marktanteil der Gerüsttechnologie im übrigen Westeuropa (%), nach Anwendung, 2033
Abbildung: 188 Marktanteil der Gerüsttechnologie im übrigen Westeuropa (%), nach Branchen, 2024
Abbildung: 189 Marktanteil der Gerüsttechnologie im übrigen Westeuropa (%), nach Branchen, 2033
Abbildung: 190 Marktanteil der Gerüsttechnologie im übrigen Westeuropa (%), nach Endnutzer, 2024
Abbildung: 191 Marktanteil der Gerüsttechnologie im übrigen Westeuropa (%), nach Endnutzer, 2033
Abbildung: 192 Polen: Segment mit dem höchsten Anteil (%)
Abbildung: 193 Marktanteil der Gerüsttechnologie in Polen (%)nach Typ, 2024
Marktanteil der Gerüsttechnologie in Polen (%)
Marktanteil der Gerüsttechnologie in Polen (%), nach Typ, 2033 Abbildung: 195 Marktanteil der Gerüsttechnologie in
Polen (%), nach Materialart, 2024 Abbildung: 196 Marktanteil der Gerüsttechnologie in
Polen (%), nach Materialart, 2033 Abbildung: 197 Marktanteil der Gerüsttechnologie in Polen (
%), nach Struktur, 2024 Abbildung: 198 Marktanteil der Gerüsttechnologie in Polen (%), nach Struktur, 2033
Abbildung: 199 Marktanteil der Gerüsttechnologie in Polen (%), nach Anwendung, 2024
Abbildung: 200 Marktanteil der Gerüsttechnologie in Polen (%), nach Anwendung, 2033
Abbildung: 201 Marktanteil der Gerüsttechnologie in Polen (%), nach Branchen, 2024
Abbildung: 202 Marktanteil der Gerüsttechnologie in Polen (%), nach Branchen, 2033
Abbildung: 203 Marktanteil der Gerüsttechnologie in Polen (%) Nach Endnutzer, 2024
Abbildung: 204 Marktanteil Polens (%), nach Endnutzer, 2033
Abbildung: 205 Russland: Segment mit dem höchsten Anteil (%)
Abbildung: 206 Marktanteil Russlands (%), nach Typ, 2024
Abbildung: 207 Marktanteil Russlands (%), nach Typ, 2033
Abbildung: 208 Marktanteil Russlands (%), nach Materialart, 2024
Abbildung: 209 Marktanteil Russlands (%), nach Materialart, 2033
Abbildung: 210 Marktanteil Russlands (%), nach Struktur, 2024
Abbildung: 211 Marktanteil Russlands (%), nach Struktur, 2033
Abbildung: 212 Marktanteil Russlands (%), nach Anwendung, 2024
: 213 Marktanteil Russlands (%), nach Anwendung, 2033
Abbildung214 Marktanteil der Gerüsttechnologie in Russland (%), nach Branchen, 2024
Abbildung: 215 Marktanteil der Gerüsttechnologie in Russland (%), nach Branchen, 2033
Abbildung: 216 Marktanteil der Gerüsttechnologie in Russland (%), nach Endnutzer, 2024
Abbildung: 217 Marktanteil der Gerüsttechnologie in Russland (%), nach Endnutzer, 2033
Abbildung: 218 Übriges Osteuropa: Segment mit dem höchsten Anteil (%)
Abbildung: 219 Marktanteil der Gerüsttechnologie im übrigen Osteuropa (%), nach Typ, 2024
Abbildung: 220 Marktanteil der Gerüsttechnologie im übrigen Osteuropa (%), nach Typ, 2033
Abbildung: 221 Marktanteil der Gerüsttechnologie im übrigen Osteuropa (%), nach Materialart, 2024
Abbildung: 222 Marktanteil der Gerüsttechnologie im übrigen Osteuropa (%), nach Materialart, 2033
Abbildung: 223 Marktanteil der Gerüsttechnologie im übrigen Osteuropa (%), Nach Struktur, 2024
Abbildung: 224 Marktanteil der Gerüsttechnologie im übrigen Osteuropa (%), nach Struktur, 2033
Abbildung: 225 Marktanteil der Gerüsttechnologie im übrigen Osteuropa (%), nach Anwendung, 2024
Abbildung: 226 Marktanteil der Gerüsttechnologie im übrigen Osteuropa (%), nach Anwendung, 2033
Abbildung: 227 Marktanteil der Gerüsttechnologie im übrigen Osteuropa (%), nach Branchen, 2024
Abbildung: 228 Marktanteil der Gerüsttechnologie im übrigen Osteuropa (%), nach Branchen, 2033
Abbildung: 229 Marktanteil der Gerüsttechnologie im übrigen Osteuropa (%), nach Endnutzer, 2024
Abbildung: 230 Marktanteil der Gerüsttechnologie im übrigen Osteuropa (%), nach Endnutzer, 2033
Abbildung: 231 Asien-Pazifik: Segment mit dem höchsten Anteil (%)
Abbildung: 232 Asien-Pazifik: Nettopotenzialzuwachs in Mio. US$
Abbildung: 233 Asien-Pazifik: Wirkungsanalyse – Diagramm
Abbildung: 234 Asien-Pazifik: Chancenbewertung nach Typ
Abbildung: 235 Asien-Pazifik: Chancenbewertung nach Materialart
Abbildung: 236 Asien-Pazifik: Chancenbewertung nach Struktur
Abbildung: 237 Asien-Pazifik: Chancenbewertung nach Anwendung
Abbildung: 238 Asien-Pazifik: Chancenbewertung nach Branchensegmenten Abbildung
: 239 Asien-Pazifik: Chancenbewertung nach Endnutzer
Abbildung: 240 Marktanteil der Gerüsttechnologie im Asien-Pazifik-Raum (%), nach Land, 2024
Abbildung: 241 Marktanteil der Gerüsttechnologie im Asien-Pazifik-Raum (%), nach Land, 2033
Abbildung: 242 Marktanteil der Gerüsttechnologie im Asien-Pazifik-Raum (%), nach Typ, 2024
Abbildung: 243 Marktanteil der Gerüsttechnologie im Asien-Pazifik-Raum (%), nach Typ, 2033
Abbildung: 244 Marktanteil der Gerüsttechnologie im Asien-Pazifik-Raum (%), nach Materialart, 2024
Abbildung: 245 Asien Marktanteil der Gerüsttechnologie im asiatisch-pazifischen Raum (%), nach Materialart, 2033
Abbildung: 246 Marktanteil der Gerüsttechnologie im asiatisch-pazifischen Raum (%), nach Struktur, 2024
Abbildung: 247 Marktanteil der Gerüsttechnologie im asiatisch-
pazifischen Raum (%), nach Struktur, 2033 Abbildung: 248 Marktanteil der Gerüsttechnologie im asiatisch-pazifischen Raum (%), nach Anwendung, 2024
Abbildung: 249 Marktanteil der Gerüsttechnologie im asiatisch-pazifischen Raum (%), nach Anwendung, 2033
Abbildung: 250 Marktanteil der Gerüsttechnologie im asiatisch-pazifischen Raum (%), nach Branchen, 2024
Abbildung: 251 Marktanteil der Gerüsttechnologie im asiatisch-pazifischen Raum (%), nach Branchen, 2033
Abbildung: 252 Marktanteil der Gerüsttechnologie im asiatisch-pazifischen Raum (%), nach Endnutzer, 2024
Abbildung: 253 Marktanteil der Gerüsttechnologie im asiatisch-pazifischen Raum (%), nach Endnutzer, 2033
Abbildung: 254 China: Segment mit dem höchsten Anteil (%) Abbildung
: 255 China Marktanteile der Gerüsttechnologie in China (%), nach Typ, 2024
Abbildung: 256 Marktanteile der Gerüsttechnologie in China (%), nach Typ, 2033
Abbildung: 257 Marktanteile der Gerüsttechnologie in China (%), nach Materialart, 2024
Abbildung: 258 Marktanteile der Gerüsttechnologie in China (%), nach Materialart, 2033
Abbildung: 259 Marktanteile der Gerüsttechnologie in China (%), nach Struktur, 2024
Abbildung: 260 Marktanteile der Gerüsttechnologie in China (%), nach Struktur, 2033
Abbildung: 261 Marktanteile der Gerüsttechnologie in China (%), nach Anwendung, 2024
Abbildung: 262 Marktanteile der Gerüsttechnologie in China (%), nach Anwendung, 2033
Abbildung: 263 Marktanteile der Gerüsttechnologie in China (%), nach Branchen, 2024
Abbildung: 264 Marktanteile der Gerüsttechnologie in China (%), nach Branchen, 2033
Abbildung: 265 China Marktanteil der Gerüsttechnologie (%), nach Endnutzer, 2024
Abbildung: 266 Marktanteil der Gerüsttechnologie in China (%), nach Endnutzer, 2033
Abbildung: 267 Indien: Segment mit dem höchsten Anteil (%)
Abbildung: 268 Marktanteil der Gerüsttechnologie in Indien (%), nach Typ, 2024
Abbildung: 269 Marktanteil der Gerüsttechnologie in
Indien (%), nach Typ, 2033 Abbildung: 270 Marktanteil der Gerüsttechnologie (%), nach Materialart, 2024
Abbildung: 271 Marktanteil der Gerüsttechnologie in Indien (%), nach Materialart, 2033
Abbildung: 272 Marktanteil der Gerüsttechnologie in Indien (%), nach Struktur, 2024
Abbildung: 273 Marktanteil der Gerüsttechnologie in Indien (%), nach Struktur, 2033
Abbildung: 274 Marktanteil der Gerüsttechnologie in Indien (%), nach Anwendung, 2024
Abbildung: 275 Marktanteil der Gerüsttechnologie in Indien (%), nach Anwendung, 2033
Abbildung: 276 Marktanteil der Gerüsttechnologie in Indien (%), nach Branchen, 2024
Abbildung: 277 Marktanteil der Gerüsttechnologie in Indien (%), nach Branchen, 2033
Abbildung: 278 Marktanteil der Gerüsttechnologie in Indien (%), nach Endnutzer, 2024
Abbildung: 279 Marktanteil der Gerüsttechnologie in Indien (%), nach Endnutzer, 2033
Abbildung: 280 Japan: Höchster Anteil (%) Segment
Abbildung: 281 Marktanteil der Gerüsttechnologie in Japan (%), nach Typ, 2024
Abbildung: 282 Marktanteil der Gerüsttechnologie in Japan (%), nach Typ, 2033
Abbildung: 283 Marktanteil der Gerüsttechnologie in Japan (%), nach Materialart, 2024
Abbildung: 284 Marktanteil der Gerüsttechnologie in Japan (%), nach Materialart, 2033
Abbildung: 285 Marktanteil der Gerüsttechnologie in Japan (%), nach Struktur, 2024
Abbildung: 286 Marktanteil der Gerüsttechnologie in Japan (%), nach Struktur, 2033
Abbildung: 287 Marktanteil der Gerüsttechnologie in Japan (%), nach Anwendung, 2024
Abbildung: 288 Marktanteil der Gerüsttechnologie in Japan (%), nach Anwendung, 2033
Abbildung: 289 Marktanteil der Gerüsttechnologie in Japan (%), nach Branchen, 2024
Abbildung: 290 Marktanteil der Gerüsttechnologie in Japan (%), nach Branchen, 2033
Abbildung: 291 Marktanteil Japans (%), nach Endnutzer, 2024
Abbildung: 292 Marktanteil Japans (%), nach Endnutzer, 2033
Abbildung: 293 Südkorea: Höchster Marktanteil (%) Segment
Abbildung: 294 Marktanteil Südkoreas (%), nach Typ, 2024
Abbildung: 295 Marktanteil Südkoreas (%), nach Typ, 2033
Abbildung: 296 Marktanteil Südkoreas (%), nach Materialart, 2024
Abbildung: 297 Marktanteil Südkoreas (%), nach Materialart, 2033
Abbildung: 298 Marktanteil Südkoreas (%), nach Struktur, 2024
Abbildung: 299 Marktanteil Südkoreas (%), nach Struktur, 2033
Abbildung: 300 Marktanteil Südkoreas (%), nach Anwendung, 2024
Abbildung: 301 Marktanteil Südkorea Gerüsttechnologie (%), nach Anwendung, 2033
Abbildung: 302 Marktanteil Südkorea Gerüsttechnologie (%), nach Branchen, 2024
Abbildung: 303 Marktanteil Südkorea Gerüsttechnologie (%), nach Branchen, 2033
Abbildung: 304 Marktanteil Südkorea Gerüsttechnologie (%), nach Endnutzer, 2024
Abbildung: 305 Marktanteil Südkorea Gerüsttechnologie (%), nach Endnutzer, 2033
Abbildung: 306 Australien & Neuseeland: Segment mit dem höchsten Anteil (%)
Abbildung: 307 Marktanteil Australien & Neuseeland Gerüsttechnologie (%), nach Typ, 2024
Abbildung: 308 Marktanteil Australien & Neuseeland Gerüsttechnologie (%), nach Typ, 2033
Abbildung: 309 Marktanteil Australien & Neuseeland Gerüsttechnologie (%), nach Materialart, 2024
Abbildung: 310 Marktanteil der Gerüsttechnologie in Australien und Neuseeland (%), nach Materialart, 2033
Abbildung: 311 Marktanteil der Gerüsttechnologie in Australien und Neuseeland (%), nach Struktur, 2024
Abbildung: 312 Marktanteil der Gerüsttechnologie in Australien und Neuseeland (%), nach Struktur, 2033
Abbildung: 313 Marktanteil der Gerüsttechnologie in Australien und Neuseeland (%), nach Anwendung, 2024
Abbildung: 314 Marktanteil der Gerüsttechnologie in Australien und Neuseeland (%), nach Anwendung, 2033
Abbildung: 315 Marktanteil der Gerüsttechnologie in Australien und Neuseeland (%), nach Branchen, 2024
Abbildung: 316 Marktanteil der Gerüsttechnologie in Australien und Neuseeland (%), nach Branchen, 2033
Abbildung: 317 Marktanteil der Gerüsttechnologie in Australien und Neuseeland (%), nach Endnutzer, 2024
Abbildung: 318 Marktanteil der Gerüsttechnologie in Australien und Neuseeland (%), nach Endnutzer319
ASEAN: Segment mit dem höchsten Anteil (%)
Abbildung 320 Marktanteil der Gerüsttechnologie in ASEAN (%), nach Typ, 2024
Abbildung 321 Marktanteil der Gerüsttechnologie in ASEAN (%), nach Typ, 2033
Abbildung 322 Marktanteil der Gerüsttechnologie in ASEAN (%), nach Materialart, 2024
Abbildung 323 Marktanteil der Gerüsttechnologie in ASEAN (%), nach Materialart, 2033
Abbildung 324 Marktanteil der Gerüsttechnologie in ASEAN (%), nach Struktur, 2024
Abbildung 325 Marktanteil der Gerüsttechnologie in ASEAN (%), nach Struktur, 2033
Abbildung 326 Marktanteil der Gerüsttechnologie in ASEAN (%), nach Anwendung, 2024
Abbildung 327 Marktanteil der Gerüsttechnologie in ASEAN (%), nach Anwendung, 2033
Abbildung 328 Marktanteil der Gerüsttechnologie in ASEAN (%), nach Branchen2024;
Abbildung 329: Marktanteil der Gerüsttechnologie in ASEAN (%), nach Branchen,
Abbildung 330: Marktanteil der Gerüsttechnologie in ASEAN (%), nach Endnutzer,
; Abbildung 331: Marktanteil der Gerüsttechnologie in ASEAN (%), nach Endnutzer, 2033;
Abbildung 332: Restliches Asien-Pazifik: Segment mit dem höchsten Anteil (%);
Abbildung 333: Marktanteil der Gerüsttechnologie im übrigen Asien-Pazifik (%), nach Typ, 2024;
Abbildung 334: Marktanteil der Gerüsttechnologie im übrigen Asien-Pazifik (%), nach Typ, 2033
; Abbildung 335: Marktanteil der Gerüsttechnologie im übrigen Asien-Pazifik (%), nach Materialart, 2024;
Abbildung 336: Marktanteil der Gerüsttechnologie im übrigen Asien-Pazifik (%), nach Materialart, 2033;
Abbildung 337: Marktanteil der Gerüsttechnologie im übrigen Asien-Pazifik (%), nach Struktur, 2024;
Abbildung 338: Restliches Asien-Pazifik Marktanteil der Gerüsttechnologie im asiatisch-pazifischen Raum (%), nach Struktur, 2033
Abbildung: 339 Marktanteil der Gerüsttechnologie im übrigen asiatisch-pazifischen Raum (%), nach Anwendung, 2024
Abbildung: 340 Marktanteil der Gerüsttechnologie im übrigen asiatisch-pazifischen Raum (%), nach Anwendung, 2033
Abbildung: 341 Marktanteil der Gerüsttechnologie im übrigen asiatisch-pazifischen Raum (%), nach Branchen, 2024
Abbildung: 342 Marktanteil der Gerüsttechnologie im übrigen asiatisch-pazifischen Raum (%), nach Branchen, 2033
Abbildung: 343 Marktanteil der Gerüsttechnologie im übrigen asiatisch-pazifischen Raum (%), nach Endnutzer, 2024
Abbildung: 344 Marktanteil der Gerüsttechnologie im übrigen asiatisch-pazifischen Raum (%), nach Endnutzer, 2033
Abbildung: 345 Rest der Welt: Segment mit dem höchsten Anteil (%)
Abbildung: 346 Rest der Welt: Nettopotenzialzuwachs in Mio. US-Dollar
Abbildung: 347 Rest der Welt: Wirkungsanalyse –
Diagramm 348 Übrige Welt: Chancenanalyse nach Typ
Abbildung: 349 Übrige Welt: Chancenanalyse nach Materialart
Abbildung: 350 Übrige Welt: Chancenanalyse nach Struktur
Abbildung: 351 Übrige Welt: Chancenanalyse nach Anwendung
Abbildung: 352 Übrige Welt: Chancenanalyse nach Branchensegmenten
Abbildung: 353 Übrige Welt: Chancenanalyse nach Endnutzer
Abbildung: 354 Marktanteil der Gerüsttechnologie (%) nach Land, 2024
Abbildung: 355 Marktanteil der Gerüsttechnologie (%) nach Land, 2033 Abbildung
: 356 Marktanteil der Gerüsttechnologie (%) nach Typ, 2024
Abbildung: 357 Marktanteil der Gerüsttechnologie (%) nach Typ, 2033
Abbildung: 358 Marktanteil der Gerüsttechnologie (%) nach Material Typ, 2024
Abbildung: 359 Marktanteil der Gerüsttechnologie weltweit (%), nach Materialtyp, 2033
Abbildung: 360 Marktanteil der Gerüsttechnologie weltweit (%), nach Struktur, 2024
Abbildung: 361 Marktanteil der Gerüsttechnologie weltweit (%), nach Struktur, 2033
Abbildung: 362 Marktanteil der Gerüsttechnologie weltweit (%), nach Anwendung, 2024
Abbildung: 363 Marktanteil der Gerüsttechnologie weltweit (%), nach Anwendung, 2033
Abbildung: 364 Marktanteil der Gerüsttechnologie weltweit (%), nach Branchen, 2024
Abbildung: 365 Marktanteil der Gerüsttechnologie weltweit (%), nach Branchen, 2033
Abbildung: 366 Marktanteil der Gerüsttechnologie weltweit (%), nach Endnutzer, 2024
Abbildung: 367 Marktanteil der Gerüsttechnologie weltweit (%), Nach Endnutzer, 2033
Abbildung: 368 Agilent Technologies Inc.: Umsatzsegmentierung nach Geschäftsfeld, 2024
Abbildung: 369 Agilent Technologies Inc.: Umsatzsegmentierung nach geografischem Gebiet, 2024
Abbildung: 370 Becton, Dickinson and Company: Umsatzsegmentierung nach Geschäftsfeld, 2024
Abbildung: 371 Becton, Dickinson and Company: Umsatzsegmentierung nach geografischem Gebiet, 2024
Abbildung: 372 BICO Group: Umsatzsegmentierung nach Geschäftsfeld, 2024
Abbildung: 373 BICO Group: Umsatzsegmentierung nach geografischem Gebiet, 2024
Abbildung: 374 Corning Incorporated: Umsatzsegmentierung nach Geschäftsfeld, 2024
Abbildung: 375 Corning Incorporated: Umsatzsegmentierung nach geografischem Gebiet, 2024
Abbildung: 376 Merck KGaA: Umsatzsegmentierung nach Geschäftsfeld, 2024
Abbildung: 377 Merck KGaA: Umsatzsegmentierung nach geografischem Gebiet, 2024
Abbildung 378: Tecan Trading AG: Umsatzsegmentierung nach Geschäftsbereichen, 2024;
Abbildung 379: Tecan Trading AG: Umsatzsegmentierung nach Region, 2024
; Abbildung 380: Thermo Fisher Scientific, Inc.: Umsatzsegmentierung nach Geschäftsbereichen, 2024;
Abbildung 381: Thermo Fisher Scientific, Inc.: Umsatzsegmentierung nach Region, 2024


Merkmale | Lizenzart | ||||
Datenbuch | Einzelbenutzer |   Mehrere Benutzer | Unternehmen | ||
| E-Zugang | ✓ | ✓ | ✓ | ✓ | |
Benutzerfreigabe | Nur für 1 Benutzer | Nur für 1 Benutzer | Bis zu 7 Benutzer | Unbegrenzter Benutzerzugriff | |
⨉ | ⨉ | ⨉ | ✓ | ||
Kostenlose Anpassung | Keine kostenlose Anpassung | Bis zu 30 Stunden Arbeit | Bis zu 60 Stunden Arbeit | Bis zu 80 Arbeitsstunden | |
Lieferformat |
| ⨉ | ✓ | ✓ | ✓ |
| ✓ | ⨉ | ✓ | ✓ | |
| ⨉ | ⨉ | ⨉ | ✓ | |
Analystenunterstützung | 2 Monate Analystenunterstützung | 4 Monate Analystenunterstützung | 7 Monate Analystenunterstützung | Ein Jahr Analystenbetreuung | |
Kostenloses Bericht-Update im nächsten Aktualisierungszyklus | ⨉ | ⨉ | ⨉ | ✓ | |
Kostenloses Branchen-Update (Innerhalb von 180 Tagen) | ⨉ | ⨉ | ⨉ | ✓ | |
Nutzen | Bis zu 10 % Rabatt nach dem Kauf | Bis zu 20 % Rabatt nach dem Kauf | Bis zu 30 % Rabatt nach dem Kauf | Bis zu 40 % Rabatt nach dem Kauf | |