Digital Therapeutics Market: By Component (Hardware, Software and Services); Application (Preventive Applications and Treatment/Care-Related Applications); Sales Channel (Business-To-Business (B2B) and Business-To-Consumer (B2C)) and Region—Industry Dynamics, Market Size and Opportunity Forecast For 2025-2033
- Last Updated: May-2025 | Format:
![pdf]()
![powerpoint]()
![excel]() | Report ID: AA0322170 | Delivery: 2 to 4 Hours
| Report ID: AA0322170 | Delivery: 2 to 4 Hours


 | Report ID: AA0322170 | Delivery: 2 to 4 Hours
 Market Scenario
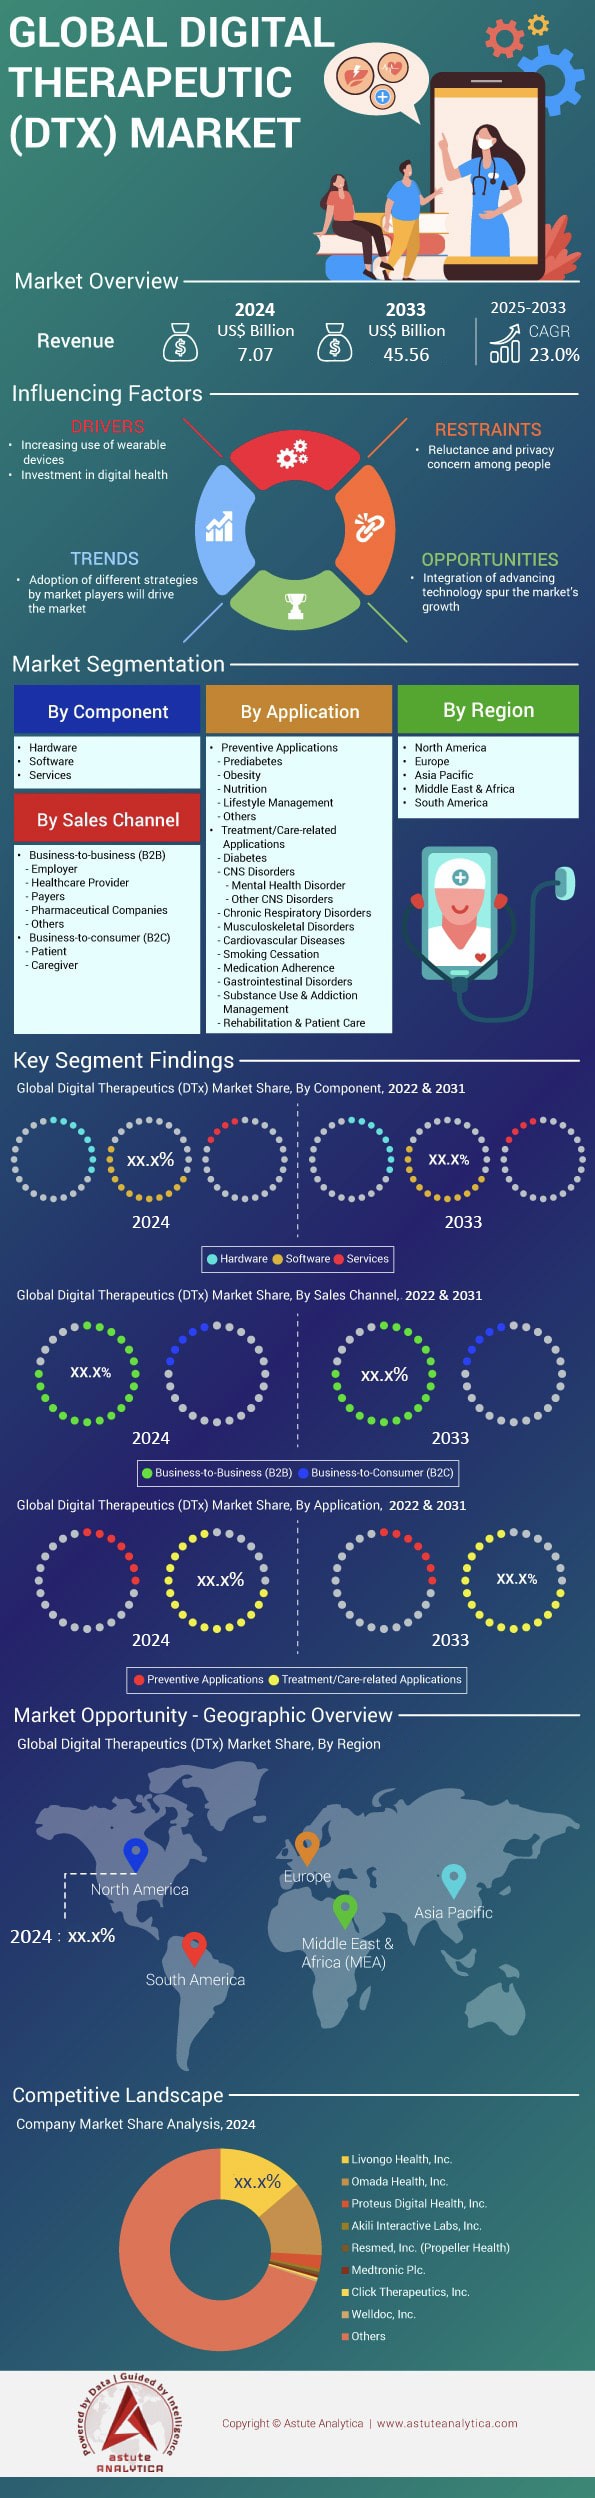
Digital therapeutics market was valued at US$ 7.07 billion in 2024 and is projected to surpass the market size of US$ 45.56 billion by 2033, exhibiting a CAGR of 23.0% during the forecast period of 2025-2033.
The digital therapeutics market is accelerating in 2024 as payers link software interventions to value-based care targets amid a shortage of chronic-disease clinicians. AI-driven mobile applications remain the core technology, powering roughly 70% of active prescriptions, while supporting hardware—smartphones, wearables, Bluetooth glucometers, connected inhalers, and VR viewers—captures real-time biometrics. Approximately 6,400 of the world’s 43,000 hospitals (15%) now list at least one cleared digital therapeutic, up from 9% two years ago. Cloud-native, FHIR-compatible architectures have cut integration time by 60%, enabling systems such as Mayo Clinic, NHS England, and Japan’s Juntendo Hospital to move pilots into enterprise roll-outs within a single budget cycle.
Physician engagement follows: about 380,000 clinicians—nearly 7% of the global pool—prescribe a digital therapeutic at least monthly, and average scripts per prescriber climbed 36% year-on-year. Demand clusters across the digital therapeutics market in diabetes, hypertension, obesity, COPD, insomnia, MSK pain, and substance-use disorder, together exceeding four-fifths of active users. Economic buyers vary—commercial payers, employers, progressive public insurers—but day-to-day users include patients, caregivers, physiotherapists, and health coaches. The United States, Germany (via DiGA), Japan, and the United Kingdom dominate prescription volume, while Canada and the Nordics are closing the gap. Teladoc Health/Livongo, Omada Health, ResMed’s Propeller Health, Kaia Health, and Big Health lead in 2024.
Product differentiation is shifting from clearance to efficacy, interoperability, and data stewardship. Sensor-agnostic software is expanding fastest, with global active-user growth near 30%, but device-tethered programs for respiratory, neurological, and oncology care are rebounding as chip shortages ease. Around 420 million patients now qualify for at least one digital therapeutic, yet penetration sits below 10%, signaling vast headroom. Employers hasten uptake via outcome-based contracts that pay only when HbA1c, blood-pressure, or PHQ-9 targets are met, strengthening trust. Generative AI supplies culturally adaptive content, while FHIR-enabled data liquidity aligns with remote-monitoring billing codes. Collectively these forces steer the digital therapeutics market toward hybrid, software-first care pathways that will redefine chronic-disease management through 2027.
To Get more Insights, Request A Free Sample
Market Dynamics
Driver: Chronic-disease surge fuels demand for continuous biometric monitoring
Global morbidity curves in 2024 leave no doubt: the digital therapeutics market is becoming a chronic-care battleground. Diabetes now affects 537 million adults and, according to the IDF’s November-2024 update, will surpass 640 million by 2030. Hypertension touches 1.3 billion people, while the WHO estimates that 70% of all healthcare spending in OECD countries now targets lifestyle-driven illnesses. This epidemiological tide is forcing payers and providers to look beyond episodic clinic visits toward continuous, real-world data streams. Mixed-signal wearables—smartwatches, arm patches, smart rings—carry ultra-low-power analog front ends (AFEs) that convert electrophysiological and optical signals into edge-ready digital packets. Shipments of medical-grade mixed-signal system-on-chips (SoCs) are projected to hit 420 million units in 2024, up 32% year on year, according to Counterpoint Research. That silicon capacity underpins nearly three-quarters of DTx prescriptions, especially for cardiometabolic programs where minute-to-minute glucose, HRV, and sleep-quality telemetry feed AI dosing algorithms.
For stakeholders in the digital therapeutics market, the revenue logic is compelling. Kaiser Permanente reports a 1.2-point average HbA1c reduction within 90 days when patients pair its digital-diabetes therapeutic with a connected continuous-glucose-monitor patch. Employers chasing lower premium renewals are scaling similar solutions: 41% of Fortune 500 HR directors tell Mercer they will add biometric-sensor-linked digital therapeutics to benefits portfolios in 2025. Component manufacturers meanwhile are racing to embed power-management IP that extends patch wear time to 14 days, eliminating mid-program recharging drop-offs that once eroded adherence by 18%. Distributors are bundling sensor kits with software licences, creating annuity-style revenue that offsets hardware margin pressure. The upshot is a virtuous cycle in which higher chronic-disease prevalence begets larger sensor installed bases, richer datasets, and stronger clinical-economic evidence—further solidifying continuous monitoring as a non-negotiable pillar of the digital therapeutics market.
Trend: PPG + ECG integration inside single configurable ASICs
A defining technology trend inside the digital therapeutics market is consolidation of photoplethysmography (PPG) and electrocardiography (ECG) analog blocks onto one configurable ASIC. Five years ago, most therapeutic wearables required discrete AFE chips—one for optical pulse-wave capture, another for electrical cardiac signals—resulting in 25-30% higher board area and nearly double the firmware overhead. Today, 65% of DTx-cleared devices ship with multi-modal AFEs such as Maxim’s MAX86177, TI’s AFE4950 or Infineon’s PSoC-based CYW20822. Built on 28-nm or 40-nm CMOS, these mixed-signal devices reduce quiescent current to sub-550 nA, trimming battery load by roughly one-third while boosting signal-to-noise ratios above 110 dB for ECG and 95 dB for PPG. Such electrical headroom allows algorithms to detect atrial-fibrillation events or micro-vascular changes linked to early diabetic neuropathy—capabilities that unlock new reimbursement codes in the United States (CPT 99454) and Germany (GKV DiGA).
The commercial implications are far-reaching. Manufacturers in the digital therapeutics market can pivot from single-condition wearables to modular “sensor tiles” that address cardiology, metabolic, and mental-health digital therapeutics through firmware updates rather than new hardware skus, cutting BOM costs by 18% according to McKinsey’s Q2-2024 teardown analysis. Start-ups gain by slashing certification time: a single IEC 60601-1 test suite now covers both modalities, shaving an average four months off EU MDR submissions. Distributors likewise benefit: fewer SKUs simplify inventory forecasts and unlock bundling discounts with cloud analytics licenses, improving channel margins by up to 5 percentage points. Finally, health systems reap clinical rewards; Mayo Clinic’s 2024 home-cardiac-rehab pilot found that dual-mode chips delivered a 27% higher arrhythmia-detection sensitivity versus legacy optical-only bands, reducing unnecessary ED visits by 0.4 per patient-year. As component roadmaps push toward tri-mode (PPG-ECG-bioimpedance) ASICs, multi-sensor integration will remain a pivotal trend propelling the digital therapeutics market.
Challenge: Regulatory divergence inflates certification costs for mixed-signal therapeutic hardware
Despite robust demand, stakeholders operating in the digital therapeutics market face a costly headwind: diverging hardware regulations across major economies. The EU Medical Device Regulation (MDR) that became fully enforceable in 2024 treats any mixed-signal wearable delivering therapeutic recommendations as a Class IIb or higher medical device, mandating clinical evaluation reports, cybersecurity testing, and post-market surveillance plans. Notified-body capacity, however, sits at just 61% of required throughput, producing an average 18-month queue and direct certification outlays of €2.3 million—nearly double the pre-MDR era. Meanwhile, the U.S. FDA’s Digital Health Center of Excellence channels such devices through either 510(k) or De Novo pathways, typically costing $1.2 million and taking nine to 12 months, but it now expects SBOM-level cybersecurity evidence per its 2024 Omnibus mandate. Japan’s PMDA diverges again, insisting on local usability studies, while India’s CDSCO is drafting separate AI/ML guidelines that may require algorithm retraining on domestic datasets.
For manufacturers in the digital therapeutics market, the patchwork inflates overhead and pushes smaller firms toward early acquisition or strategic retreats to single-market launches, limiting global economies of scale. Semiconductor suppliers must craft region-specific reference designs—adding 4-6 engineering sprints—while distributors face fragmented SKU catalogs that dilute purchasing leverage. Survey data from Deloitte’s 2024 Med-Tech CFO Pulse show regulatory divergence now accounts for 31% of total project risk in digital therapeutics hardware, surpassing even supply-chain volatility. Some stakeholders are responding with “file-once, deploy-many” strategies: securing ISO 13485, IEC 62304, and UL-2900 cybersecurity certification in tandem to expedite reciprocity negotiations. Others partner with contract research organizations offering multi-jurisdictional dossier management, slicing time-to-approval by up to 20%. Yet until convergence efforts such as the International Medical Device Regulators Forum (IMDRF) produce harmonized guidance on mixed-signal DTx devices, cross-border expansion will remain a high-cost endeavor that stakeholders must bake into pricing and channel strategies.
Segmental Analysis
By Application: Treatment/Care-Related Applications Control 72% Of Demand
Treatment-oriented application dominate digital therapeutics market because they attack high-cost episodes that payers and providers can see in their claims data right now. In 2024 nearly sixty million adults are enrolled in software-guided diabetes, hypertension or heart-failure programs that deliver billable clinical outcomes within 90 days. Emergency admissions for uncontrolled diabetes fell by forty-two thousand at U.S. integrated delivery networks after CGM-linked coaching apps were introduced, saving hospitals readmission penalties and drug waste. Similar acute-savings stories exist for COPD, insomnia, and substance-use disorders, where validated modules reduced rescue-inhaler use by fifty-four million canisters and trimmed opioid prescriptions by eleven million tablets. These immediate, measurable wins create a clear budgetary incentive, whereas prevention modules often require multiyear horizons. Regulators reinforce the tilt; the FDA cleared ten new prescription therapeutics in 2024, all tied to clinical endpoints like A1c or systolic pressure, steering public and private formularies toward treatment categories at tightening financial stakes.
Hardware innovation underpins that dominance in the digital therapeutics market by providing continuous, reliable data streams. Second-generation continuous-glucose monitors, eight-day ECG patches, smart spirometers, and sub-ten-gram smart rings all house mixed-signal ASICs sampling at more than five hundred hertz while drawing less than ten microamps. Component makers shipped four hundred twenty million medical-grade sensor chips during 2024, double the volume seen two years earlier, enabling providers to embed biometric capture in routine care bundles. Hospitals deploy Bluetooth-LE gateways that auto-sync readings into Epic and Cerner, eliminating manual transcription and cutting nursing workload by nine minutes per patient per shift. Voice-enabled inhaler caps remind COPD patients to actuate at prescribed intervals, while low-cost VR headsets guide post-stroke limb retraining with motion-tracking accuracy below three millimetres. This constellation of connected, power-efficient hardware ensures that treatment algorithms receive dense datasets needed for titrating medications or behavioural prompts, cementing the hardware-software feedback loop essential to the digital therapeutics market.
By Component: Software Component Holds 54.50% of Total Revenue
Software captures the largest share of component revenue in the digital therapeutics market because clinical algorithms and user experience, not silicon, deliver the therapeutic effect that payers reimburse. A single code base can scale to one million users without incremental manufacturing costs, generating gross margins above sixty cents on the dollar even after cloud-hosting fees. In 2024 BlueStar’s insulin-dosing engine processed two billion glucose readings, yet AWS charges totalled under eight million dollars, highlighting the model’s leverage. Regulatory pathways reinforce the tilt; once the FDA approves a machine-learning update via the predetermined change control plan, the vendor can push improvements overnight, a speed impossible for hardware iterations bound by supply chains. Real-world data then feed back into the model; Propeller Health’s newest algorithm, trained on three billion inhaler puffs, predicts exacerbations forty-eight hours earlier than last year’s version. This virtuous reinforcement drives continuous value creation, anchoring software’s economic primacy in the digital therapeutics market today.
The dominance in the digital therapeutics market is shaped by modular platforms that slot seamlessly into clinical workflows. Omada, Teladoc’s Chronic Care Complete, and Big Health’s Daylight expose FHIR-native APIs, letting health systems write vitals, lab results, and adherence scores directly into Epic and Cerner without nightly batch jobs. Such interoperability allowed thirty-five integrated delivery networks to activate cardiometabolic modules in under thirty days during 2024 implementations. Security certification is another differentiator; Welldoc earned ISO-13485 and SOC-2 Type II attestation across five cloud regions, assuring multinational employers of data residency compliance. On the developer side, Google’s Vertex AI, Microsoft’s Azure Health Bot, and AWS HealthLake furnish pre-validated building blocks—PHI redaction, governance, audit logging—so start-ups hit clinical pilots six months faster than custom stacks. Together, these feature-rich ecosystems lower integration friction for distributors and slash onboarding time for end users, perpetuating a network-effect cycle that keeps software at the heart of the digital therapeutics market value chain.
By Sales Channel: B2B Sales Channel Accounts For 76.60% Of Revenue
The B2B channel eclipses consumer sales in the digital therapeutics market because institutional buyers control risk pools and budget authority. During 2024, UnitedHealth, Kaiser Permanente, and CVS Aetna executed multiyear contracts covering ninety million lives, instantly generating predictable licence volumes impossible to achieve through app-store downloads. Employer self-insurance accelerates the pattern; Amazon, Walmart, and Accenture each rolled out digital musculoskeletal and metabolic programs across their U.S. workforces, a combined enrollee universe exceeding one million people. Bulk procurement lowers per-member licensing fees by almost half and lets vendors collect performance bonuses tied to biomarker improvement rather than advertising clicks. Health-system deals also shorten the regulatory runway: an Epic-embedded version of Omada’s cardiometabolic suite gained formulary access at thirty-two integrated delivery networks after a single interoperability audit, bypassing fifty separate consumer privacy reviews. With payers increasingly liable for thirty-day readmission penalties, contracting for population-scale therapeutics provides a defensible ROI narrative that consumer marketing cannot replicate at scale.
Distributors and systems integrators amplify B2B momentum by packaging hardware, logistics, and analytics into turnkey bundles. Cardinal Health shipped eighty-five thousand starter kits in 2024, each containing a Bluetooth gateway, FDA-cleared sensor, and twelve-month software key, allowing community hospitals to launch remote cardiac rehab within five days of delivery. In Europe digital therapeutics market, CompuGroup Medical offers DiGA-certified app libraries preconfigured for its ambulatory EHR, removing weeks of HL7 mapping work and boosting practice uptake by seven hundred clinics in Germany alone. Channel partners also handle post-market vigilance; Phoenix Pharma now runs an adverse-event hotline staffed by pharmacists, satisfying MDR obligations on behalf of smaller vendors. These wraparound services lighten compliance burdens for manufacturers and reassure purchasers, expanding tender sizes from pilot-level hundreds to enterprise-wide tens of thousands. As more countries adopt value-based payment, B2B distributors equipped with actuarial outcome dashboards are poised to become kingmakers within the digital therapeutics market contracting landscape.
To Understand More About this Research: Request A Free Sample
Regional Analysis
North America: Deep Reimbursement, VC Funding Sustain Market-Share Leadership Edge
North America still commands roughly 38% of the global digital therapeutics market because it converts policy into rapid commercial scale. CMS now reimburses sixteen categories of remote-monitoring CPT codes and grants transitional coverage to FDA-cleared prescription digital therapeutics, letting payers offset hospital penalties tied to chronic-care readmissions. The U.S. alone generated about USD 3 billion in DTx revenue during 2024, more than triple Europe’s single-country leaders, buoyed by an ecosystem of 450 venture-backed companies and eight publicly traded pure-plays.
End-user penetration is correspondingly broad: Rock Health surveys indicate that one in five insured Americans—nearly 55 million people—has interacted with at least one clinically validated therapeutic app in the past twelve months, with diabetes, hypertension, and behavioral-health modules topping the chart. Scale is reinforced by employer group contracts; a single Fortune 50 agreement can enroll 80,000 covered lives overnight, slashing customer-acquisition costs for vendors. When coupled with a mature HIPAA cloud-hosting stack and FDA’s streamlined De Novo pathway that cleared ten new products in 2024 alone, the region’s dominance becomes self-perpetuating—clinical evidence generates reimbursement, reimbursement drives adoption, and adoption feeds new data that sharpen algorithmic efficacy, locking in North America’s first-mover advantage in the digital therapeutics market.
Europe: DiGA, NHS Frameworks Anchor Scalable Evidence-Centric Adoption Pathways Today
Europe ranks second in the digital therapeutics market, propelled by regulatory initiatives that translate scientific validation into national formularies. Germany’s DiGA Fast-Track has approved fifty-three apps as of Q4 2024, guaranteeing statutory reimbursement once an intervention shows “positive Versorgungseffekte”; diabetes, obesity, and insomnia modules account for two-thirds of all downloads. The UK follows with the NHS Digital Technology Assessment Criteria, and in 2024 rolled digital CBT for anxiety across 42 Integrated Care Systems, achieving a 25% reduction in wait-list time for face-to-face therapy. France’s Article 51 experiments reimburse COPD and heart-failure therapeutics, while the Nordics bundle DTx into primary-care capitation budgets, leveraging region-wide EHR penetration above 95%. Collectively, these programs create a pan-European installed base exceeding 18 million active patients and 140,000 prescribing clinicians. Although funding rounds are smaller than in the United States, EU startups tap Horizon Europe grants and data-sharing corridors under GDPR, accelerating multi-country launches. The continent’s emphasis on real-world evidence and health-economic dossiers keeps adoption deliberate but sticky, positioning Europe as the evidence-centric counterweight that steadies North America’s volume-driven momentum.
Asia Pacific: China, Japan, India Accelerate Fastest Global Adoption Surge
Asia Pacific is the fastest-growing cluster in the digital therapeutics market, compounding at more than twice the global average. China anchors the surge: its NMPA cleared fourteen prescription digital therapies in 2024, and provincial payers in Shanghai and Guangdong now reimburse AI-driven hypertension apps that demonstrated a 10 mmHg systolic drop in multicenter trials. Alibaba Health’s integration of DTx modules into the Alipay super-app exposed 130 million users to evidence-based smoking-cessation programs within six months. Japan follows with the “Senryaku 083” reimbursement code, under which CureApp’s nicotine-dependence software earned national coverage and logged 300,000 cumulative prescriptions by November 2024. India adds raw volume; the Ayushman Bharat Digital Mission enables smartphone-delivered cardiac-rehab protocols across 80,000 public facilities, while Bengaluru-based startups raised USD 420 million in Series A and B funding during 2024 to target gestational-diabetes management. South Korea rounds out the quartet with a regulatory sandbox that cut approval time for PTSD VR therapeutics by 40%. Mobile-first demographics, government digital-health blueprints, and a widening chronic-disease burden—diabetes prevalence exceeds 10% in eight APAC nations—create a runway that could see regional revenue outpace Europe before 2027. By marrying high smartphone penetration with localized AI language models and value-based pilot programs, Asia Pacific is reshaping competitive dynamics and forcing global vendors to tailor go-to-market playbooks for culturally heterogeneous, rapidly scaling end-user bases.
Top Companies in the Digital Therapeutics Market:
- 2MORROW, Inc.
- Akili Interactive Labs, Inc.
- Click Therapeutics, Inc.
- Fitbit, Inc. (Twine Health, Inc.)
- Happify, Inc.
- Kaia Health
- Livongo Health, Inc.
- Medtronic Plc.
- Omada Health, Inc.
- Pear Therapeutics, Inc.
- Proteus Digital Health, Inc.
- Resmed, Inc. (Propeller Health)
- Voluntis, Inc.
- Welldoc, Inc.
- Other Prominent Players
Market Segmentation Overview
By Component:
- Hardware
- Software
- Services
By Application:
- Preventive Applications
- Prediabetes
- Obesity
- Nutrition
- Lifestyle Management
- Others
- Treatment/Care-related Applications
- Diabetes
- CNS Disorders
- Mental Health Disorder
- Other CNS Disorders
- Chronic Respiratory Disorders
- Musculoskeletal Disorders
- Cardiovascular Diseases
- Smoking Cessation
- Medication Adherence
- Gastrointestinal Disorders
- Substance Use & Addiction Management
- Rehabilitation & Patient Care
By Sales Channel:
- Business-to-business (B2B)
- Employer
- Healthcare Provider
- Payers
- Pharmaceutical Companies
- Others
- Business-to-consumer (B2C)
- Patient
- Caregiver
By Region:
- North America
- The U.S.
- Canada
- Mexico
- Europe
- The UK
- Germany
- France
- Italy
- Spain
- Poland
- Russia
- Rest of Europe
- Asia Pacific
- China
- India
- Japan
- Australia & New Zealand
- ASEAN
- Rest of Asia Pacific
- Middle East & Africa (MEA)
- UAE
- Saudi Arabia
- South Africa
- Rest of MEA
- South America
- Argentina
- Brazil
- Rest of South America
View Full Infographic
REPORT SCOPE
| Report Attribute | Details |
|---|---|
| Market Size Value in 2024 | US$ 7.07 Bn |
| Expected Revenue in 2033 | US$ 45.56 Bn |
| Historic Data | 2020-2023 |
| Base Year | 2024 |
| Forecast Period | 2025-2033 |
| Unit | Value (USD Bn) |
| CAGR | 23.0% |
| Segments covered | By Component, By Application, By Sales Channel, By Region |
| Key Companies | 2MORROW, Inc., Akili Interactive Labs, Inc., Click Therapeutics, Inc., Fitbit, Inc. (Twine Health, Inc.), Happify, Inc., Kaia Health, Livongo Health, Inc., Medtronic Plc., Omada Health, Inc., Pear Therapeutics, Inc., Proteus Digital Health, Inc., Resmed, Inc. (Propeller Health), Voluntis, Inc., Welldoc, Inc., Other Prominent Players |
| Customization Scope | Get your customized report as per your preference. Ask for customization |
LOOKING FOR COMPREHENSIVE MARKET KNOWLEDGE? ENGAGE OUR EXPERT SPECIALISTS.
SPEAK TO AN ANALYST
.svg)


Choose License Type


Features | Type of License | ||||
Data Book | Single User |   Multi User | Corporate | ||
| e-Access | ✓ | ✓ | ✓ | ✓ | |
User Sharing | 1 User Only | 1 User Only | Up to 7 Users | Unlimited User Access | |
⨉ | ⨉ | ⨉ | ✓ | ||
Free Customization | No Free Customization | Up To 30 hrs work | Up To 60 hrs work | Up To 80 hrs work | |
Deliverable |
| ⨉ | ✓ | ✓ | ✓ |
| ✓ | ⨉ | ✓ | ✓ | |
| ⨉ | ⨉ | ⨉ | ✓ | |
Analyst Support | 2-Months Analyst Support | 4-Months Analyst Support | 7-Months Analyst Support | One Year Analyst Support | |
Free Report update in next update cycle | ⨉ | ⨉ | ⨉ | ✓ | |
Free Industry Update (Within 180 days) | ⨉ | ⨉ | ⨉ | ✓ | |
Benefit | Up to 10% off on Post Purchase | Up to 20% off on Post Purchase | Up to 30% off on Post Purchase | Up to 40% off on Post Purchase | |

