Global Smartphones Market: By Operating System (Windows, Android, IOS, and Others); RAM Size (Below 2GB, 2GB-4GB, 4GB-8GB, and Others); Generation (3G, 4G and 5G); By Screen Size (Below 4.0", 0"–5.0" and Above 5.0"); Price Range (< US$ 100, US$ 101 – US$ 200 and Others); Distribution Channel (Online and Offline); Brand (Apple, Samsung, Xiaomi, and Others); and Region— Market Size, Industry Dynamics, Opportunity Analysis and Forecast for 2026–2035
- Last Updated: 08-Feb-2026 | | Report ID: AA0322180
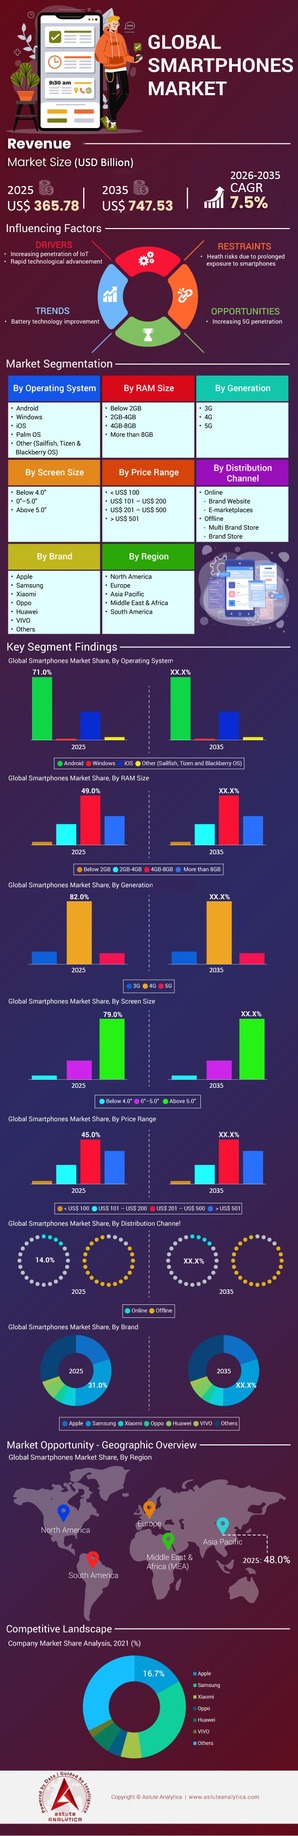
Market Snapshot
Global smartphones market is projected to witness a major leap forward in its revenue from US$ 365.78 billion in 2025 to US$ 747.53 billion by 2035. The market is registering a CAGR of 7.5% over the forecast period 2026-2035.
Key Market Highlights
- By RAM size, Smartphones with 8GB RAM or more captured over 51% of shipments.
- In terms of generation, 4G has the highest share in the Global Smartphones Market.
- By screen size, the above 5.0" segment has the highest market share.
- Based on the price range, the US$ 201 – US$ 500 segment has the highest market share.
- In terms of distribution channels, the offline segment leads the smartphones market.
- Asia Pacific dominates the global smartphones market.
The global smartphones market has officially exited the "User Acquisition Era" (2010–2019) and entered the "Value Extraction Era" (2020–Present). For over a decade, the primary metric for success was unit shipments. Today, relying solely on shipment volume is a vanity metric that obscures the true health of an OEM.
While global smartphone shipments have stabilized around the 1.17 billion to 1.2 billion unit mark as of 2025, representing a distinct plateau from the peak years, global revenue is climbing. This decoupling of volume and value is the defining characteristic of the current market.
The smartphones market is undergoing a fundamental structural change driven by three vectors:
- Collapse of the sub-$200 segment
- Extension of holding periods
- Algorithmic requirement for high-performance silicon to run on-device Generative AI.
To Get more Insights, Request A Free Sample
What are the Critical Strategic Takeaways for Stakeholders in Smartphones Market?
Astute Analytica’s study has identified top 4 strategic pivots for decision-makers requiring an immediate pulse on the market to define the 2025-2026 landscape:
- The "Barbell" Effect: The mid-range market (USD 200–400) is being squeezed. Consumers are either downgrading to high-quality refurbished devices or stretching their budgets to buy premium flagships ($600+) to future-proof their purchase.
- The 5G Hygiene Factor:5G capability is no longer a differentiator; it is a commodity. It has reached >60% penetration in global sell-through. The next marketing battleground is strictly On-Device GenAI.
- The Replacement Cycle Cliff: Global replacement cycles in the smartphones market have hit an all-time high of 43 months (up from 24 months in 2016). OEMs cannot rely on natural churn; they must manufacture obsolescence or offer compelling software incentives (AI features) to trigger upgrades.
- The Rise of the "Third Pole": While Apple and Samsung dominate value, the Transsion Group (Tecno, Infinix, iTel) has effectively locked down the "Next Billion Users" in Africa and South Asia, creating a defensive moat that Chinese competitors (Xiaomi, OPPO, Vivo) are struggling to breach.
Competitive Landscape: Who Really Owns the Smartphones Market—Volume Leaders or Profit Kings?
The competitive landscape is currently bifurcated into two distinct wars: the War for Units and the War for Billions.
The Profitability Gap
While Samsung often leads in quarterly unit shipments (hovering around 19-20% market share), Apple continues to monopolize the smartphones market’s operating profit. Estimates suggest Apple captures nearly 80-85% of global smartphone operating profits, despite holding only ~17-19% of unit market share. This is the "Apple Paradox" that Android OEMs have failed to solve.
The Android "Cluster" in Smartphones Market
- Samsung: Focusing on folding form factors to distinguish itself from the "slab" sea. Their strategy has shifted from flooding the market with J-series (now A-series) to pushing the S-series via aggressive trade-ins.
- Xiaomi: Stuck in a pivot. They are attempting to move up-market (premiumization) with the Xiaomi 14/15 Ultra series, as their low-margin Redmi dominance is under threat from Transsion.
- Transsion Holdings: The silent giant. By focusing exclusively on MEA (Middle East & Africa) and avoiding the hyper-competitive US/Western Europe markets, they have achieved top-5 global status with the lowest ASP (Average Selling Price) but remarkably efficient supply chain logistics.
Economics of Premiumization: Why Are Smartphone ASPs Skyrocketing?
The most critical metric for smartphones market as of 2026 is not shipments, it is ASP (Average Selling Price). Global ASPs have risen consistently, defying inflationary pressures on consumer wallets. Why?
- The "Veblen Good" Effect: Smartphones have become essential status symbols. In markets like India and Southeast Asia, consumers are financing devices costing 3x their monthly salary via "Buy Now, Pay Later" (BNPL) schemes.
- BoM (Bill of Materials) Pass-through: The cost of components (specifically Memory and SoCs) has risen. OEMs have passed these costs to consumers, who have accepted them.
- The Death of the "Flagship Killer": The $400 segment, once dominated by OnePlus and budget Xiaomi devices, has evaporated. Component costs make it almost impossible to offer flagship specs at mid-range prices anymore.
The >$600 wholesale price band now accounts for nearly 25% of total sales volume but over 60% of total revenue. This is where the battle is being fought.
Generative AI: Will On-Device AI Finally Trigger a Replacement Supercycle?
The smartphones market is betting the house on GenAI. However, stakeholders will have to distinguish between Cloud AI (marketing fluff) and On-Device AI (hardware necessity).
The Silicon Requirement
To run Small Language Models (SLMs) like Google’s Gemini Nano or Meta’s Llama locally, devices require NPUs (Neural Processing Units) capable of 10+ TOPS (Trillions of Operations Per Second). This necessitates the latest silicon—Snapdragon 8 Gen 3/4 or MediaTek Dimensity 9300.
The Supercycle Thesis
Historically, supercycles are driven by hardware changes (screen size, 4G to 5G). AI is primarily software. However, because legacy hardware cannot run these models efficiently (resulting in battery drain and latency), GenAI creates a hard hardware floor for the smartphones market.
- Astute Analytica’s Forecast: By end of 2027, "AI-Native" smartphones will capture 40% of shipments.
- Risk: If consumers do not find "killer apps" for AI, this supercycle will fail, leaving OEMs with expensive inventory.
Regional Hotspot Analysis: Is the "Global South" the Last Bastion of Growth in Smartphones Market?
As Western Europe and North America reach saturation (penetration >85%), growth vectors have shifted south and east.
- India: The world's second-largest smartphones market is undergoing rapid "Premiumization." The volume growth is flat, but value growth is double-digit. Apple’s aggressive retail expansion and manufacturing push (Tata Electronics) signal that India is the new China for consumption, not just production.
- Africa (The Transsion Stronghold): Smartphone penetration is still <50% in many regions. In fact, the transition from 2G/3G feature phones to 4G smartphones is the primary volume driver here.
- China: The "Huawei Factor." The resurgence of Huawei with its domestic Kirin 9000s chips has dented iPhone sales significantly. The nationalistic "Guochao" trend is prioritizing domestic brands over foreign ones, complicating Apple’s outlook in its biggest overseas market.
Form Factor Revolution: Are Foldables a Niche Novelty or the Future Standard?
Foldables have survived the "hype cycle" and entered the "early majority" phase in the smartphones market, yet they remain <2% of the total market volume.
The Clamshell vs. Book Dynamic
- Clamshell (Flip): This form factor (e.g., Galaxy Z Flip) is driving adoption due to lower price points ($999 and dropping). It appeals to a fashion-conscious demographic and solves the issue of portability.
- Book-Style (Fold): Remains a productivity niche due to high ASP ($1,600+).
The Durability Barrier
The main inhibitor in the smartphones market remains consumer trust in hinge durability and screen creases. However, as Chinese OEMs (Honor, OPPO) push "millimeter-thin" foldables that rival standard phones in thickness, the ergonomic barrier is vanishing. In line with this, foldables to grow at a robust CAGR of 22% through 2030, outpacing the general market significantly.
The Refurbished Market: Why is the Secondary Market a Threat to Budget OEMs?
This is the "Silent Giant" of the smartphones market. in the last few years, the global market for refurbished smartphones grew 14% YoY, contrasting sharply with new smartphone stagnation.
The Cannibalization Effect
A consumer with $300 today faces a choice—a brand new, low-spec Android device (plastic build, poor camera) or a refurbished iPhone 12/13 (flagship build, excellent camera, iOS ecosystem). Increasing numbers are choosing the latter.
This market trend is devastating for OEMs relying on mid-range volume. The secondary smartphones market is essentially extending the life of premium devices, preventing new sales of lower-tier devices. Apple is the biggest beneficiary of the secondary market, as it locks users into the ecosystem at a lower entry point, monetizing them later via Services (iCloud, App Store).
Supply Chain 2.0: How is the "China Plus One" Strategy Reshaping Manufacturing?
Geopolitical tension is rewriting the supply chain map across the global smartphones market. The era of "Made in China" for the world is transitioning to "Made in China for China" and "Made in India/Vietnam for the World."
- Vietnam: Has become the primary manufacturing hub for Samsung.
- India: Under the PLI (Production Linked Incentive) scheme, India is scaling rapidly. Apple aims to manufacture 25% of all iPhones in India by 2026. This is not just assembly; it is moving toward component manufacturing.
- Risk Mitigation: OEMs are willing to tolerate slightly lower yields and higher initial costs in India/Vietnam to purchase insurance against potential supply chain blackouts in China (due to sanctions or conflict).
Component Analysis: What is Driving the Bill of Materials (BoM) Cost Explosion?
The "invisible hand" dictating smartphones market prices is the BoM. In 2024-2025, BoM costs have risen by roughly 10-15% for flagship devices.
- Memory (DRAM/NAND): After a period of oversupply and rock-bottom prices in 2023, manufacturers like Samsung and SK Hynix cut production, leading to price spikes.
- SoC (System on Chip): The transition to 3nm process nodes (TSMC N3) is expensive. A flagship chipset now costs OEMs between USD 100−160 per unit.
- Displays: The shift from rigid OLED to flexible OLED (even for non-foldables, to shrink bezels) has added cost.
- OEM Response: To protect margins, OEMs are "skimping" on less visible specs (using older camera sensors or slower USB standards) while touting the expensive processor and screen.
Connectivity: Do 5G Saturation Stalling Upgrades, and What About 6G?
5G was a massive sales driver from 2020-2024. Now, it is saturated.
The "Good Enough" Problem: For the average consumer, 5G speeds do not feel significantly different from good 4G LTE for daily tasks (social media, video streaming). This diminishes the urgency to upgrade.
6G Horizon: Discussions on 6G are premature for the consumer smartphones market as commercial deployment is not expected until 2029-2030. 6G will likely focus on integrating satellite communication and ultra-low latency for AR/VR, but it will not drive smartphone sales in the near to medium term.
Operating System Wars: Can HarmonyOS Break the Android-iOS Duopoly?
For a decade, the smartphones market was a duopoly. That is changing in China.
The Rise of HarmonyOS
Huawei’s HarmonyOS has overtaken iOS in market share within China. By creating a unified kernel that runs on phones, cars, and IoT devices, Huawei is building an ecosystem "stickiness" that rivals Apple.
Global Implications
While HarmonyOS is unlikely to threaten Android’s dominance in the West due to lack of Google Mobile Services, its dominance in the China smartphones market forces Android OEMs (Xiaomi, OPPO) to work harder to retain domestic users. This splits their focus and R&D resources.
Distribution Channels: Online vs. Offline—Where is the Modern Consumer Buying?
The distribution landscape of smartphones market is highly regionalized.
- The US Model: dominated by Carriers (Verizon, T-Mobile, AT&T). 90% of sales happen via postpaid contracts. This structure favors high-ASP devices because the cost is hidden in monthly fees.
- The India/SE Asia Model: dominated by Open Market & E-commerce (Amazon, Flipkart). Here, price sensitivity is higher because the consumer sees the full upfront cost.
- The Shift: We are seeing a rise in DTC (Direct-to-Consumer) sales, where OEMs (especially Samsung and Apple) offer exclusive colors or storage variants only on their websites to bypass retailer margins.
Consumer Behavior: Why Have Replacement Cycles Extended to 43+ Months in Global Smartphones Market?
The most terrifying chart for an OEM CEO is the "Average Holding Period."
- Hardware Durability: Gorilla Glass Victus, IP68 water resistance, and better battery health management mean phones physically last longer.
- Software Longevity: In a bid to compete with Apple, Samsung and Google now offer 7 years of OS updates. While this builds brand loyalty, it theoretically destroys future hardware sales volume.
- Lack of Innovation: The "slab" form factor has peaked. An iPhone 13 looks and acts remarkably like an iPhone 15 for 95% of users.
The smartphones market has moved from a "replacement market" to a "discretionary upgrade market."
Segmental Analysis of the Smartphones Market
By RAM, 8GB is the New Minimum
Smartphones equipped with 8GB RAM or more have captured over 51% of global shipments. This metric is not merely spec-sheet inflation, it represents a structural necessity driven by the "Android Tax" and the "AI Threshold."
- The AI Hardware Floor: 8GB is no longer a "flagship" specification, it has become the functional minimum required to run modern on-device AI tasks. To run Small Language Models (SLMs) like Google Gemini Nano or Samsung Galaxy AI locally without severe latency, the operating system reserves nearly 3-4GB of RAM exclusively for the NPU. This has effectively rendered 4GB and 6GB devices obsolete for any "Smart" functionality.
- The Speed Trap (LPDDR4x vs. LPDDR5x): Sophisticated stakeholders must look beyond the capacity label. In the USD 200-300 segment, the smartphones market is saturated with older LPDDR4x RAM. While it reads "8GB" on the box, its data transfer speeds are insufficient for high-fidelity gaming or rapid AI token generation. The "True Premium" segment (>$500) has migrated entirely to LPDDR5x, creating a massive performance bifurcation between an "8GB Budget Phone" and an "8GB Flagship."
- The "Virtual RAM" Deception: A significant driver of this statistical shift is the widespread marketing of "Extended RAM" or "Virtual RAM" (using UFS storage as slow, temporary RAM). OEMs in the budget sector (Realme, Xiaomi, Infinix) frequently market devices as "16GB AI Phones" (8GB Physical + 8GB Virtual). This marketing pressure has forced competitors to standardize 8GB physical RAM just to compete on retail shelf tags, effectively killing the 6GB tier.
By Network, 4G Still Dominate the Installed Base in Smartphones Markets
In terms of active usage (Installed Base), 4G retains the highest share of the global smartphones market. There is a critical "Shipment vs. Usage" paradox that misleads many investors. While 5G devices overtook 4G in new shipments in late 2023, 4G remains the "Volume King" of active users due to economic friction.
- The "Long Tail" of Obsolescence: 4G dominates the installed base because global replacement cycles have lengthened to nearly 43 months. Billions of users in Tier-2 regions of India, LATAM, and Africa are still utilizing 4G devices purchased in 2022-2023. They have no incentive to upgrade because 5G consumer use-cases (beyond speed tests) remain scarce.
- The USD 150 BoM Barrier: In the entry−level shipment market (Sub−USD 150), 4G remains a manufacturing necessity. A 5G modem adds a roughly USD 10–15 "5G Tax" to the Bill of Materials (BoM). In a $90 device, this cost is prohibitive. Consequently, OEMs like Transsion (Tecno/Infinix) and Xiaomi (Redmi A-series) continue to manufacture 4G-only SKUs to serve the "Next Billion Users" who prioritize battery life and screen size over connectivity speeds they cannot afford.
5G is the Revenue King (dominating value), but 4G remains the Utility King (dominating volume) for the Global South.
By Screen Size: Compact Phone" Officially Dead as Above 5.0 inches Segment Controlling the Dominance
The smartphones market has consolidated around screen sizes "Above 5.0 inches." Using "Above 5.0 inches" as a metric is analytically obsolete. The market has not just grown, it has standardized into a tight corridor between 6.1 inches and 6.7 inches.
- The 6.7-Inch Standard: The consumer market has aggressively rejected sub-6-inch devices (evidenced by the cancellation of the iPhone Mini and poor sales of the Zenfone 9/10). The segment is now bifurcated: "Standard" (6.1"–6.36") for base models and "Max/Ultra" (6.7"–6.8") for power users. The 6.7-inch segment is the fastest-growing volume driver as the smartphone becomes the primary television for Gen Z.
- Aspect Ratio Economics: The dominance of large screens is enabled by the shift to 20:9 aspect ratios. A modern 6.7-inch device is physically narrower and easier to grip than a 5.5-inch phone from 2017 due to the elimination of bezels.
- The Refresh Rate Battle: In this segment, the competitive differentiator is no longer size, but Hertz. Over 70% of shipments in this size bracket now feature 90Hz or 120Hz High Refresh Rate (HRR) panels. A 60Hz display is now classified as "e-waste" by consumers, even in the sub-$200 bracket, forcing supply chains to dump older LCD inventory in emerging markets.
By Price Band, the USD 200–500 Leads the Smartphones Market
The USD 201–500 price segment captures the highest volume market share globally. It is known as the "Mass Mid-Range," which captures approximately 40–42% of global volume, but it represents a "Profit Desert" for manufacturers.
- The "Flagship Killer" Effect: This segment thrives because the "Good Enough" barrier has been breached. Devices like the Samsung Galaxy A55, Redmi Note 13 Pro, and Pixel 'a' Series offer 90% of the flagship experience (OLED screens, OIS cameras, 65W charging) at 40% of the price. This has cannibalized the lower end of the premium market.
- Inflationary Migration: The growth of this segment in the smartphones market is partly artificial. Three years ago, the volume driver was the USD 100–200 bracket. However, component inflation, currency depreciation (in markets like India and Nigeria), and logistics costs have pushed those same devices into the $201+ bracket. Consumers are paying more for the same specs, statistically inflating the mid-range share.
- The Margin Squeeze: While this segment moves the most units, it operates on razor-thin margins (<5% net margin for Chinese OEMs). Only Samsung (due to vertical integration of memory/screens) and Apple (selling older iPhone 13/14 models) generate meaningful operating profit here. For others, it is strictly a market-share defense play.
Customize This Report + Validate with an Expert
Access only the sections you need—region-specific, company-level, or by use-case.
Includes a free consultation with a domain expert to help guide your decision.
Regional Analysis
Asia Pacific: Is India Replacing China as the Global Volume Growth Engine?
China: The "Guochao" Resurgence and the Apple Squeeze
The Chinese smartphones market has fundamentally changed. The "Guochao" (nationalist trend) is not a fad. It is a permanent consumer pivot.
The Huawei Renaissance: The return of Huawei to the 5G flagship space (with the Mate 70/80 series) has done irreparable damage to Apple’s dominance in the $800+ segment. We are seeing a "Patriot Premium" where Chinese consumers effectively choose domestic harmony over the iOS ecosystem.
Foldable Adoption: While the West treats foldables as a novelty, in China, they are rapidly becoming the standard for the executive class. One in four "Ultra-Premium" devices sold in Shanghai and Beijing is now a foldable, driving local ASPs significantly higher than global averages.
India: The "Premiumization" Trap
India is no longer just a dumping ground for sub-$100 inventory.
- The BNPL Revolution: The most accurate metric for India right now is not GDP per capita, but Credit Availability. The explosion of "No-Cost EMI" and "Buy Now, Pay Later" schemes offered by various vendors such as Bajaj Finance has allowed a consumer earning $300 a month to purchase a $500 Samsung Galaxy A-series or a discounted iPhone 15.
- The Manufacturing Pivot: With Apple (via Tata Electronics) and Google (via Foxconn) establishing massive local production, the "Made in India" label is stabilizing supply chains. However, the mass market (sub-$150) is shrinking in volume as feature phone users struggle to bridge the inflationary gap to buy their first smartphone, causing a "bottom-heavy" stagnation.
Southeast Asia (ASEAN): The Transsion Moat
In Indonesia, Philippines, and Thailand smartphones market, the BBK Group (OPPO/Vivo) is facing a violent assault from the Transsion Group (Infinix/Tecno). Transsion has successfully replicated its African strategy here: offering "Gaming" specs (high RAM, fast screens) at razor-thin margins, effectively commoditizing the mid-range and forcing legacy players to retreat up-market.
North America: Is the Carrier "Walled Garden" Masking a Demand Crisis?
The Illusion of Health via Subsidies
On paper, North America (specifically the US) shows robust revenue resilience. In reality, the smartphones market is on life support provided by the "Big Three" carriers (Verizon, T-Mobile, AT&T).
- The 36-Month Handcuff: The standard replacement cycle in the US hasn't lengthened naturally, it was forced by carriers shifting from 24-month to 36-month financing contracts. This hides the true cost of $1,200 flagships from consumers. If carriers were to pull back these subsidies, the US market volume would likely contract by 15-20% overnight.
- Churn Rates at Historic Lows: Because of these long contracts, carrier churn is near zero. This makes it nearly impossible for challenger brands (Motorola, OnePlus, Google Pixel) to gain share. The market is calcified.
The "Blue Bubble" Monopoly in the US Smartphones Market
The sociological lock-in of iMessage has created an impossible channel among Gen Z and Alpha.
- Demographic Destiny: Over 87% of US teenagers own an iPhone. As this cohort enters the workforce and gains purchasing power, the addressable market for Android is mathematically shrinking. Samsung remains the only viable alternative for the older demographic, but they are fighting a defensive war.
- The Prepaid Collapse: The prepaid market (Boost, Metro, Cricket), traditionally a stronghold for budget Androids, is collapsing as users migrate to postpaid plans to get "free" older iPhones. This is effectively wiping out the sub-$200 market in the US.
Europe: Are Regulatory Headwinds Creating the World’s First "Post-Growth" Smartphones Market?
The "Brussels Effect" on Hardware
Europe has become the global regulator for smartphone design, creating a unique friction that does not exist elsewhere.
The Battery Regulation Impact: The EU mandate requiring user-replaceable batteries (phasing in by 2027) is forcing OEMs to redesign chassis architectures. This is currently slowing down form-factor innovation in the region as R&D spend is diverted to compliance rather than new features.
DMA and the App Store Open: The Digital Markets Act (DMA) has forced Apple to open its ecosystem (sideloading). While analysts predicted a boom for third-party stores, consumer behavior remains sticky. The real impact on the regional smartphones market is the erosion of Services revenue for platforms, not hardware sales.
Top Companies in the Smartphone Market
- Apple Inc.
- ASUSTeK Computer Inc.
- Fairphone B.V.
- Google LLC
- HMD Global Oy
- Honor Device Co., Ltd.
- Huawei Technologies Co., Ltd
- Kyocera Corporation
- Motorola Mobility LLC
- Nothing Technology Ltd
- OPPO
- Realme Chongqing Mobile Telecommunications Corp., Ltd.
- Samsung Electronics Co. Ltd
- Sharp Corporation
- Sony Corp.
- TCL Technology (Group) Co. Ltd
- Transsion Holdings Co., Ltd.
- Vivo Communication Technology Co., Ltd.
- Xiaomi Corporation
- ZTE Corp.
- Other Prominent Players
Market Segmentation Overview
By Operating System
- Android
- Windows
- iOS
- Palm OS
- Other (Sailfish, Tizen, and Blackberry OS)
By RAM Size
- Below 2GB
- 2GB-4GB
- 4GB-8GB
- More than 8GB
By Generation
- 3G
- 4G
- 5G
By Screen Size
- Below 4.0"
- 0"–5.0"
- Above 5.0"
By Price Range
- < US$ 100
- US$ 101 – US$ 200
- US$ 201 – US$ 500
- > US$ 501
By Distribution Channel
- Online
- Brand Website
- E-marketplaces
- Offline
- Multi Brand Store
- Brand Store
By Region:
- North America
- The U.S.
- Canada
- Mexico
- Europe
- Western Europe
- The UK
- Germany
- France
- Italy
- Spain
- Rest of Western Europe
- Eastern Europe
- Poland
- Russia
- Rest of Eastern Europe
- Western Europe
- Asia Pacific
- China
- India
- Japan
- Australia & New Zealand
- South Korea
- ASEAN
- Rest of Asia Pacific
- ASEAN
- Indonesia
- Malaysia
- Philippines
- Thailand
- Vietnam
- Singapore
- Cambodia
- Rest of ASEAN
- Middle East & Africa (MEA)
- Saudi Arabia
- South Africa
- UAE
- Rest of MEA
- South America
- Argentina
- Brazil
- Rest of South America
REPORT SCOPE
| Report Attribute | Details |
|---|---|
| Market Size Value in 2025 | US$ 365.78 Bn |
| Expected Revenue in 2035 | US$ 747.53 Bn |
| Historic Data | 2020-2024 |
| Base Year | 2025 |
| Forecast Period | 2026-2035 |
| Unit | Value (USD Bn) |
| CAGR | 7.5% |
| Segments covered | By Operating System, RAM Size, Generation, Screen Size, Price Range, Distribution Channel and Region |
| Leading players | Apple Inc., ASUSTeK Computer Inc., Fairphone B.V., Google LLC, HMD Global Oy, Honor Device Co., Ltd., Huawei Technologies Co., Ltd, Kyocera Corporation, Motorola Mobility LLC, Nothing Technology Ltd, OPPO, Realme Chongqing Mobile Telecommunications Corp., Ltd., Samsung Electronics Co. Ltd, Sharp Corporation, Sony Corp., TCL Technology (Group) Co. Ltd, Transsion Holdings Co., Ltd., Vivo Communication Technology Co., Ltd., Xiaomi Corporation, ZTE Corp., Other Prominent Players |
| Customization Scope | Get your customized report as per your preference. Ask for customization |
FREQUENTLY ASKED QUESTIONS
Revenue leaps from US$ 365.78 billion in 2025 to US$747.53 billion by 2035 at a CAGR of 7.5%, driven by premiumization and on-device GenAI, despite flat shipments around 1.2B units.
ASPs are skyrocketing as the sub-$200 segment collapses; >$600 band now drives 25% volume but 60% revenue. Apple captures 80-85% of profits despite 17-19% share, squeezing Android mid-range margins.
Yes—requires 8GB+ RAM and 10+ TOPS NPUs (e.g., Snapdragon 8 Gen 4), rendering legacy hardware obsolete. Forecast: AI-native phones hit 40% shipments by 2027, but needs killer apps to avoid inventory risk.
Embrace the barbell (refurbished low-end vs. $600+ flagships); treat 5G as commodity, push GenAI; combat 43-month cycles with AI incentives; counter Transsion's moat in Africa/South Asia.
Shifting to India (25% iPhones by 2026 via PLI) and Vietnam (Samsung hub) for risk mitigation. BoM costs up 10-15% from 3nm SoCs, memory spikes, flex OLED—OEMs pass-through via premium pricing.
India (double-digit value via BNPL, premiumization); Africa (Transsion-led <50% penetration); China (Huawei's HarmonyOS resurgence). Mature West faces saturation, carrier subsidies hiding demand weakness.
LOOKING FOR COMPREHENSIVE MARKET KNOWLEDGE? ENGAGE OUR EXPERT SPECIALISTS.
SPEAK TO AN ANALYST
.svg)


Features | Type of License | ||||
Data Book | Single User |   Multi User | Corporate | ||
| e-Access | ✓ | ✓ | ✓ | ✓ | |
User Sharing | 1 User Only | 1 User Only | Up to 7 Users | Unlimited User Access | |
⨉ | ⨉ | ⨉ | ✓ | ||
Free Customization | No Free Customization | Up To 30 hrs work | Up To 60 hrs work | Up To 80 hrs work | |
Deliverable |
| ⨉ | ✓ | ✓ | ✓ |
| ✓ | ⨉ | ✓ | ✓ | |
| ⨉ | ⨉ | ⨉ | ✓ | |
Analyst Support | 2-Months Analyst Support | 4-Months Analyst Support | 7-Months Analyst Support | One Year Analyst Support | |
Free Report update in next update cycle | ⨉ | ⨉ | ⨉ | ✓ | |
Free Industry Update (Within 180 days) | ⨉ | ⨉ | ⨉ | ✓ | |
Benefit | Up to 10% off on Post Purchase | Up to 20% off on Post Purchase | Up to 30% off on Post Purchase | Up to 40% off on Post Purchase | |