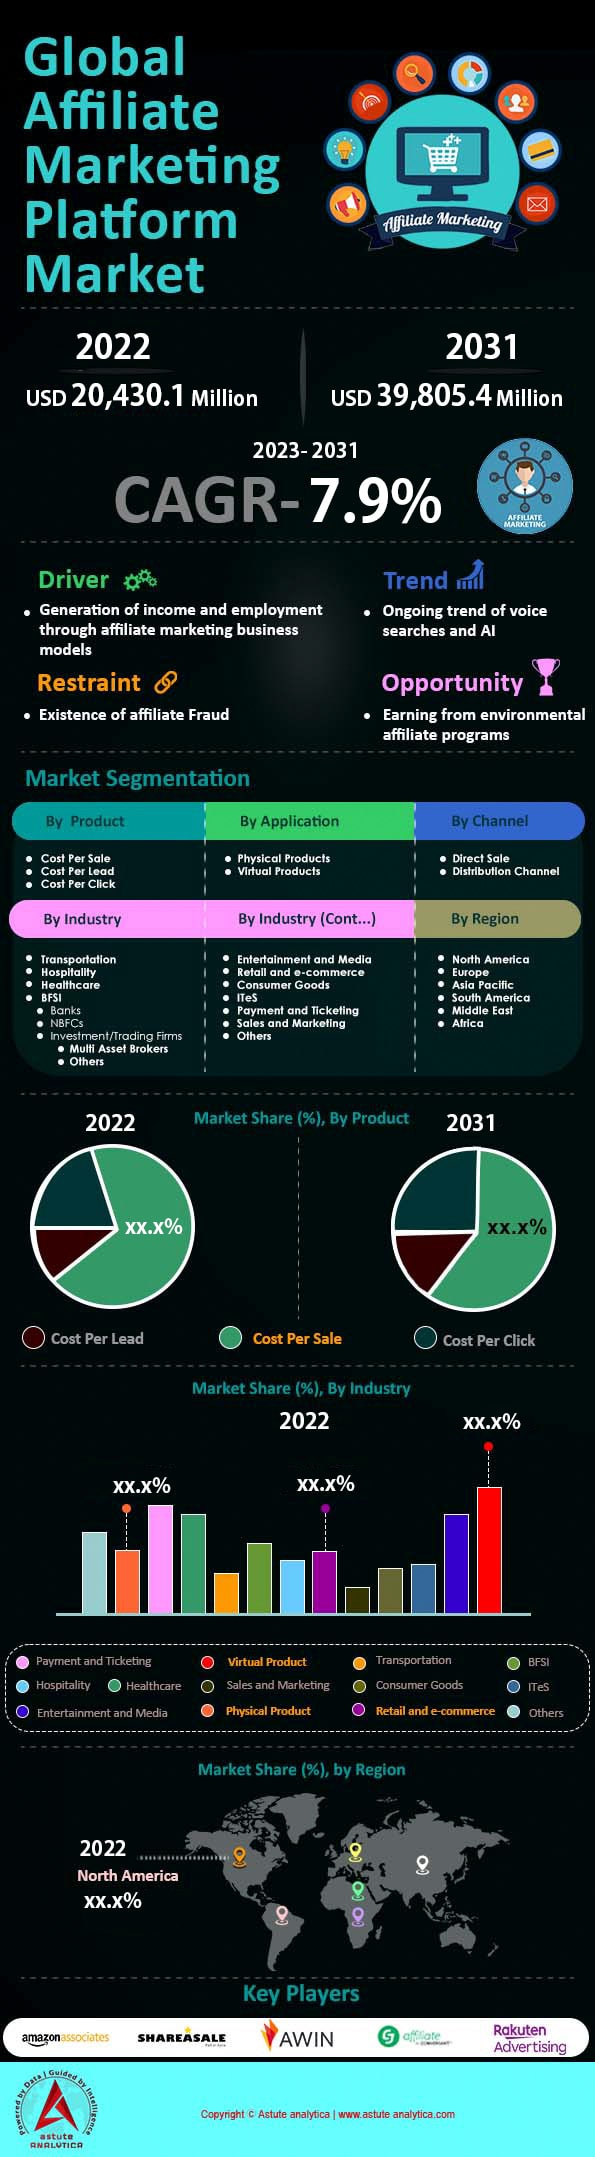
Globaler Markt für Affiliate-Marketing-Plattformen: Nach Produkt (Kosten pro Verkauf, Kosten pro Lead und Kosten pro Klick); Anwendung (physische und virtuelle Produkte); Branche (Transport, Gastgewerbe, Gesundheitswesen, Banken, Finanzdienstleistungen und Versicherungen, Unterhaltung und Medien, Einzelhandel und E-Commerce, Konsumgüter, IT-Dienstleistungen, Zahlungsverkehr und Ticketing, Vertrieb und Marketing sowie Sonstige); Kanal (Direktvertrieb und Vertriebskanal); und Region – Branchendynamik, Marktgröße und Wachstumsprognose bis 2031
- Letzte Aktualisierung: 15. Februar 2023 | | Bericht-ID: AA0522229
Tabelle 1: Branchenausblick: Wachstum der weltweiten Werbeausgaben (jährliches Wachstum in %)
Tabelle 2: Weltweiter Markt für Affiliate-Marketing-Plattformen (Mio. US$), nach Produkt, 2018–2031
Tabelle 3: Weltweiter Markt für Affiliate-Marketing-Plattformen (Mio. US$), nach Anwendung, 2018–2031
Tabelle 4: Weltweiter Markt für Affiliate-Marketing-Plattformen (Mio. US$), nach Branche, 2018–2031
Tabelle 5: Weltweiter Markt für Affiliate-Marketing-Plattformen (Mio. US$), nach Kanal, 2018–2031
Tabelle 6: Weltweiter Markt für Affiliate-Marketing-Plattformen (Mio. US$), nach Region, 2018–2031
Tabelle 7: Marktgröße für Affiliate-Marketing-Plattformen in Nordamerika (Mio. US$), nach Land, 2018–2031
Tabelle 8: Marktgröße für Affiliate-Marketing-Plattformen in Nordamerika (Mio. US$), nach Produkt, 2018–2031
Tabelle 9: Marktgröße für Affiliate-Marketing-Plattformen in Nordamerika (Mio. US$)
Tabelle 10: Marktgröße für Affiliate-Marketing-Plattformen in Nordamerika (Mio. US$
Tabelle 11: Marktgröße für Affiliate-Marketing-Plattformen in Nordamerika (Mio. US$), nach Kanal, 2018–2031
Tabelle 12: Marktgröße für Affiliate-Marketing-Plattformen in Europa (Mio. US$), nach Land, 2018–2031
Tabelle 13: Marktgröße für Affiliate-Marketing-Plattformen in Europa (Mio. US$), nach Produkt, 2018–2031
Tabelle 14: Marktgröße für Affiliate-Marketing-Plattformen in Europa (Mio. US$), nach Anwendung, 2018–2031
Tabelle 15: Marktgröße für Affiliate-Marketing-Plattformen in Europa (Mio. US$), nach Branche, 2018–2031
Tabelle 16: Marktgröße für Affiliate-Marketing-Plattformen in Europa (Mio. US$), nach Kanal, 2018–2031
Tabelle 17: Marktgröße für Affiliate-Marketing-Plattformen im asiatisch-pazifischen Raum (Mio. US$)
Tabelle 18: Marktgröße für Affiliate-Marketing-Plattformen im asiatisch-pazifischen Raum (Mio. US$), nach Produkt, 2018–2031
19: Marktgröße für Affiliate-Marketing-Plattformen im asiatisch-pazifischen Raum (Mio. US$), nach Anwendung, 2018–2031
Tabelle 20: Marktgröße für Affiliate-Marketing-Plattformen im asiatisch-pazifischen Raum (Mio. US$), nach Branche, 2018–2031
Tabelle 21: Marktgröße für Affiliate-Marketing-Plattformen im asiatisch-pazifischen Raum (Mio. US$), nach Kanal, 2018–2031
Tabelle 22: Marktgröße für Affiliate-Marketing-Plattformen im Nahen Osten und Afrika (Mio. US$), nach Land, 2018–2031
Tabelle 23: Marktgröße für Affiliate-Marketing-Plattformen im Nahen Osten und Afrika (Mio. US$), nach Produkt, 2018–2031
Tabelle 24: Marktgröße für Affiliate-Marketing-Plattformen im Nahen Osten und Afrika (Mio. US$), nach Anwendung, 2018–2031
Tabelle 25: Marktgröße für Affiliate-Marketing-Plattformen im Nahen Osten und Afrika (Mio. US$), nach Branche, 2018–2031
Tabelle 26: Marktgröße für Affiliate-Marketing-Plattformen im Nahen Osten und Afrika (Mio. US$), nach Kanal, 2018–2031
Tabelle 27: Marktgröße für Affiliate-Marketing-Plattformen in Südamerika (Mio. US$), nach Land, 2018–2031
Tabelle 28: Marktgröße für Affiliate-Marketing-Plattformen in Südamerika (Mio. US$), nach Produkt, 2018–2031
Tabelle 29: Marktgröße für Affiliate-Marketing-Plattformen in Südamerika (Mio. US$), nach Anwendung, 2018–2031
Tabelle 30: Marktgröße für Affiliate-Marketing-Plattformen in Südamerika (Mio. US$), nach Branche, 2018–2031
Tabelle 31: Marktgröße für Affiliate-Marketing-Plattformen in Südamerika (Mio. US$), nach Kanal, 2018–2031
Tabelle 32: Alibaba: Finanzanalyse
Tabelle 33: Amazon, Inc.: Finanzanalyse
Tabelle 34: eBay Inc.: Finanzanalyse
Tabelle 35: Rakuten Group, Inc.: Finanzanalyse
Tabelle 36: Shopify Inc.: Finanzanalyse
Tabelle 37: Tradedoubler AB: Finanzanalyse
Tabelle 38: TablePlus500CY Limited: Finanzanalyse
Tabelle 39: eToro: Finanzanalyse
Tabelle 40: Saxo Bank A/S: Finanzanalyse
Tabelle 41: XTB SA: Finanzanalyse
Abbildung 1: Zusammenfassung: Globaler Markt für Affiliate-Marketing-Plattformen nach Umsatz (Mio. US$), 2018–2031
Abbildung 2: Nutzungsanalyse: Globaler Markt für Affiliate-Marketing-Plattformen nach Umsatz (Mio. US$), 2018–2031
Abbildung 3: Nutzungsanalyse: Bevorzugte Plattformen nach Anwendung
Abbildung 4: Branchenausblick: Länder nach Anteil der gesamten Werbeausgaben im Jahr 2022 (%)
Abbildung 5: Branchenausblick: Top 5 Länder nach Wachstumsrate der Werbeausgaben im Jahr 2022 (jährliches Wachstum in %)
Abbildung 6: Marktdynamik und Trends: Treiber – Traffic-Quellen für Affiliate-Marketer, 2022
Abbildung 7: Auswirkungen von Covid-19 und Erholung: Marktgröße des globalen Marktes für Affiliate-Marketing-Plattformen (Mio. US$), Auswirkungen von Covid-19 und Erholung, 2018–2031
Abbildung 8: Produktpreisanalyse: Preisanalyse nach Produkt, nach Unternehmen, Durchschnittspreis (in US$)
Abbildung 9: Wettbewerbsübersicht: Marktanteilsanalyse nach Unternehmen, basierend auf dem Umsatz (2022)
Abbildung 10: Wettbewerbsübersicht: Marktanteilsanalyse von Multi-Asset-Broker-Unternehmen basierend auf dem Umsatz (2022)
Abbildung 11: Wettbewerbsübersicht (Vergleich): Marktanteil von Multi-Asset-Broker-Unternehmen basierend auf dem Umsatz (2018)
Abbildung 12: Wettbewerbsübersicht (Vergleich): Marktanteil von Multi-Asset-Broker-Unternehmen basierend auf dem Umsatz (2019)
Abbildung 13: Wettbewerbsübersicht (Vergleich): Marktanteil von Multi-Asset-Broker-Unternehmen basierend auf dem Umsatz (2020)
Abbildung 14: Globaler Markt für Affiliate-Marketing-Plattformen nach Produkt, CAGR (%), 2023–2031
Abbildung 15: Globaler Marktanteil für Affiliate-Marketing-Plattformen (%), nach Produkt, 2022
Abbildung 16: Globaler Marktanteil für Affiliate-Marketing-Plattformen (%), nach Produkt, 2031
Abbildung 17: Globaler Markt für Affiliate-Marketing-Plattformen nach Anwendung, CAGR (%), 2023–2031
Abbildung 18: Globaler Marktanteil für Affiliate-Marketing-Plattformen (%), nach Anwendung, 2022
Abbildung 19: Globaler Affiliate-Markt Marktanteile von Marketingplattformen (%), nach Anwendung, 2031
Abbildung 20: Weltweiter Markt für Affiliate-Marketing-Plattformen, nach Branche, CAGR (%), 2023–2031
Abbildung 21: Weltweiter Marktanteil von Affiliate-Marketing-Plattformen (%), nach Branche, 2022
Abbildung 22: Weltweiter Marktanteil von Affiliate-Marketing-Plattformen (%), nach Branche, 2031
Abbildung 23: Weltweiter Markt für Affiliate-Marketing-Plattformen, nach Kanal, CAGR (%), 2023–2031
Abbildung 24: Weltweiter Marktanteil von Affiliate-Marketing-Plattformen (%), nach Kanal, 2022
Abbildung 25: Weltweiter Marktanteil von Affiliate-Marketing-Plattformen (%), nach Kanal, 2031
Abbildung 26: Weltweiter Markt für Affiliate-Marketing-Plattformen, nach Region, CAGR (%), 2023–2031
Abbildung 27: Weltweiter Marktanteil von Affiliate-Marketing-Plattformen (%), nach Region, 2022
Abbildung 28: Weltweiter Marktanteil von Affiliate-Marketing-Plattformen (%), nach Region, 2031
Abbildung 29: Überblick über den nordamerikanischen Markt für Affiliate-Marketing-Plattformen: Segment mit dem höchsten Anteil (%)
Abbildung 30: Marktübersicht Affiliate-Marketing-Plattformen in Nordamerika: Nettopotenzial Abbildung
31: Wichtigste Erkenntnisse – Segmentwachstum und Marktanteil: Potenzialanalyse nach Produkt
Abbildung 32: Wichtigste Erkenntnisse – Segmentwachstum und Marktanteil: Potenzialanalyse nach Kanal
Abbildung 33: Wichtigste Erkenntnisse – Segmentwachstum und Marktanteil: Potenzialanalyse nach Anwendung
Abbildung 34: Wichtigste Erkenntnisse – Segmentwachstum und Marktanteil: Potenzialanalyse nach Branche
Abbildung 35: Marktanteile der Affiliate-Marketing-Plattformen in Nordamerika (%), nach Land, 2022
Abbildung 36: Marktanteile der Affiliate-Marketing-Plattformen in Nordamerika (%), nach Land, 2031
Abbildung 37: Marktanteile der Affiliate-Marketing-Plattformen in Nordamerika (%), nach Produkt, 2022
Abbildung 38: Marktanteile der Affiliate-Marketing-Plattformen in Nordamerika (%), nach Produkt, 2031
Abbildung 39: Marktanteile der Affiliate-Marketing-Plattformen in Nordamerika (%), nach Anwendung, 2022
Abbildung 40: Marktanteile der Affiliate-Marketing-Plattformen in Nordamerika (%), nach Anwendung, 2031
Abbildung 41: Marktanteile der Affiliate-Marketing-Plattformen in Nordamerika (%), nach Branche
: Marktanteile von Affiliate-Marketing-Plattformen in Nordamerika (%), nach Branche, 2031
Abbildung 43: Marktanteile von Affiliate-Marketing-Plattformen in Nordamerika (%), nach Kanal, 2022
Abbildung 44: Marktanteile von Affiliate-Marketing-Plattformen in Nordamerika (%), nach Kanal, 2031
Abbildung 45: Marktübersicht Affiliate-Marketing-Plattformen in Europa: Segment mit dem höchsten Anteil (%) Abbildung
46: Marktübersicht Affiliate-Marketing-Plattformen in Europa: Zusätzliches Marktpotenzial Abbildung
47: Wichtigste Erkenntnisse – Segmentwachstum: Potenzialanalyse, nach Produkt
Abbildung 48: Wichtigste Erkenntnisse – Segmentwachstum: Potenzialanalyse, nach Kanal
Abbildung 49: Wichtigste Erkenntnisse – Segmentwachstum: Potenzialanalyse, nach Anwendung
Abbildung 50: Wichtigste Erkenntnisse – Segmentwachstum: Potenzialanalyse, nach Branche
Abbildung 51: Marktanteile von Affiliate-Marketing-Plattformen in Europa (%), nach Land, 2022
Abbildung 52: Marktanteile von Affiliate-Marketing-Plattformen in Europa (%), nach Land, 2031
Abbildung 53: Marktanteile von Affiliate-Marketing-Plattformen in Europa (%), nach Produkt, 2022
Abbildung 54: Marktanteile von Affiliate-Marketing-Plattformen in Europa (%), nach Produkt, 2031;
Abbildung 55: Marktanteile von Affiliate-Marketing-Plattformen in Europa (%), nach Anwendung, 2022;
Abbildung 56: Marktanteile von Affiliate-Marketing-Plattformen
in Europa (%), nach Anwendung, 2031; Abbildung 57: Marktanteile von Affiliate-Marketing-
Plattformen in Europa (%), nach Branche, 2022; Abbildung 58: Marktanteile von Affiliate-Marketing-Plattformen in Europa (%), nach Branche, 2031
; Abbildung 59: Marktanteile von Affiliate-Marketing-Plattformen in Europa (%), nach Kanal, 2022;
Abbildung 60: Marktanteile von Affiliate-Marketing-Plattformen in Europa (%), nach Kanal, 2031
; Abbildung 61: Marktübersicht Affiliate-Marketing-Plattformen im asiatisch-pazifischen Raum: Segment mit dem höchsten Marktanteil (%);
Abbildung 62: Marktübersicht Affiliate-Marketing-Plattformen im asiatisch-pazifischen Raum: Zusätzliches Marktpotenzial;
Abbildung 63: Wichtigste Erkenntnisse – Segmentwachstum: Potenzialanalyse, nach Produkt;
Abbildung 64: Wichtigste Erkenntnisse – Segmentwachstum: Potenzialanalyse, nach Kanal
; Abbildung 65: Wichtigste Erkenntnisse – Segmentwachstum: Potenzialanalyse, nach Anwendung
Abbildung 66: Wichtigste Erkenntnisse – Segmentwachstumsanteil: Chancenbewertung nach Branche
Abbildung 67: Marktanteil der Affiliate-Marketing-Plattformen im asiatisch-pazifischen Raum (%), nach Land, 2022
Abbildung 68: Marktanteil der Affiliate-Marketing-Plattformen im asiatisch-pazifischen Raum (%), nach Land, 2031
Abbildung 69: Marktanteil der Affiliate-Marketing-Plattformen im asiatisch-pazifischen Raum (%), nach Produkt, 2022
Abbildung 70: Marktanteil der Affiliate-Marketing-Plattformen im asiatisch-pazifischen Raum (%), nach Produkt, 2031
Abbildung 71: Marktanteil der Affiliate-Marketing-Plattformen im asiatisch-pazifischen Raum (%), nach Anwendung, 2022
Abbildung 72: Marktanteil der Affiliate-Marketing-Plattformen im asiatisch-pazifischen Raum (%), nach Anwendung, 2031
Abbildung 73: Marktanteil der Affiliate-Marketing-Plattformen im asiatisch-pazifischen Raum (%), nach Branche, 2022
Abbildung 74: Marktanteil der Affiliate-Marketing-Plattformen im asiatisch-pazifischen Raum (%), nach Branche, 2031
Abbildung 75: Marktanteil der Affiliate-Marketing-Plattformen im asiatisch-pazifischen Raum (%), nach Kanal, 2022
Abbildung 76: Marktanteil der Affiliate-Marketing-Plattformen im asiatisch-pazifischen Raum (%), nach Kanal
: Marktübersicht Affiliate-Marketing-Plattformen im Nahen Osten und Afrika: Segment mit dem höchsten Anteil (%)
Abbildung 78: Marktübersicht Affiliate-Marketing-Plattformen im Nahen Osten und Afrika: Zusätzliches Marktpotenzial
Abbildung 79: Wichtigste Erkenntnisse – Segmentwachstum: Potenzialanalyse nach Produkt
Abbildung 80: Wichtigste Erkenntnisse – Segmentwachstum: Potenzialanalyse nach Kanal
Abbildung 81: Wichtigste Erkenntnisse – Segmentwachstum: Potenzialanalyse nach Anwendung
Abbildung 82: Wichtigste Erkenntnisse – Segmentwachstum: Potenzialanalyse nach Branche
Abbildung 83: Marktanteile der Affiliate-Marketing-Plattformen im Nahen Osten und Afrika (%) nach Land, 2022
Abbildung 84: Marktanteile der Affiliate-Marketing-Plattformen im Nahen Osten und Afrika (%) nach Land, 2031
Abbildung 85: Marktanteile der Affiliate-Marketing-Plattformen im Nahen Osten und Afrika (%) nach Produkt, 2022
Abbildung 86: Marktanteile der Affiliate-Marketing-Plattformen im Nahen Osten und Afrika (%) nach Produkt, 2031
Abbildung 87: Marktanteile der Affiliate-Marketing-Plattformen im Nahen Osten und Afrika (%) nach Anwendung
: Marktanteile von Affiliate-Marketing-Plattformen im Nahen Osten und Afrika (%), nach Anwendung, 2031;
Abbildung 89: Marktanteile von Affiliate-Marketing-Plattformen im Nahen Osten und Afrika (%), nach Branche, 2022;
Abbildung 90: Marktanteile von Affiliate-Marketing-Plattformen im Nahen Osten und Afrika (%), nach Branche, 2031;
Abbildung 91: Marktanteile von Affiliate-Marketing-Plattformen im Nahen Osten und Afrika (%), nach Kanal, 2022;
Abbildung 92: Marktanteile von Affiliate-Marketing-Plattformen im Nahen Osten und Afrika (%), nach Kanal, 2031;
Abbildung 93: Marktübersicht Affiliate-Marketing-Plattformen in Südamerika: Segment mit dem höchsten Anteil (%);
Abbildung 94: Marktübersicht Affiliate-Marketing-Plattformen in Südamerika: Zusätzliches
Marktpotenzial; Abbildung 95: Wichtigste Erkenntnisse – Segmentwachstum: Potenzialanalyse, nach Produkt;
Wichtigste Erkenntnisse – Segmentwachstum: Potenzialanalyse, nach Kanal;
Abbildung 97: Wichtigste Erkenntnisse – Segmentwachstum: Potenzialanalyse, nach Anwendung;
Abbildung 98: Wichtigste Erkenntnisse – Segmentwachstum: Potenzialanalyse, nach Branche
Abbildung 99: Marktanteile von Affiliate-Marketing-Plattformen in Südamerika (%), nach Ländern, 2022
Abbildung 100: Marktanteile von Affiliate-Marketing-Plattformen in Südamerika (%), nach Ländern, 2031
Abbildung 101: Marktanteile von Affiliate-Marketing-Plattformen in Südamerika (%), nach Produkten, 2022
Abbildung 102: Marktanteile von Affiliate-Marketing-Plattformen in Südamerika (%), nach Produkten, 2031
Abbildung 103: Marktanteile von Affiliate-Marketing-Plattformen in Südamerika (%), nach Anwendungen, 2022
Abbildung 104: Marktanteile von Affiliate-Marketing-Plattformen in Südamerika (%), nach Anwendungen, 2031
Abbildung 105: Marktanteile von Affiliate-Marketing-Plattformen in Südamerika (%), nach Branchen, 2022
Abbildung 106: Marktanteile von Affiliate-Marketing-Plattformen in Südamerika (%), nach Branchen, 2031
Abbildung 107: Marktanteile von Affiliate-Marketing-Plattformen in Südamerika (%), nach Vertriebskanälen, 2022
Abbildung 108: Marktanteile von Affiliate-Marketing-Plattformen in Südamerika (%), nach Vertriebskanälen, 2031
Abbildung 109: Alibaba: Segmentierung der Geschäftsumsätze
Abbildung 110: Alibaba: Geografische Umsatzsegmentierung, 2022
111: Amazon, Inc.: Finanzanalyse: Geografische Umsatzsegmentierung, 2022
Abbildung 112: eBay Inc.: Geografische Umsatzsegmentierung, 2022
Abbildung 113: Rakuten Group, Inc.: Umsatzsegmentierung nach Geschäftsfeld, 2022
Abbildung 114: Shopify Inc.: Geografische Umsatzsegmentierung, 2022
Abbildung 115: Tradedoubler AB: Umsatzsegmentierung nach Geschäftsfeld, 2022
Abbildung 116: Tradedoubler AB: Geografische Umsatzsegmentierung, 2022
Abbildung 117: TablePlus500CY Limited: Neukunden, 2022, nach Region
Abbildung 118: TablePlus500CY Limited: Umsatz (Mio. USD), 2022, nach Region
Abbildung 119: XTB SA: Umsatzsegmentierung nach Geschäftsfeld, 2022
Abbildung 120: XTB SA: Geografische Umsatzsegmentierung, 2022


Merkmale | Lizenzart | ||||
Datenbuch | Einzelbenutzer |   Mehrere Benutzer | Unternehmen | ||
| E-Zugang | ✓ | ✓ | ✓ | ✓ | |
Benutzerfreigabe | Nur für 1 Benutzer | Nur für 1 Benutzer | Bis zu 7 Benutzer | Unbegrenzter Benutzerzugriff | |
⨉ | ⨉ | ⨉ | ✓ | ||
Kostenlose Anpassung | Keine kostenlose Anpassung | Bis zu 30 Stunden Arbeit | Bis zu 60 Stunden Arbeit | Bis zu 80 Arbeitsstunden | |
Lieferformat |
| ⨉ | ✓ | ✓ | ✓ |
| ✓ | ⨉ | ✓ | ✓ | |
| ⨉ | ⨉ | ⨉ | ✓ | |
Analystenunterstützung | 2 Monate Analystenunterstützung | 4 Monate Analystenunterstützung | 7 Monate Analystenunterstützung | Ein Jahr Analystenbetreuung | |
Kostenloses Bericht-Update im nächsten Aktualisierungszyklus | ⨉ | ⨉ | ⨉ | ✓ | |
Kostenloses Branchen-Update (Innerhalb von 180 Tagen) | ⨉ | ⨉ | ⨉ | ✓ | |
Nutzen | Bis zu 10 % Rabatt nach dem Kauf | Bis zu 20 % Rabatt nach dem Kauf | Bis zu 30 % Rabatt nach dem Kauf | Bis zu 40 % Rabatt nach dem Kauf | |