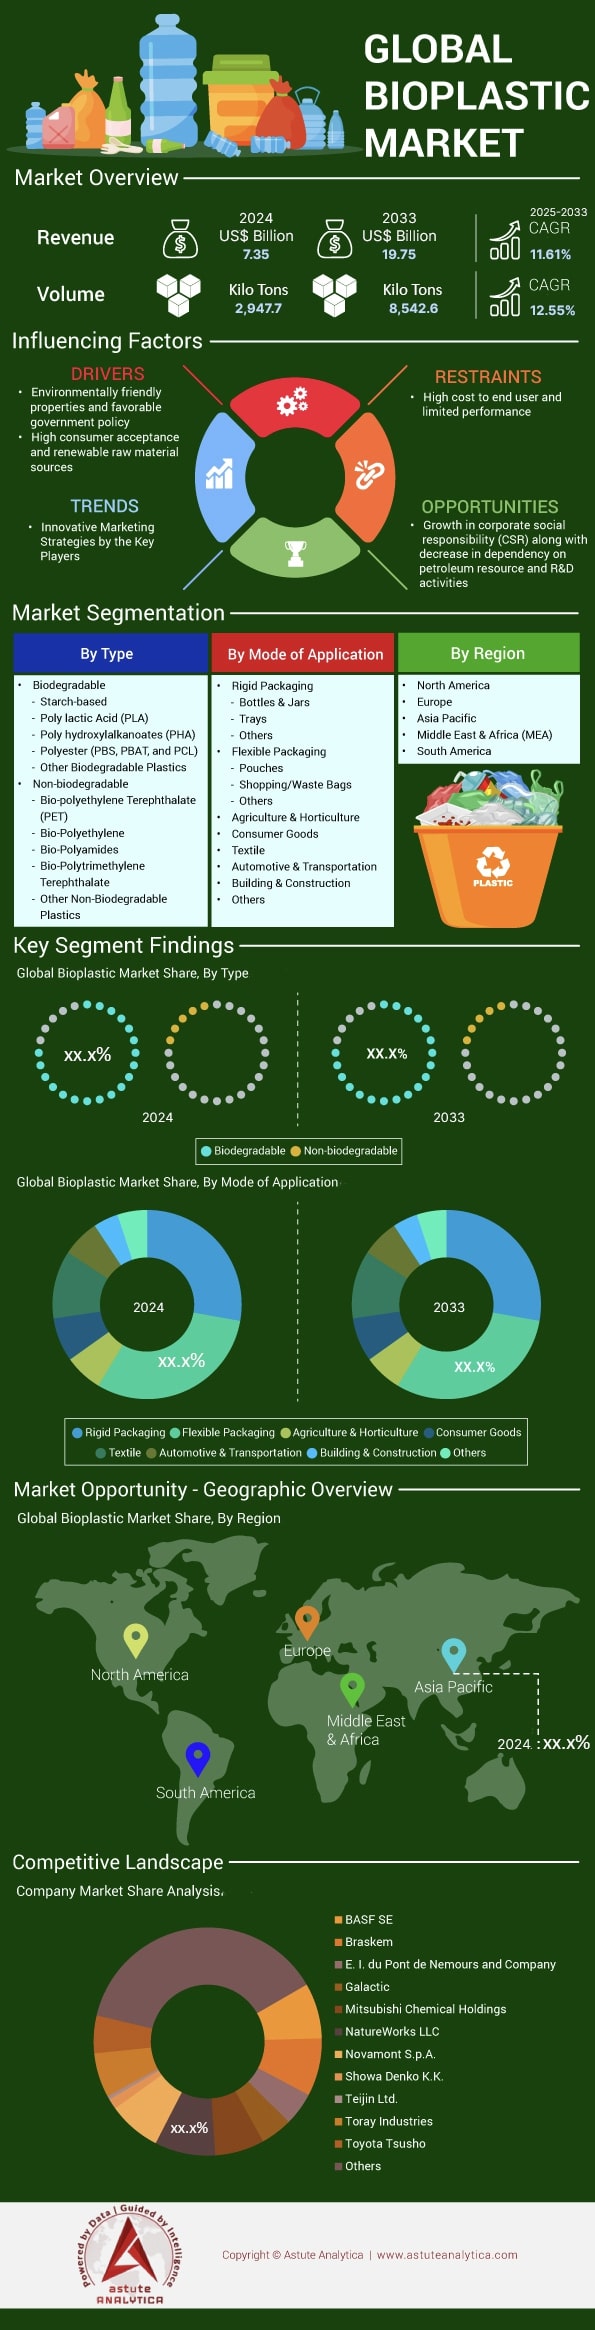
Markt für Biokunststoffe: Nach Typ (biologisch abbaubar und nicht biologisch abbaubar); Anwendungsbereich (starre Verpackungen, flexible Verpackungen, Landwirtschaft und Gartenbau, Konsumgüter, Textilien, Automobil- und Transportwesen, Bauwesen und Sonstiges); Region – Marktgröße, Branchendynamik, Chancenanalyse und Prognose für 2025–2033
- Letzte Aktualisierung: 07. Juli 2025 | | Bericht-ID: AA0322165
Tabelle 1. Weltweiter Markt für Biokunststoffe (Mrd. US$) nach Rohstoff, 2020–2033
Tabelle 2. Weltweiter Markt für Biokunststoffe (Kilotonnen) nach Rohstoff, 2020–2033
Tabelle 3. Weltweiter Markt für Biokunststoffe (Mrd. US$) nach Anwendung, 2020–2033
Tabelle 4. Weltweiter Markt für Biokunststoffe (Kilotonnen) nach Anwendung, 2020–2033
Tabelle 5. Weltweiter Markt für Biokunststoffe (Mrd. US$) nach Region, 2020–2033
Tabelle 6. Weltweiter Markt für Biokunststoffe (Kilotonnen) nach Region, 2020–2033
Tabelle 7. Weltweiter Markt für Biokunststoffe (Mrd. US$) nach Typ, 2020–2033
Tabelle 8. Weltweiter Markt für Biokunststoffe (Kilotonnen) nach Typ, 2020–2033
Tabelle 9. Weltweiter Markt für Biokunststoffe (Mrd. US$)
Tabelle 10. Weltweiter Markt für Biokunststoffe (Kilotonnen
Tabelle 11. Weltweiter Markt für Biokunststoffe (Mrd. US$), nach Region
(Kilotonnen), nach Region, 2020–2033
Tabelle 13. Marktgröße für Biokunststoffe in Nordamerika (Mrd. US$), nach Land, 2020–2033 Tabelle 14.
Marktgröße für Biokunststoffe in Nordamerika (Kilotonnen), nach Land, 2020–2033 Tabelle 15.
Marktgröße für Biokunststoffe in Nordamerika (Mrd. US$), nach Typ, 2020–2033
Tabelle 16. Marktgröße für Biokunststoffe in Nordamerika (Kilotonnen), nach Typ, 2020–2033
Tabelle 17. Marktgröße für Biokunststoffe in Nordamerika (Mrd. US$), nach Anwendungsart
Tabelle 18. Marktgröße für Biokunststoffe in Nordamerika (Kilotonnen) nach
Tabelle 19. Marktgröße für Biokunststoffe in Europa (Mrd. US$) nach Land, 2020–2033
Tabelle 20. Marktgröße für Biokunststoffe in Europa (Kilotonnen) nach Land, 2020–2033
Tabelle 21. Marktgröße für Biokunststoffe in Europa (Mrd. US$) nach Typ, 2020–2033
Tabelle 22. Marktgröße für Biokunststoffe in Europa (Kilotonnen) nach Typ, 2020–2033
Tabelle 23. Marktgröße für Biokunststoffe in Europa (Mrd. US$) nach Anwendungsart, 2020–2033
Tabelle 24. Marktgröße für Biokunststoffe in Europa (Kilotonnen) nach Anwendungsart, 2020–2033
Tabelle 25. Marktgröße für Biokunststoffe im asiatisch-pazifischen Raum (Mrd. US$) nach Land
Tabelle 26. Marktgröße für Biokunststoffe im asiatisch-pazifischen Raum (Kilotonnen), nach Ländern, 2020–2033
27. Marktgröße für Biokunststoffe im asiatisch-pazifischen Raum (Mrd. US$), nach Produkttyp, 2020–2033
Tabelle 28. Marktgröße für Biokunststoffe im asiatisch-pazifischen Raum (Kilotonnen), nach Produkttyp, 2020–2033
Tabelle 29. Marktgröße für Biokunststoffe im asiatisch-pazifischen Raum (Mrd. US$), nach Anwendungsart, 2020–2033
Tabelle 30. Marktgröße für Biokunststoffe im asiatisch-pazifischen Raum (Kilotonnen), nach Anwendungsart, 2020–2033
Tabelle 31. Marktgröße für Biokunststoffe im Nahen Osten (Mrd. US$), nach Ländern, 2020–2033
Tabelle 32. Marktgröße für Biokunststoffe im Nahen Osten (Kilotonnen), nach Ländern, 2020–2033
Tabelle 33. Marktgröße für Biokunststoffe im Nahen Osten (Mrd. US$)
Tabelle 34. Marktgröße für Biokunststoffe im Nahen Osten (Kilotonnen
Tabelle 35. Marktgröße für Biokunststoffe im Nahen Osten (Mrd. US$),
Tabelle 36. Marktgröße für Biokunststoffe im Nahen Osten (Kilotonnen), nach Anwendungsart, 2020–2033
Tabelle 37. Marktgröße für Biokunststoffe in Südamerika (Mrd. US$), nach Land, 2020–2033
Tabelle 38. Marktgröße für Biokunststoffe in Südamerika (Kilotonnen), nach Land, 2020–2033
Tabelle 39. Marktgröße für Biokunststoffe in Südamerika (Mrd. US$), nach Typ, 2020–2033
Tabelle 40. Marktgröße für Biokunststoffe in Südamerika (Kilotonnen), nach Typ, 2020–2033
Tabelle 41. Marktgröße für Biokunststoffe in Südamerika (Mrd. US$), nach Anwendungsart, 2020–2033
Tabelle 42. Marktgröße für Biokunststoffe in Südamerika (Kilotonnen), nach Anwendungsart, 2020–2033
Tabelle 43. Toyota Tsusho Corp.: Finanzanalyse
Tabelle 44. BASF SE.: Finanzanalyse
Tabelle 45. Biome Technologies Plc.: Finanzanalyse
Tabelle 46. Corbion NV: Finanzanalyse
Tabelle 47. Danimer Scientific: Finanzanalyse
Tabelle 48. DuPont: Finanzanalyse
Tabelle 49. Eastman Chemical Company: Finanzanalyse
Tabelle 50. Solvay SA: Finanzanalyse
Tabelle 51. Mitsubishi Chemical Holdings: Finanzanalyse
Tabelle 52. PTT Global Chemical Company Limited: Finanzanalyse
Tabelle 53. Showa Denko KK: Finanzanalyse
Tabelle 54. Teijin Limited: Finanzanalyse
Abbildung 1: Zusammenfassung: Globaler Markt für Biokunststoffe, Umsatz (Mrd. US$) und Volumen (Kilotonnen), 2020–2033 Abbildung 2: Marktanteilsanalyse nach Unternehmen, basierend auf dem Umsatz (2024) Abbildung 3: Marktvolumenprognose (Kilotonnen), 2020–2033 Abbildung 4: Produktpreisanalyse, 2024 (Durchschnittspreis in US$ pro Tonne) Abbildung 5: Umsatzprognose (Mrd. US$), 2020–2033 Abbildung 6: Auswirkungen von COVID-19 auf das Marktwachstum Abbildung 7: Globaler Markt für Biokunststoffe nach Rohmaterial, CAGR (%), 2020–2033 Abbildung 8: Marktanteil des globalen Marktes für Biokunststoffe (%), nach Rohmaterial, 2024 Abbildung 9: Marktanteil des globalen Marktes für Biokunststoffe (%), nach Rohmaterial, 2033 Abbildung 10: Globaler Markt für Biokunststoffe nach Anwendung, CAGR (%), 2020–2033 Abbildung 11: Weltweiter Marktanteil von Biomasse-Kunststoffen (%), nach Anwendung, 2024 Abbildung 12: Weltweiter Marktanteil von Biomasse-Kunststoffen (%), nach Anwendung, 2033 Abbildung 13: Weltweiter Markt für Biomasse-Kunststoffe, nach Region, CAGR (%), 2020–2033 Abbildung 14: Weltweiter Marktanteil von Biomasse-Kunststoffen (%), nach Region, 2024 Abbildung 15: Weltweiter Marktanteil von Biomasse-Kunststoffen (%), nach Region, 2033 Abbildung 16 : Weltweiter Markt für Biokunststoffe, nach Typ, CAGR (%), 2020–2033 Abbildung 17: Weltweiter Marktanteil von Biokunststoffen (%), nach Typ, 2024 Abbildung 18: Weltweiter Marktanteil von Biokunststoffen (%), nach Typ, 2033 Abbildung 19: Weltweiter Markt für Biokunststoffe, nach Anwendungsart, CAGR (%), 2020–2033 Abbildung 20: Weltweiter Marktanteil von Biokunststoffen (%), nach Anwendungsart Anwendung, 2024 Abbildung 21: Weltweiter Marktanteil von Biokunststoffen (%), nach Anwendungsart, 2033 Abbildung 22: Weltweiter Biokunststoffmarkt, nach Region, CAGR (%), 2020–2033 Abbildung 23: Weltweiter Marktanteil von Biokunststoffen (%), nach Region, 2024 Abbildung 24: Weltweiter Marktanteil von Biokunststoffen (%), nach Region, 2033 Abbildung 25: Nordamerikanischer Biokunststoffmarkt: Größtes Marktsegment (%) Abbildung 26: Nordamerikanischer Biokunststoffmarkt: Chancenanalyse, nach Typ, 2020–2033 (Umsatz%) Abbildung 27: Nordamerikanischer Biokunststoffmarkt: Chancenanalyse, nach Anwendungsart, 2020–2033 (Umsatz%) Abbildung 28: Nordamerikanischer Biokunststoffmarkt (%), nach Land, 2024 Abbildung 29: Nordamerikanischer Biokunststoffmarkt (%), nach Land, 2033 Abbildung 30: Nordamerikanischer Biokunststoffmarkt (%), nach Typ, 2024 Abbildung 31: Marktanteil von Biokunststoffen in Nordamerika (%), nach Typ, 2033 Abbildung 32: Marktanteil von Biokunststoffen in Nordamerika (%), nach Anwendungsart, 2024 Abbildung 33: Marktanteil von Biokunststoffen in Nordamerika (%), nach Anwendungsart, 2033 Abbildung 34: Europäischer Biokunststoffmarkt: Größtes Marktsegment (%) Abbildung 35: Europäischer Biokunststoffmarkt: Chancenanalyse, nach Typ, 2020–2033 (Umsatz %) Abbildung 36: Europäischer Biokunststoffmarkt: Chancenanalyse, nach Anwendungsart, 2020–2033 (Umsatz %) Abbildung 37: Marktanteil von Biokunststoffen in Europa (%), nach Land, 2024 Abbildung 38: Marktanteil von Biokunststoffen in Europa (%), nach Land, 2033 Abbildung 39: Marktanteil von Biokunststoffen in Europa (%), nach Typ, 2024 Abbildung 40: Marktanteil von Biokunststoffen in Europa (%), nach Typ Abbildung 41: Marktanteil von Biokunststoffen in Europa (%), nach Anwendungsart, 2024 Abbildung 42: Marktanteil von Biokunststoffen in Europa (%), nach Anwendungsart, 2033 Abbildung 43: Biokunststoffmarkt im asiatisch-pazifischen Raum: Größtes Marktsegment (%) Abbildung 44: Biokunststoffmarkt im asiatisch-pazifischen Raum: Chancenanalyse nach Typ, 2020–2033 (Umsatz%) Abbildung 45: Biokunststoffmarkt im asiatisch-pazifischen Raum: Chancenanalyse nach Anwendungsart, 2020–2033 (Umsatz%) Abbildung 46: Marktanteil von Biokunststoffen im asiatisch-pazifischen Raum (%), nach Land, 2024 Abbildung 47: Marktanteil von Biokunststoffen im asiatisch-pazifischen Raum (%), nach Land, 2033 Abbildung 48: Marktanteil von Biokunststoffen im asiatisch-pazifischen Raum (%), nach Typ, 2024 Abbildung 49: Marktanteil von Biokunststoffen im asiatisch-pazifischen Raum (%), nach Typ, 2033 Abbildung 50: Biokunststoffmarkt im asiatisch-pazifischen Raum Marktanteil (%), nach Anwendungsart, 2024 Abbildung 51: Marktanteil des Biokunststoffmarktes im asiatisch-pazifischen Raum (%), nach Anwendungsart, 2033 Abbildung 52: Biokunststoffmarkt im Nahen Osten und Afrika: Größtes Marktsegment (%) Abbildung 53: Biokunststoffmarkt im Nahen Osten und Afrika: Chancenanalyse nach Typ, 2020–2033 (Umsatz %) Abbildung 54: Biokunststoffmarkt im Nahen Osten und Afrika: Chancenanalyse nach Anwendungsart, 2020–2033 (Umsatz %) Abbildung 55: Marktanteil des Biokunststoffmarktes im Nahen Osten und Afrika (%), nach Land, 2024 Abbildung 56: Marktanteil des Biokunststoffmarktes im Nahen Osten und Afrika (%), nach Land, 2033 Abbildung 57: Marktanteil des Biokunststoffmarktes im Nahen Osten und Afrika (% ), nach Typ, 2024 Abbildung 58: Marktanteil des Biokunststoffmarktes im Nahen Osten und Afrika (%), nach Typ, 2033 Abbildung 59: Marktanteil des Biokunststoffmarktes im Nahen Osten und Afrika Marktanteile von Biokunststoffen in Afrika (%), nach Anwendungsart, 2024 (Abbildung 60): Marktanteile von Biokunststoffen im Nahen Osten und Afrika (%), nach Anwendungsart, 2033 ( Abbildung 61): Biokunststoffmarkt in Südamerika: Größtes Marktsegment (%) (Abbildung 62): Biokunststoffmarkt in Südamerika: Chancenanalyse nach Produkttyp, 2020–2033 (Umsatz in %) ( Abbildung 63): Biokunststoffmarkt in Südamerika: Chancenanalyse nach Anwendungsart, 2020–2033 (Umsatz in %) ( Abbildung 64): Marktanteile von Biokunststoffen in Südamerika (%), nach Ländern, 2024 ( Abbildung 65): Marktanteile von Biokunststoffen in Südamerika (%), nach Ländern, 2033 (Abbildung 66): Marktanteile von Biokunststoffen in Südamerika (%), nach Produkttyp, 2024 (Abbildung 67): Marktanteile von Biokunststoffen in Südamerika (%), nach Produkttyp, 2033 (Abbildung 68): Marktanteile von Biokunststoffen in Südamerika (%), nach Anwendungsart, 2024 Abbildung 69: Marktanteil von Biokunststoffen in Südamerika (%), nach Anwendungsart, 2033 Abbildung 70: Toyota Tsusho Corp.: Umsatzsegmentierung, 2024 Abbildung 71: Toyota Tsusho Corp.: Geografische Umsatzsegmentierung, 2024 Abbildung 72: BASF SE: Umsatzsegmentierung, 2024 Abbildung 73: BASF SE: Geografische Umsatzsegmentierung, 2024 Abbildung 74: Biome Technologies Plc.: Umsatzsegmentierung, 2024 Abbildung 75: Biome Technologies Plc.: Geografische Umsatzsegmentierung, 2024 Abbildung 76: Corbion NV: Umsatzsegmentierung, 2024 Abbildung 77: Corbion NV: Geografische Umsatzsegmentierung, 2024 Abbildung 78: Danimer Scientific: Umsatzsegmentierung, 2024 Abbildung 79: DuPont: Umsatzsegmentierung, 2024 80: DuPont: Geografische Umsatzsegmentierung, 2024 Abbildung 81: Eastman Chemical Company: Umsatzsegmentierung nach Geschäftsbereichen, 2024 Abbildung 82: Eastman Chemical Company: Geografische Umsatzsegmentierung, 2024 Abbildung 83: Solvay SA: Umsatzsegmentierung nach Geschäftsbereichen, 2024 Abbildung 84: Solvay SA: Geografische Umsatzsegmentierung, 2024 Abbildung 85: Mitsubishi Chemical Holdings: Umsatzsegmentierung nach Geschäftsbereichen, 2024 Abbildung 86: PTT Global Chemical Company Limited: Umsatzsegmentierung nach Geschäftsbereichen, 2024 Abbildung 87: PTT Global Chemical Company Limited: Geografische Umsatzsegmentierung, 2024 Abbildung 88: Showa Denko KK: Umsatzsegmentierung nach Geschäftsbereichen, 2024 Abbildung 89: Showa Denko KK: Geografische Umsatzsegmentierung, 2024 Abbildung 90: Teijin Limited: Umsatzsegmentierung nach Geschäftsbereichen, 2024


Merkmale | Lizenzart | ||||
Datenbuch | Einzelbenutzer |   Mehrere Benutzer | Unternehmen | ||
| E-Zugang | ✓ | ✓ | ✓ | ✓ | |
Benutzerfreigabe | Nur für 1 Benutzer | Nur für 1 Benutzer | Bis zu 7 Benutzer | Unbegrenzter Benutzerzugriff | |
⨉ | ⨉ | ⨉ | ✓ | ||
Kostenlose Anpassung | Keine kostenlose Anpassung | Bis zu 30 Stunden Arbeit | Bis zu 60 Stunden Arbeit | Bis zu 80 Arbeitsstunden | |
Lieferformat |
| ⨉ | ✓ | ✓ | ✓ |
| ✓ | ⨉ | ✓ | ✓ | |
| ⨉ | ⨉ | ⨉ | ✓ | |
Analystenunterstützung | 2 Monate Analystenunterstützung | 4 Monate Analystenunterstützung | 7 Monate Analystenunterstützung | Ein Jahr Analystenbetreuung | |
Kostenloses Bericht-Update im nächsten Aktualisierungszyklus | ⨉ | ⨉ | ⨉ | ✓ | |
Kostenloses Branchen-Update (Innerhalb von 180 Tagen) | ⨉ | ⨉ | ⨉ | ✓ | |
Nutzen | Bis zu 10 % Rabatt nach dem Kauf | Bis zu 20 % Rabatt nach dem Kauf | Bis zu 30 % Rabatt nach dem Kauf | Bis zu 40 % Rabatt nach dem Kauf | |