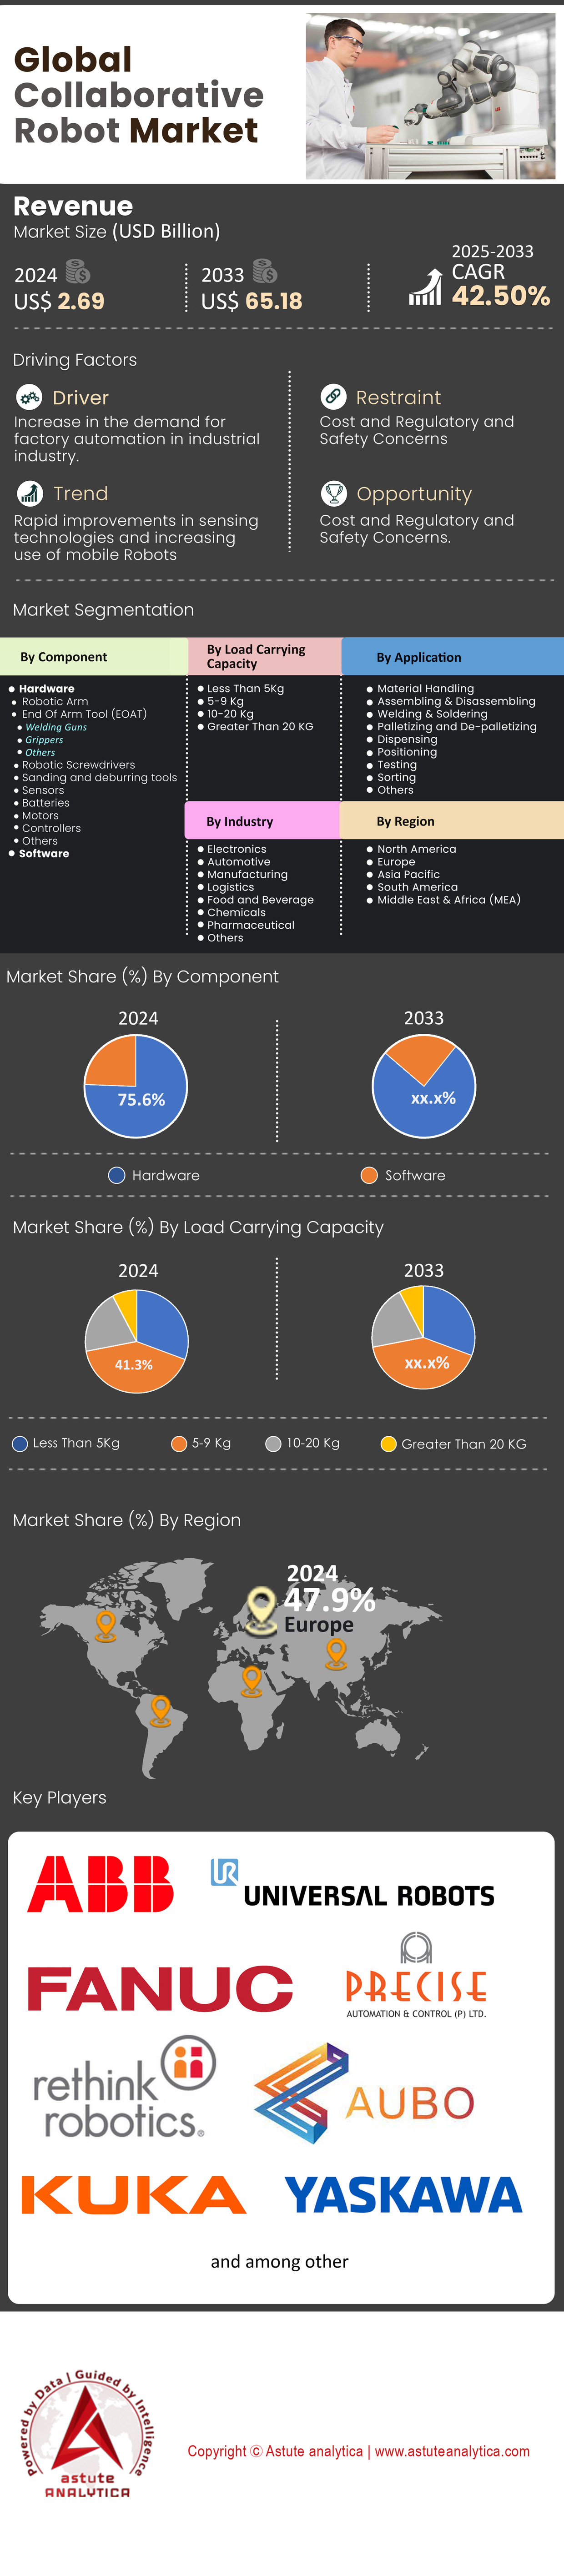
Markt für kollaborative Roboter: Nach Komponenten (Hardware (Roboterarm und End-of-Arm-Werkzeuge (EOAT) (Schweißpistolen, Greifer, Sonstige), Roboterschrauber, Schleif- und Entgratwerkzeuge, Sensoren, Batterien, Motoren, Steuerungen, Sonstige) und Software); Tragfähigkeit (unter 5 kg, 5–9 kg, 10–20 kg und über 20 kg); Anwendung (Materialhandhabung, Montage und Demontage, Schweißen und Löten, Palettieren und Depalettieren, Dosieren, Positionieren, Testen, Sortieren und Sonstige); Branche (Elektronik, Automobilindustrie, Fertigung, Logistik, Lebensmittel und Getränke, Chemie, Pharmaindustrie, Sonstige); Region – Marktgröße, Branchendynamik, Chancenanalyse und Prognose für 2025–2033
- Letzte Aktualisierung: 30. April 2025 | | Bericht-ID: AA1223711
Tabelle 1: Branchenausblick: Führende Start-ups im Bereich kollaborativer Roboter.
Tabelle 2: Branchenausblick: Vergleich verschiedener Arten von Batterien für kollaborative Roboter.
Tabelle 3: Marktdynamik und -trends: Wirkungsanalyse der Marktdynamik.
Tabelle 4: Wettbewerbsübersicht: Kartierung und Benchmarking der Wettbewerber auf dem globalen Markt für
kollaborative Roboter. Tabelle 5: Weltweite Marktgröße für kollaborative Roboter (Mrd. US-Dollar) nach Komponente, 2020–2033.
Tabelle 6: Weltweite Marktgröße für kollaborative Roboter (Einheiten) nach Komponente, 2020–2033.
Tabelle 7: Weltweite Marktgröße für kollaborative Roboter (Mrd. US-Dollar) nach Tragfähigkeit, 2020–2033.
Tabelle 8: Weltweite Marktgröße für kollaborative Roboter (Einheiten) nach Tragfähigkeit, 2020–2033.
Tabelle 9: Weltweite Marktgröße für kollaborative Roboter (Mrd. US-Dollar) nach Anwendung, 2020–2033.
Tabelle 10: Weltweite Marktgröße für kollaborative Roboter (Einheiten) nach Anwendung, 2020–2033.
Tabelle 11: Global Marktgröße für kollaborative Roboter (Mrd. US$), nach Branche, 2020–2033
Tabelle 12: Weltweite Marktgröße für kollaborative Roboter (Einheiten), nach Branche, 2020–2033
Tabelle 13: Weltweite Marktgröße für kollaborative Roboter (Mrd. US$), nach Region, 2020–2033
Tabelle 14: Weltweite Marktgröße für kollaborative Roboter (Einheiten), nach Region, 2020–2033
Tabelle 15: Marktgröße für kollaborative Roboter in Europa (Mrd. US$), nach Land, 2020–2033
Tabelle 16: Marktgröße für kollaborative Roboter in Europa (Einheiten), nach Land, 2020–2033
Tabelle 17: Marktgröße für kollaborative Roboter in Europa (Mrd. US$), nach Komponente, 2020–2033
Tabelle 18: Marktgröße für kollaborative Roboter in Europa (Einheiten), nach Komponente, 2020–2033
Tabelle 19: Marktgröße für kollaborative Roboter in Europa (Mrd. US$), nach Tragfähigkeit20
: Marktgröße für kollaborative Roboter in Europa (Stück), nach Tragfähigkeit, 2020–2033;
Tabelle 21: Marktgröße für kollaborative Roboter in Europa (Mrd. US$), nach Anwendung, 2020–2033;
Tabelle 22: Marktgröße für kollaborative Roboter in Europa (Stück), nach Anwendung, 2020–2033;
Tabelle 23: Marktgröße für kollaborative Roboter in Europa (Mrd. US$), nach Branche, 2020–2033;
Tabelle 24: Marktgröße für kollaborative Roboter in Europa (Stück), nach Branche, 2020–2033;
25: Marktgröße für kollaborative Roboter in Deutschland (Mrd. US$), nach Komponente, 2020–2033;
Tabelle 26: Marktgröße für kollaborative Roboter in Deutschland (Stück), nach Komponente, 2020–2033;
Tabelle 27: Marktgröße für kollaborative Roboter in Deutschland (Mrd. US$), nach Tragfähigkeit, 2020–2033
Tabelle 28: Marktgröße für kollaborative Roboter in Deutschland (Stück), nach Tragfähigkeit, 2020–2033;
Tabelle 29: Marktgröße für kollaborative Roboter in Deutschland (Mrd. US$), nach Anwendung, 2020–2033;
Tabelle 30: Marktgröße für kollaborative Roboter in Deutschland (Stück), nach Anwendung, 2020–2033;
Tabelle 31: Marktgröße für kollaborative Roboter in Deutschland (Mrd. US$), nach Branche, 2020–2033;
Tabelle 32: Marktgröße für kollaborative Roboter in Deutschland (Stück), nach Branche, 2020–2033;
Tabelle 33: ABB Ltd.: Aktuelle Entwicklungen
; Tabelle 34: ABB Ltd.: Produkte;
Tabelle 35: ABB Ltd.: Finanzanalyse;
Tabelle 36: AUBO Robotics Inc.: Aktuelle Entwicklungen;
Tabelle 37: AUBO Robotics Inc.: Produkte
; Tabelle 38: Comau: Aktuelle Entwicklungen
; Tabelle 39: Comau: Produkte;
Tabelle 40: DENSO Robotics: Aktuelle Entwicklungen
; Tabelle 41: DENSO Robotics: Produkte
Tabelle 42: DENSO Robotics (DENSO Corporation): Finanzanalyse
Tabelle 43: EPSON Robots: Aktuelle Entwicklungen
Tabelle 44: EPSON Robots: Produkt
Tabelle 45: EPSON Robots (Epson Group): Finanzanalyse
Tabelle 46: F&P Robotics: Aktuelle Entwicklungen
Tabelle 47: F&P Robotics: Produkt
Tabelle 48: Fanuc Corporation: Aktuelle Entwicklungen
Tabelle 49: Fanuc Corporation: Produkt
Tabelle 50: Fanuc Corporation: Finanzanalyse
Tabelle 51: Franka Emika GmbH: Aktuelle Entwicklungen
Tabelle 52: Franka Emika GmbH: Produkt
Tabelle 53: KUKA AG: Aktuelle Entwicklungen
Tabelle 54: KUKA AG: Produkt
Tabelle 55: KUKA AG: Finanzanalyse
Tabelle 56: Precise Automation: Aktuelle Entwicklungen
Tabelle 57: Precise Automation: Produkt
Tabelle 58: HAHN Group (Rethink Robotics, Inc.): Aktuelle Entwicklungen
Tabelle 59: HAHN Group (Rethink Robotics, Inc.): Produkt
Tabelle 60: Universal Robots A/S: Aktuelle Entwicklungen
Tabelle 61: Universal Robots A/S: Produktübersicht
Tabelle 62: Universal Robots A/S (Teradyne): Finanzanalyse
Tabelle 63: Yaskawa Electric Corporation: Aktuelle Entwicklungen
Tabelle 64: Yaskawa Electric Corporation: Produktübersicht
Tabelle 65: Yaskawa Electric Corporation: Finanzanalyse
Abbildung 1: Zusammenfassung: Weltmarkt für kollaborative Roboter, Umsatz (Mrd. US$), 2020–2033 Abbildung 2: Zusammenfassung: Weltmarkt für kollaborative Roboter, Volumen (Einheiten), 2020–2033 Abbildung 3: Treiber: Kollaborative und traditionelle Industrieroboter in Tsd. Einheiten Abbildung 4: Weltmarkt für kollaborative Roboter, Auswirkungen von Covid-19 und Erholung, 2020–2033 (jährlich in %) Abbildung 5: Wettbewerbsübersicht: Marktanteilsanalyse nach Unternehmen, basierend auf dem Umsatz (2024) Abbildung 6: Weltmarkt für kollaborative Roboter, nach Komponente, CAGR (%), 2024–2033 Abbildung 7: Weltmarktanteil für kollaborative Roboter (%), nach Komponente, 2024 Abbildung 8: Weltmarktanteil für kollaborative Roboter (%), nach Komponente, 2033 Abbildung10: Weltweiter Marktanteil kollaborativer Roboter (%) nach Tragfähigkeit, 2024 9: Weltmarkt für kollaborative Roboter, nach Tragfähigkeit, CAGR (%), 2024–2033 Abbildung ; Abbildung 11: Weltweiter Marktanteil kollaborativer Roboter (%) nach Tragfähigkeit, 2033; Abbildung 12: Weltweiter Markt für kollaborative Roboter nach Anwendung, CAGR (%), 2024–2033; Abbildung 13: Weltweiter Marktanteil kollaborativer Roboter (%) nach Anwendung, 2024; Abbildung 14: Weltweiter Marktanteil kollaborativer Roboter (%) nach Anwendung, 2033; Abbildung 15: Weltweiter Markt für kollaborative Roboter nach Branche, CAGR (%), 2024–2033 ; Abbildung 16: Weltweiter Marktanteil kollaborativer Roboter (%) nach Branche, 2024; Abbildung 17: Weltweiter Marktanteil kollaborativer Roboter (%) nach Branche, 2033; Abbildung 18: Weltweiter Markt für kollaborative Roboter nach Region, CAGR (%), 2024–2033 ; Abbildung 19: Weltweiter Marktanteil kollaborativer Roboter (%) nach Region, 2024 Abbildung 20: Weltweiter Marktanteil kollaborativer Roboter (%), nach Region, 2033 ; Abbildung 21: Europa: Segment mit dem höchsten Anteil (%) ; Abbildung 22: Europa: Chancenanalyse nach Komponente ; Abbildung 23: Europa: Chancenanalyse nach Tragfähigkeit ; Abbildung 24: Europa: Chancenanalyse nach Anwendung ; Abbildung 25: Europa: Chancenanalyse nach Branche ; Abbildung 26: Marktanteil kollaborativer Roboter in Europa (%), nach Land, 2024; Abbildung 27: Marktanteil kollaborativer Roboter in Europa (%), nach Land, 2033 ; Abbildung 28: Marktanteil kollaborativer Roboter in Europa (%), nach Komponente, 2024 ; Abbildung 29: Marktanteil kollaborativer Roboter in Europa (%), nach Komponente, 2033 ; Abbildung 30: Marktanteil kollaborativer Roboter in Europa (%), nach Tragfähigkeit, 2024; Abbildung 31: Marktanteil kollaborativer Roboter in Europa (%), nach Tragfähigkeit, 2033; Abbildung 32: Markt für kollaborative Roboter in Europa Marktanteil (%), nach Anwendung, 2024 Abbildung: 33 Marktanteil kollaborativer Roboter in Europa (%), nach Anwendung, 2033 Abbildung: 34 Marktanteil kollaborativer Roboter in Europa (%), nach Branche, 2024 Abbildung: 35 Marktanteil kollaborativer Roboter in Europa (%), nach Branche, 2033 Abbildung: 36 Deutschland: Segment mit dem höchsten Marktanteil (%) Abbildung: 37 Chancenanalyse, nach Komponente Abbildung: 38 Chancenanalyse, nach Tragfähigkeit Abbildung: 39 Chancenanalyse, nach Anwendung Abbildung: 40 Chancenanalyse, nach Branche Abbildung: 41 Marktanteil kollaborativer Roboter in Deutschland (%), nach Komponente, 2024 Abbildung: 42 Marktanteil kollaborativer Roboter in Deutschland (%), nach Komponente, 2033 Abbildung: 43 Marktanteil kollaborativer Roboter in Deutschland (%), nach Tragfähigkeit, 2024 Abbildung: 44 Marktanteil kollaborativer Roboter in Deutschland (%), nach Tragfähigkeit, 2033 Abbildung: 45 Deutschland Marktanteile kollaborativer Roboter (%), nach Anwendung, 2024 Abbildung: 46 Marktanteile kollaborativer Roboter in Deutschland (%), nach Anwendung, 2033 Abbildung: 47 Marktanteile kollaborativer Roboter in Deutschland (%), nach Branche, 2024 Abbildung: 48 Marktanteile kollaborativer Roboter in Deutschland (%), nach Branche, 2033 Abbildung: 49 ABB Ltd.: Umsatzsegmentierung nach Geschäftsfeld, 2024 Abbildung: 50 ABB Ltd.: Umsatzsegmentierung nach Region, 2024 Abbildung: 51 DENSO Robotics: Umsatzsegmentierung nach Geschäftsfeld, 2024 Abbildung: 52 DENSO Robotics: Umsatzsegmentierung nach Region, 2024 Abbildung: 53 EPSON Robots: Umsatzsegmentierung nach Geschäftsfeld, 2024 Abbildung: 54 EPSON Robots: Umsatzsegmentierung nach Region, 2024 Abbildung: 55 Fanuc Corporation: Umsatzsegmentierung nach Geschäftsfeld, 2024 Abbildung: 56 Fanuc Corporation: Umsatzsegmentierung nach Region57 Abbildung : KUKA AG: Umsatzsegmentierung nach Geschäftsbereichen, Abbildung 58: KUKA AG: Umsatzsegmentierung nach geografischer Region, Abbildung 59: Universal Robots A/S: Umsatzsegmentierung nach Geschäftsbereichen, Abbildung 60: Universal Robots A/S: Umsatzsegmentierung nach geografischer Region, Abbildung 61: Yaskawa Electric Corporation: Umsatzsegmentierung nach Geschäftsbereichen, Abbildung 62: Yaskawa Electric Corporation: Umsatzsegmentierung nach geografischer Region, 2024


Merkmale | Lizenzart | ||||
Datenbuch | Einzelbenutzer |   Mehrere Benutzer | Unternehmen | ||
| E-Zugang | ✓ | ✓ | ✓ | ✓ | |
Benutzerfreigabe | Nur für 1 Benutzer | Nur für 1 Benutzer | Bis zu 7 Benutzer | Unbegrenzter Benutzerzugriff | |
⨉ | ⨉ | ⨉ | ✓ | ||
Kostenlose Anpassung | Keine kostenlose Anpassung | Bis zu 30 Stunden Arbeit | Bis zu 60 Stunden Arbeit | Bis zu 80 Arbeitsstunden | |
Lieferformat |
| ⨉ | ✓ | ✓ | ✓ |
| ✓ | ⨉ | ✓ | ✓ | |
| ⨉ | ⨉ | ⨉ | ✓ | |
Analystenunterstützung | 2 Monate Analystenunterstützung | 4 Monate Analystenunterstützung | 7 Monate Analystenunterstützung | Ein Jahr Analystenbetreuung | |
Kostenloses Bericht-Update im nächsten Aktualisierungszyklus | ⨉ | ⨉ | ⨉ | ✓ | |
Kostenloses Branchen-Update (Innerhalb von 180 Tagen) | ⨉ | ⨉ | ⨉ | ✓ | |
Nutzen | Bis zu 10 % Rabatt nach dem Kauf | Bis zu 20 % Rabatt nach dem Kauf | Bis zu 30 % Rabatt nach dem Kauf | Bis zu 40 % Rabatt nach dem Kauf | |