Tabelle 1. Weltweiter Markt für Bausoftware (Mio. US$), nach Komponenten, 2019–2032
Tabelle 2. Weltweiter Markt für Bausoftware (Mio. US$), nach Modulen, 2019–2032
Tabelle 3. Weltweiter Markt für Bausoftware (Mio. US$), nach Projekttyp, 2019–2032
Tabelle 4. Weltweiter Markt für Bausoftware (Mio. US$), nach Endnutzern, 2019–2032
Tabelle 5. Weltweiter Markt für Bausoftware (Mio. US$), nach Region, 2019–2032
Tabelle 6. Marktgröße für Bausoftware in Nordamerika (Mio. US$), nach Komponenten, 2019–2032
Tabelle 7. Marktgröße für Bausoftware in Nordamerika (Mio. US$), nach Modulen, 2019–2032
Tabelle 8. Marktgröße für Bausoftware in Nordamerika (Mio. US$), nach Projekttyp, 2019–2032
Tabelle 9. Marktgröße für Bausoftware in Nordamerika (Mio. US$)
Tabelle 10. Marktgröße für Bausoftware in Nordamerika (
Tabelle 11. Marktgröße für Bausoftware in Europa (Mio. US$), nach Komponenten, 2019–2032 Tabelle 12. Marktgröße für Bausoftware in Europa (
Mio. US$), nach Modulen, 2019–2032 Tabelle 13. Marktgröße für Bausoftware in Europa
(Mio. US$), nach Projekttyp, 2019–2032
Tabelle 14. Marktgröße für Bausoftware in Europa (Mio. US$), nach Endnutzern, 2019–2032 Tabelle 15. Marktgröße für Bausoftware in Europa
(Mio. US$), nach Ländern, 2019–2032 Tabelle 16. Marktgröße für
Bausoftware im asiatisch-pazifischen Raum (Mio. US$), nach Komponenten, 2019–2032
Tabelle 17. Marktgröße für Bausoftware im asiatisch-pazifischen Raum (Mio. US$), nach Module, 2019–2032
Tabelle 18. Marktgröße für Bausoftware im asiatisch-pazifischen Raum (Mio. US$), nach Projekttyp, 2019–2032
Tabelle 19. Marktgröße für Bausoftware im asiatisch-pazifischen Raum (Mio. US$), nach Endnutzern, 2019–2032
Tabelle 20. Marktgröße für Bausoftware im asiatisch-pazifischen Raum (Mio. US$), nach Land, 2019–2032
Tabelle 21. Marktgröße für Bausoftware in Südamerika (Mio. US$), nach Komponente, 2019–2032
Tabelle 22. Marktgröße für Bausoftware in Südamerika (Mio. US$), nach Modulen, 2019–2032
Tabelle 23. Marktgröße für Bausoftware in Südamerika (Mio. US$), nach Projekttyp, 2019–2032
Tabelle 24. Marktgröße für Bausoftware in Südamerika (Mio. US$), nach Endnutzern, 2019–2032
Tabelle 25. Marktgröße für Bausoftware in Südamerika (Mio. US$)
Tabelle 26. Marktgröße für Bausoftware im Nahen Osten (
Tabelle 27. Marktgröße für Bausoftware im Nahen Osten (Mio. US$), nach Modulen, 2019–2032
Tabelle 28. Marktgröße für Bausoftware im Nahen Osten (Mio. US$), nach Projekttyp, 2019–2032
Tabelle 29. Marktgröße für Bausoftware im Nahen Osten (Mio. US$), nach Endnutzern, 2019–2032
Tabelle 30. Marktgröße für Bausoftware im Nahen Osten (Mio. US$), nach Land, 2019–2032 Tabelle 31.
Marktgröße für Bausoftware in Afrika (Mio. US$), nach Komponente, 2019–2032 Tabelle
32. Marktgröße für Bausoftware in Afrika (Mio. US$), nach Modulen, 2019–2032
Tabelle 33. Bausoftware in
Tabelle 34. Marktgröße für Bausoftware in Afrika (Mio. US$), nach Endnutzern, 2019–2032
Tabelle 35. Marktgröße für Bausoftware in Afrika (Mio. US$), nach Land, 2019–2032
Tabelle 36. Marktgröße für Bausoftware in den USA (Mio. US$), nach Komponente, 2019–2032
Tabelle 37. Marktgröße für Bausoftware in den USA (Mio. US$), nach Modulen, 2019–2032
Tabelle 38. Marktgröße für Bausoftware in den USA (Mio. US$), nach Projekttyp, 2019–2032
Tabelle 39. Marktgröße für Bausoftware in den USA (Mio. US$), nach Endnutzern, 2019–2032
Tabelle 40. Marktgröße für Bausoftware in Großbritannien (Mio. US$), nach Komponente, 2019–2032
Tabelle 41. Bausoftware in Großbritannien Marktgröße (Mio. US$), nach Modulen, 2019–2032
Tabelle 42. Marktgröße für Bausoftware im Vereinigten Königreich (Mio. US$), nach Projekttyp, 2019–2032
Tabelle 43. Marktgröße für Bausoftware im Vereinigten Königreich (Mio. US$), nach Endnutzern, 2019–2032
Tabelle 44. Marktgröße für Bausoftware in Australien (Mio. US$), nach Komponente, 2019–2032
Tabelle 45. Marktgröße für Bausoftware in Australien (Mio. US$), nach Modulen, 2019–2032
Tabelle 46. Marktgröße für Bausoftware in Australien (Mio. US$), nach Projekttyp, 2019–2032
Tabelle 47. Marktgröße für Bausoftware in Australien (Mio. US$), nach Endnutzern, 2019–2032
Tabelle 48. Sage Group PLC.: Finanzanalyse
Tabelle 49. Oracle Corporation: Finanzanalyse
Tabelle 50. Autodesk, Inc.: Finanzanalyse
Tabelle 51. Roper Technologies, Inc.: Finanzanalyse
Tabelle 52. Trimble Inc.: Finanzanalyse
Tabelle 53. Constellation Software Inc.: Finanzanalyse
Tabelle 54. BIMobject AB: Finanzanalyse
Tabelle 55. RIB Software SE: Finanzanalyse
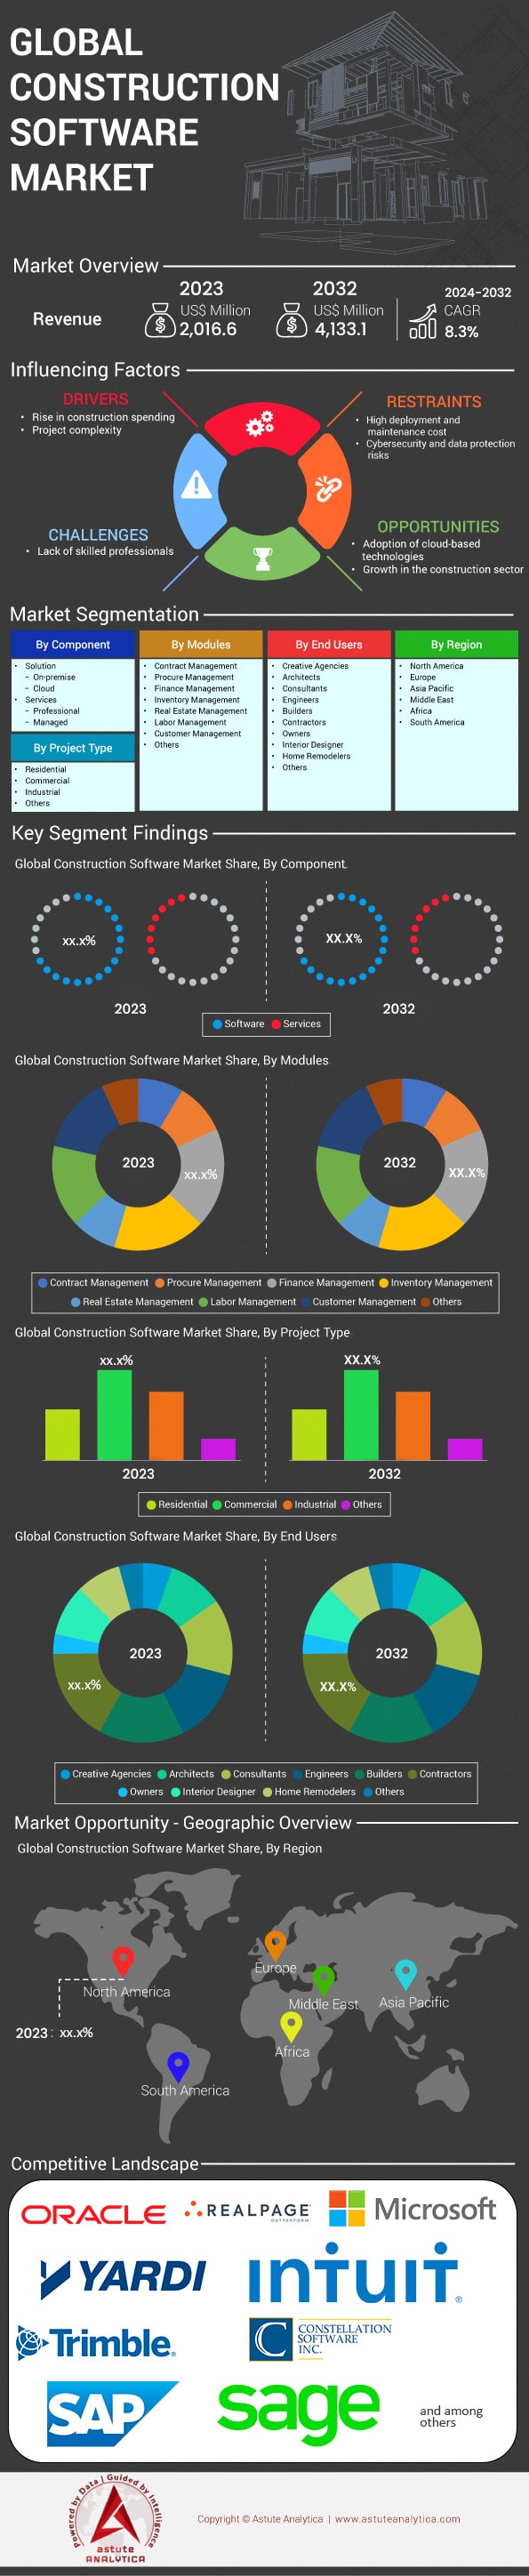
Abbildung 1: Zusammenfassung: Weltweiter Markt für Bausoftware, Größe 2019–2032 (Mio. US$) Abbildung 2: Zusammenfassung: Weltweiter Markt für Bausoftware, Umsatz (Mio. US$), 2023 Abbildung 3: Zusammenfassung: Weltweiter Markt für Bausoftware, Umsatz (Mio. US$), 2032 Abbildung 4: Bauausgaben für öffentliche Infrastruktur, 2018, Mrd. US$ Abbildung 5: Investitionen in Bautechnologie (2009–2019), Mrd. US$ (ca.) Abbildung 6: Umsatz für Software Abbildung 7: Am häufigsten nachgefragte Funktionen von Bausoftware Abbildung 8: Abonnementpreise für Bauunternehmen Abbildung 9: Marktanteilsanalyse nach Unternehmen, basierend auf dem Umsatz (2023) Abbildung 10: Preisanalyse nach Region (durchschnittlicher Verkaufspreis) Abbildung 11: Analyse der Auswirkungen von Covid-19 Abbildung 12: Weltweiter Markt für Bausoftware nach Komponente, CAGR (%) 2019–2032 Abbildung 13: Weltweiter Marktanteil für Bausoftware (%), nach Komponente, 2023 Abbildung 14: Weltweiter Marktanteil für Bausoftware (%), nach Komponente, 2032 Abbildung 15: Weltweiter Markt für Bausoftware, nach Modulen, nach Umsatz (CAGR) Abbildung 16: Weltweiter Marktanteil für Bausoftware (%), nach Modulen, 2023 Abbildung 17: Weltweiter Marktanteil für Bausoftware (%), nach Modulen, 2032 Abbildung 18: Weltweiter Markt für Bausoftware, nach Projekttyp, CAGR (%), 2019–2032 Abbildung 19: Weltweiter Marktanteil für Bausoftware (%), nach Projekttyp, 2023 Abbildung 20: Weltweiter Marktanteil für Bausoftware (%), nach Projekttyp, 2032 Abbildung 21: Weltweiter Markt für Bausoftware, nach Endnutzern, CAGR (%), 2019–2032 Abbildung 22: Weltweiter Marktanteil für Bausoftware (%), nach Endnutzern, 2023 Abbildung 23: Weltweiter Marktanteil für Bausoftware (%), nach Endnutzern, 2032 Abbildung 24: Weltweiter Markt für Bausoftware, nach Region, CAGR (%), 2019–2032 Abbildung 25: Weltweiter Marktanteil für Bausoftware (%), nach Region, 2023 Abbildung 26: Weltweiter Marktanteil für Bausoftware (%), nach Region, 2032 Abbildung 27: Nordamerikanischer Markt für Bausoftware: Segment mit dem höchsten Anteil (%) Abbildung 28: Nordamerikanischer Marktanteil für Bausoftware (%), nach Komponente, 2023 Abbildung 29: Nordamerikanischer Marktanteil für Bausoftware (%), nach Komponente, 2032 Abbildung 30 : Nordamerikanischer Marktanteil für Bausoftware (%), nach Modulen, 2023 Abbildung 31: Nordamerikanischer Marktanteil für Bausoftware (%), nach Modulen, 2032 Abbildung 32: Nordamerikanischer Marktanteil für Bausoftware (%), nach Projekttyp, 2023 Abbildung 33: Nordamerikanischer Marktanteil für Bausoftware (%), nach Projekttyp, 2032 Abbildung 34: Marktanteile von Bausoftware in Nordamerika (%), nach Endnutzern, 2023 Abbildung 35: Marktanteile von Bausoftware in Nordamerika (%), nach Endnutzern, 2032 Abbildung 36: Marktanteile von Bausoftware in Nordamerika (%), nach Region, 2023 Abbildung 37: Marktanteile von Bausoftware in Nordamerika (%), nach Region, 2032 Abbildung 38: Markt für Bausoftware in Europa: Segment mit dem höchsten Anteil (%) Abbildung 39: Marktanteile von Bausoftware in Europa (%), nach Komponente, 2023 Abbildung 40: Marktanteile von Bausoftware in Europa (%), nach Komponente, 2032 Abbildung 41: Marktanteile von Bausoftware in Europa (%), nach Modulen, 2023 Abbildung 42: Marktanteile von Bausoftware in Europa (%), nach Modulen, 2032 Abbildung 43: Marktanteile von Bausoftware in Europa (%), nach Projekttyp, 2023 Abbildung 44: Marktanteile von Bausoftware in Europa (%), nach Projekttyp, 2032 Abbildung 45: Marktanteil von Bausoftware in Europa (%), nach Endnutzern, 2023 Abbildung 46: Marktanteil von Bausoftware in Europa (%), nach Endnutzern, 2032 Abbildung 47: Marktanteil von Bausoftware in Europa (%), nach Region, 2023 Abbildung 48: Marktanteil von Bausoftware in Europa (%), nach Region, 2032 Abbildung 49: Markt für Bausoftware im asiatisch-pazifischen Raum: Segment mit dem höchsten Anteil (%) Abbildung 50: Marktanteil von Bausoftware im asiatisch-pazifischen Raum (%), nach Komponente, 2023 Abbildung 51: Marktanteil von Bausoftware im asiatisch-pazifischen Raum (%), nach Komponente, 2032 Abbildung 52: Marktanteil von Bausoftware im asiatisch-pazifischen Raum (%), nach Modulen, 2023 Abbildung 53: Marktanteil von Bausoftware im asiatisch-pazifischen Raum (%), nach Modulen, 2032 Abbildung 54: Marktanteil von Bausoftware im asiatisch-pazifischen Raum (%), nach Projekttyp, 2023 Abbildung 55: Marktanteil von Bausoftware im asiatisch-pazifischen Raum (%), nach Projekttyp, 2032 Abbildung 56: Markt für Bausoftware im asiatisch-pazifischen Raum Marktanteil (%), nach Endnutzern, 2023 Abbildung 57: Marktanteil von Bausoftware im asiatisch-pazifischen Raum (%), nach Endnutzern, 2032 Abbildung 58: Marktanteil von Bausoftware im asiatisch-pazifischen Raum (%), nach Region, 2023 Abbildung 59: Marktanteil von Bausoftware im asiatisch-pazifischen Raum (%), nach Region, 2032 Abbildung 60: Markt für Bausoftware in Südamerika: Segment mit dem höchsten Anteil (%) Abbildung 61: Marktanteil von Bausoftware in Südamerika (%), nach Komponente, 2023 Abbildung 62: Marktanteil von Bausoftware in Südamerika (%), nach Komponente, 2032 Abbildung 63: Marktanteil von Bausoftware in Südamerika (%), nach Modulen, 2023 Abbildung 64: Marktanteil von Bausoftware in Südamerika (%), nach Modulen, 2032 Abbildung 65: Marktanteil von Bausoftware in Südamerika (%), nach Projekttyp, 2023 Abbildung 66: Marktanteil von Bausoftware in Südamerika (%), nach Projekttyp, 2032 Abbildung 67: Bausoftware in Südamerika Marktanteil (%), nach Endnutzern, 2023 Abbildung 68: Marktanteil Südamerikas für Bausoftware (%), nach Endnutzern, 2032 Abbildung 69: Marktanteil Südamerikas für Bausoftware (%), nach Region, 2023 Abbildung 70: Marktanteil Südamerikas für Bausoftware (%), nach Region, 2032 Abbildung 71: Markt für Bausoftware im Nahen Osten: Segment mit dem höchsten Anteil (%) Abbildung 72: Marktanteil Naher Ostens für Bausoftware (%), nach Komponente, 2023 Abbildung 73: Marktanteil Naher Ostens für Bausoftware (%), nach Komponente, 2032 Abbildung 74: Marktanteil Naher Ostens für Bausoftware (%), nach Modulen, 2023 Abbildung 75: Marktanteil Naher Ostens für Bausoftware (%), nach Modulen, 2032 Abbildung 76: Marktanteil Naher Ostens für Bausoftware (%), nach Projekttyp, 2023 Abbildung 77: Marktanteil Naher Ostens für Bausoftware (%), nach Projekttyp, 2032 Abbildung 78: Marktanteile von Bausoftware im Nahen Osten (%), nach Endnutzern, 2023; Abbildung 79: Marktanteile von Bausoftware im Nahen Osten (%), nach Endnutzern, 2032; Abbildung 80: Marktanteile von Bausoftware im Nahen Osten (%), nach Region, 2023; Abbildung 81: Marktanteile von Bausoftware im Nahen Osten (%), nach Region, 2032; Abbildung 82: Markt für Bausoftware in Afrika: Segment mit dem höchsten Anteil (%); Abbildung 83: Marktanteile von Bausoftware in Afrika (%), nach Komponente, 2023; Abbildung 84: Marktanteile von Bausoftware in Afrika (%), nach Komponente, 2032; Abbildung 85: Marktanteile von Bausoftware in Afrika (%), nach Modulen, 2023; Abbildung 86: Marktanteile von Bausoftware in Afrika (%), nach Modulen, 2032; Abbildung 87: Marktanteile von Bausoftware in Afrika (%), nach Projekttyp, 2023; Abbildung 88: Marktanteil von Bausoftware in Afrika (%), nach Projekt Typ, 2032 Abbildung 89: Marktanteil von Bausoftware in Afrika (%), nach Endnutzern, 2023 Abbildung 90: Marktanteil von Bausoftware in Afrika (%), nach Endnutzern, 2032 Abbildung 91: Marktanteil von Bausoftware in Afrika (%), nach Region, 2023 Abbildung 92: Marktanteil von Bausoftware in Afrika (%), nach Region, 2032 Abbildung 93: US-Bausoftwaremarkt: Segment mit dem höchsten Anteil (%) Abbildung 94: US-Marktanteil von Bausoftware (%), nach Komponente, 2023 Abbildung 95: US-Marktanteil von Bausoftware (%), nach Komponente, 2032 Abbildung 96: US-Marktanteil von Bausoftware (%), nach Modulen, 2023 Abbildung 97: US-Marktanteil von Bausoftware (%), nach Modulen, 2032 Abbildung 98: US-Marktanteil von Bausoftware (%), nach Projekttyp, 2023 Abbildung 99: US-Marktanteil von Bausoftware (%), nach Projekttyp, 2032 Abbildung 100: Marktanteil von Bausoftware in den USA (%), nach Endnutzern, 2023 Abbildung 101: Marktanteil von Bausoftware in den USA (%), nach Endnutzern, 2032 Abbildung 102: Markt für Bausoftware in Großbritannien: Segment mit dem höchsten Anteil (%) Abbildung 103: Marktanteil von Bausoftware in Großbritannien (%), nach Komponente, 2023 Abbildung 104: Marktanteil von Bausoftware in Großbritannien (%), nach Komponente, 2032 Abbildung 105: Marktanteil von Bausoftware in Großbritannien (%), nach Modulen, 2023 Abbildung 106: Marktanteil von Bausoftware in Großbritannien (%), nach Modulen, 2032 Abbildung 107: Marktanteil von Bausoftware in Großbritannien (%), nach Projekttyp, 2023 Abbildung 108: Marktanteil von Bausoftware in Großbritannien (%), nach Projekttyp, 2032 Abbildung 109: Marktanteil von Bausoftware in Großbritannien (%), nach Endnutzern, 2023 Abbildung 110: Marktanteil von Bausoftware in Großbritannien (%), Nach Endnutzern, 2032 Abbildung 111: Australischer Markt für Bausoftware: Segment mit dem höchsten Anteil (%) Abbildung 112: Marktanteil von Bausoftware in Australien (%), nach Komponente, 2023 Abbildung 113: Marktanteil von Bausoftware in Australien (%), nach Komponente, 2032 Abbildung 114: Marktanteil von Bausoftware in Australien (%), nach Modulen, 2023 Abbildung 115: Marktanteil von Bausoftware in Australien (%), nach Modulen, 2032 Abbildung 116: Marktanteil von Bausoftware in Australien (%), nach Projekttyp, 2023 Abbildung 117: Marktanteil von Bausoftware in Australien (%), nach Projekttyp, 2032 Abbildung 118: Marktanteil von Bausoftware in Australien (%), nach Endnutzern, 2023 Abbildung 119: Marktanteil von Bausoftware in Australien (%), nach Endnutzern, 2032 Abbildung 120: Sage Group PLC.: Segmentierung der Geschäftsumsätze Abbildung 121: Sage Group PLC.: Geografische Umsatzsegmentierung, 2023 Abbildung 122: Oracle Corporation: Umsatzsegmentierung nach Geschäftsbereichen, 2023 Abbildung 123: Oracle Corporation: Geografische Umsatzsegmentierung, 2023 Abbildung 124: Autodesk, Inc.: Geografische Umsatzsegmentierung, 2023 Abbildung 125: Roper Technologies, Inc.: Umsatzsegmentierung nach Geschäftsbereichen, 2023 Abbildung 126: Roper Technologies, Inc.: Geografische Umsatzsegmentierung, 2023 Abbildung 127: Trimble Inc.: Umsatzsegmentierung nach Geschäftsbereichen, 2023 Abbildung 128: Trimble Inc.: Geografische Umsatzsegmentierung, 2023 Abbildung 129: Constellation Software Inc.: Umsatzsegmentierung nach Geschäftsbereichen, 2023 Abbildung 130: Constellation Software Inc.: Geografische Umsatzsegmentierung, 2023 131:BIMobject AB: Umsatzsegmentierung nach Geschäftsfeld, 2023 Abbildung 133:RIB Software SE: Umsatzsegmentierung nach Geschäftsfeld, 2023


Merkmale | Lizenzart | ||||
Datenbuch | Einzelbenutzer |   Mehrere Benutzer | Unternehmen | ||
| E-Zugang | ✓ | ✓ | ✓ | ✓ | |
Benutzerfreigabe | Nur für 1 Benutzer | Nur für 1 Benutzer | Bis zu 7 Benutzer | Unbegrenzter Benutzerzugriff | |
⨉ | ⨉ | ⨉ | ✓ | ||
Kostenlose Anpassung | Keine kostenlose Anpassung | Bis zu 30 Stunden Arbeit | Bis zu 60 Stunden Arbeit | Bis zu 80 Arbeitsstunden | |
Lieferformat |
| ⨉ | ✓ | ✓ | ✓ |
| ✓ | ⨉ | ✓ | ✓ | |
| ⨉ | ⨉ | ⨉ | ✓ | |
Analystenunterstützung | 2 Monate Analystenunterstützung | 4 Monate Analystenunterstützung | 7 Monate Analystenunterstützung | Ein Jahr Analystenbetreuung | |
Kostenloses Bericht-Update im nächsten Aktualisierungszyklus | ⨉ | ⨉ | ⨉ | ✓ | |
Kostenloses Branchen-Update (Innerhalb von 180 Tagen) | ⨉ | ⨉ | ⨉ | ✓ | |
Nutzen | Bis zu 10 % Rabatt nach dem Kauf | Bis zu 20 % Rabatt nach dem Kauf | Bis zu 30 % Rabatt nach dem Kauf | Bis zu 40 % Rabatt nach dem Kauf | |