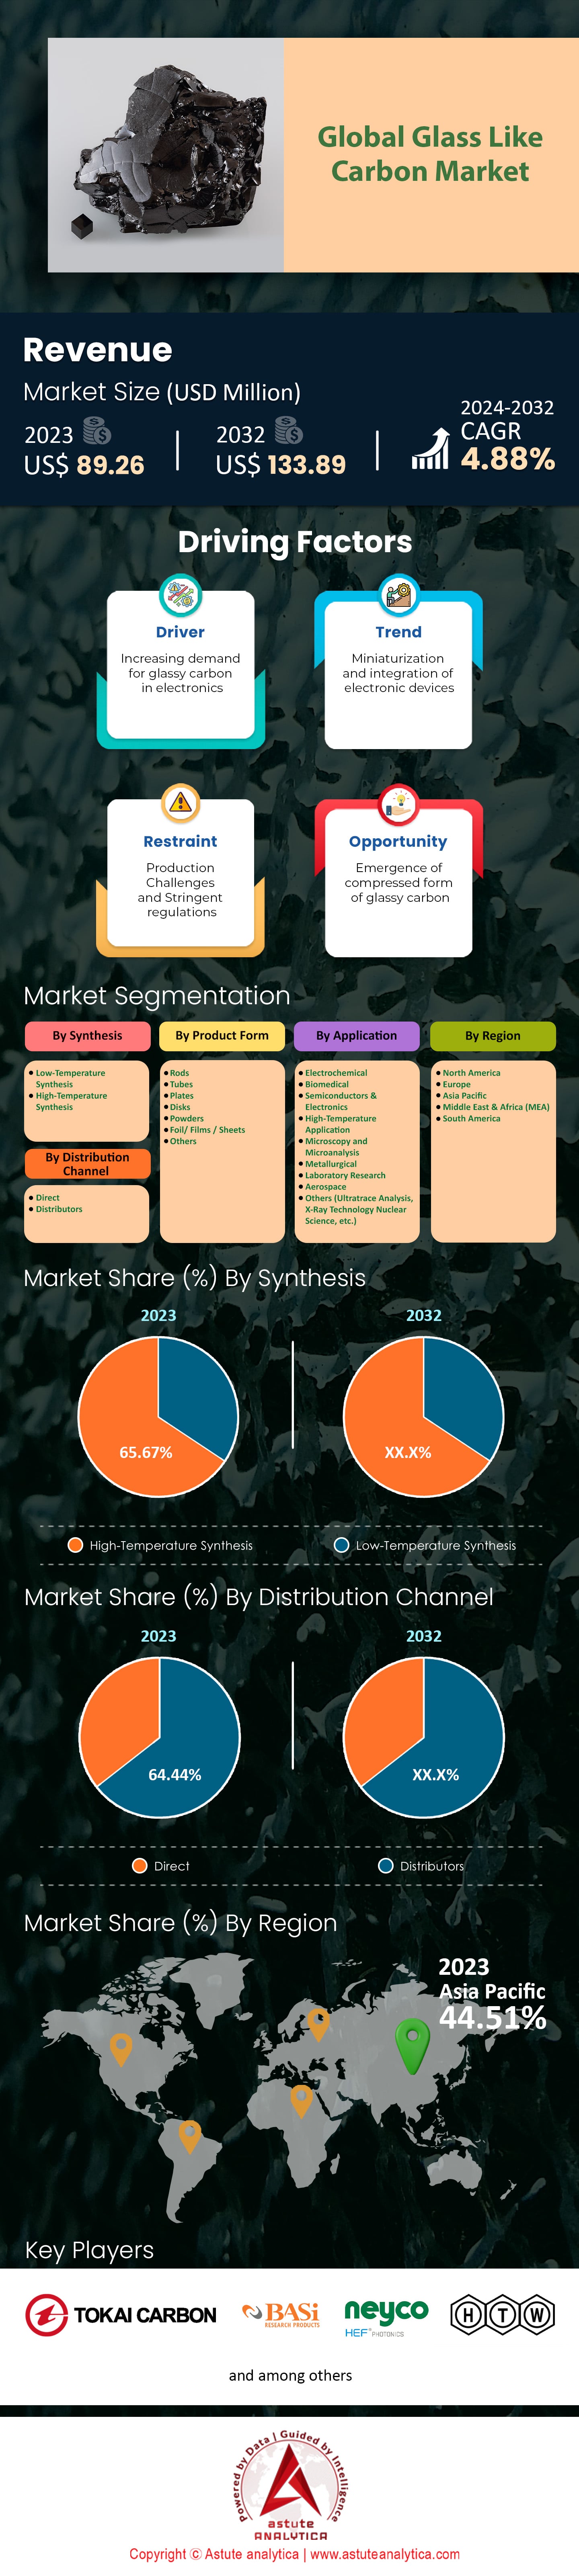
Globaler Markt für glasähnlichen Kohlenstoff: Nach Synthese (Niedertemperatursynthese und Hochtemperatursynthese); Produktform (Stäbe, Rohre, Platten, Scheiben, Pulver, Folien/Filme/Bleche, Sonstige); Anwendungen (Elektrochemie, Biomedizin, Halbleiter & Elektronik, Hochtemperaturanwendungen, Mikroskopie und Mikroanalyse, Metallurgie, Laborforschung, Luft- und Raumfahrt, Sonstige (Ultraspurenanalyse, Röntgentechnologie, Nuklearwissenschaft usw.)); Vertriebskanal (Direktvertrieb und Distributoren); Region – Marktgröße, Branchendynamik, Chancenanalyse und Prognose für 2024–2032
- Letzte Aktualisierung: 25.09.2024 | | Bericht-ID: AA0924935
Tabelle 1: Branchenausblick: Mechanische Eigenschaften von glasartigem Kohlenstoff Tabelle 2: Branchenausblick: Überblick über glasartige Kohlenstoffstrukturen für Geräteanwendungen, gewonnen durch Pyrolyse von mikro-/nanostrukturierten Polymeren Tabelle 3: Marktdynamik und Trends: Wirkungsanalyse der Marktdynamik Tabelle 4: Produktpreisanalyse: Preisanalyse basierend auf der Produktform Tabelle 5: Wettbewerbsübersicht: Kartierung und Benchmarking der Wettbewerber auf dem globalen Markt für glasartigen Kohlenstoff Tabelle 6: Weltweite Marktgröße für glasartigen Kohlenstoff (Mio. US$), nach Synthese, 2019–2032 Tabelle 7: Weltweite Marktgröße für glasartigen Kohlenstoff (Mio. US$), nach Produktform, 2019–2032 Tabelle 8: Weltweite Marktgröße für glasartigen Kohlenstoff (Mio. US$), nach Anwendung, 2019–2032 Tabelle 9: Weltweite Marktgröße für glasartigen Kohlenstoff (Mio. US$), nach Vertriebskanal, 2019–2032 Tabelle 10: Weltweite Marktgröße für glasartigen Kohlenstoff (Mio. US$), nach Region, 2019–2032 Tabelle 11: Marktgröße für glasähnliche Kohlenstoffe in Nordamerika (Mio. US$), nach Ländern, 2019–2032; Tabelle 12: Marktgröße für glasähnliche Kohlenstoffe in Nordamerika (Mio. US$), nach Syntheseart, 2019–2032; Tabelle 13: Marktgröße für glasähnliche Kohlenstoffe in Nordamerika (Mio. US$), nach Produktform, 2019–2032; Tabelle 14: Marktgröße für glasähnliche Kohlenstoffe in Nordamerika (Mio. US$), nach Anwendung, 2019–2032; Tabelle 15: Marktgröße für glasähnliche Kohlenstoffe in Nordamerika (Mio. US$), nach Vertriebskanal, 2019–2032; Tabelle 16: Marktgröße für glasähnliche Kohlenstoffe in Europa (Mio. US$), nach Ländern, 2019–2032; Tabelle 17: Marktgröße für glasähnliche Kohlenstoffe in Europa (Mio. US$), nach Syntheseart, 2019–2032; Tabelle 18: Marktgröße für glasähnliche Kohlenstoffe in Europa (Mio. US$), nach Produktform Tabelle 19: Marktgröße für glasähnliche Kohlenstoffe in Europa (Mio. US$), nach Anwendung, 2019–2032 ; Tabelle 20: Marktgröße für glasähnliche Kohlenstoffe in Europa (Mio. US$), nach Vertriebskanal, 2019–2032; Tabelle 21: Marktgröße für glasähnliche Kohlenstoffe im asiatisch-pazifischen Raum (Mio. US$), nach Land, 2019–2032; Tabelle 22: Marktgröße für glasähnliche Kohlenstoffe im asiatisch-pazifischen Raum (Mio. US$), nach Synthese, 2019–2032; Tabelle 23: Marktgröße für glasähnliche Kohlenstoffe im asiatisch-pazifischen Raum (Mio. US$), nach Produktform, 2019–2032; Tabelle 24: Marktgröße für glasähnliche Kohlenstoffe im asiatisch-pazifischen Raum (Mio. US$), nach Anwendung, 2019–2032; Tabelle 25: Marktgröße für glasähnliche Kohlenstoffe im asiatisch-pazifischen Raum (Mio. US$), nach Vertriebskanal, 2019–2032; Tabelle 26: Marktgröße für glasähnliche Kohlenstoffe im Nahen Osten und Afrika (Mio. US$) Tabelle 27: Marktgröße für glasähnlichen Kohlenstoff im Nahen Osten und Afrika (Mio. US$), nach Synthese, 2019–2032; Tabelle 28: Marktgröße für glasähnlichen Kohlenstoff im Nahen Osten und Afrika (Mio. US$), nach Produktform, 2019–2032 ; Tabelle 29: Marktgröße für glasähnlichen Kohlenstoff im Nahen Osten und Afrika (Mio. US$), nach Anwendung, 2019–2032; Tabelle 30: Marktgröße für glasähnlichen Kohlenstoff im Nahen Osten und Afrika (Mio. US$), nach Vertriebskanal, 2019–2032; Tabelle 31: Marktgröße für glasähnlichen Kohlenstoff in Südamerika (Mio. US$), nach Land, 2019–2032; Tabelle 32: Marktgröße für glasähnlichen Kohlenstoff in Südamerika (Mio. US$), nach Synthese, 2019–2032; Tabelle 33: Marktgröße für glasähnlichen Kohlenstoff in Südamerika (Mio. US$), nach Produktform, 2019–2032 Tabelle 34: Marktgröße für glasartige Kohlenstoffe in Südamerika (Mio. US$), nach Anwendung, 2019–2032 Tabelle 35: Marktgröße für glasartige Kohlenstoffe in Südamerika (Mio. US$), nach Vertriebskanal, 2019–2032 Tabelle 36: ALS Co. Ltd.: Produkte Tabelle 37: Bioanalytical Systems, Inc.: Produkte Tabelle 38: Bioanalytical Systems, Inc.: Finanzanalyse Tabelle 39: Final Advanced Materials: Produkte Tabelle 40: HTW Hochtemperatur Werkstoffe GmbH: Produkte Tabelle 41: Merck KGaA: Produkte Tabelle 42: Merck KGaA: Finanzanalyse Tabelle 43: Metrohm: Produkte Tabelle 44: Neyco: Produkte Tabelle 45: PalmSens BV: Produkte Tabelle 46: redox.me: Produkte Tabelle 47: Resonac Holdings Corporation: Aktuelle Entwicklungen Tabelle 48: Resonac Holdings Corporation: Produkte Tabelle 49: Resonac Holdings Corporation: Finanzanalyse Tabelle 50 Structure Probe, Inc.: Produkttabelle : 51 Tokai Carbon Co., Ltd.: Produkttabelle: 52 Tokai Carbon Co., Ltd.: Finanzanalysetabelle : 53 XRD Graphite Manufacturing Co., Ltd.: Produkttabelle : 54 Weitere bedeutende Akteure
Abbildung 1: Zusammenfassung: Weltweiter Markt für glasähnlichen Kohlenstoff, Umsatz (Mio. US$), 2019–2032. Abbildung 2: Adoptionsanalyse: Adoptionsrate (%), nach Synthese. Abbildung 3: Adoptionsanalyse: Weltweiter Markt für glasähnlichen Kohlenstoff, jährliche Veränderung (%), 2020–2032. Abbildung 4: Adoptionsanalyse: Umsatzvergleich nach Produktform (Mio. US$). Abbildung 5: Marktdynamik und Trends – Treiber: Haushaltsdurchdringung von Gebrauchsgütern und Elektronik. Abbildung 6: Marktdynamik und Trends – Treiber: Weltweite Smartphone-Nutzung zwischen 2017 und 2025 (%). Abbildung 7: Marktdynamik und Trends – Treiber: Weltweiter Halbleitermarkt 2021: 556 Mrd. USD, Anteil an der Halbleiternachfrage nach Endverwendung. Abbildung 8: Weltweiter Markt für glasähnlichen Kohlenstoff, Auswirkungen von Covid-19 und Erholung, 2020–2032, jährliche Veränderung (%). Abbildung 9: Wettbewerbsübersicht: Marktkonzentration (2023). Abbildung 10: Wettbewerbsübersicht: Markt. Marktanteilsanalyse nach Unternehmen, basierend auf dem Umsatz (2023) Abbildung 11: Weltweiter Markt für glasähnlichen Kohlenstoff nach Syntheseart, CAGR (%), 2024–2032 Abbildung 12: Weltweiter Marktanteil für glasähnlichen Kohlenstoff (%) nach Syntheseart, 2023 Abbildung 13: Weltweiter Marktanteil für glasähnlichen Kohlenstoff (%) nach Syntheseart, 2032 Abbildung 14: Weltweiter Markt für glasähnlichen Kohlenstoff nach Produktform, CAGR (%), 2024–2032 Abbildung 15: Weltweiter Marktanteil für glasähnlichen Kohlenstoff (%) nach Produktform, 2023 Abbildung 16: Weltweiter Marktanteil für glasähnlichen Kohlenstoff (%) nach Produktform, 2032 Abbildung 17: Weltweiter Markt für glasähnlichen Kohlenstoff nach Anwendung, CAGR (%), 2024–2032 Abbildung 18: Weltweiter Marktanteil für glasähnlichen Kohlenstoff (%) nach Anwendung, 2023 Abbildung 19: Weltweiter Marktanteil für glasähnlichen Kohlenstoff (%) nach Anwendung, 2032 Abbildung 20: Weltweit Markt für glasähnlichen Kohlenstoff nach Vertriebskanal, CAGR (%), 2024–2032 Abbildung: 21 Weltweiter Marktanteil für glasähnlichen Kohlenstoff (%), nach Vertriebskanal, 2023 Abbildung: 22 Weltweiter Marktanteil für glasähnlichen Kohlenstoff (%), nach Vertriebskanal, 2032 Abbildung: 23 Weltweiter Markt für glasähnlichen Kohlenstoff nach Region, CAGR (%), 2024–2032 Abbildung: 24 Weltweiter Marktanteil für glasähnlichen Kohlenstoff (%), nach Region, 2023 Abbildung: 25 Weltweiter Marktanteil für glasähnlichen Kohlenstoff (%), nach Region, 2032 Abbildung: 26 Nordamerika: Segment mit dem höchsten Anteil (%) Abbildung: 27 Nordamerika: Netto-Potenzialzuwachs in Mio. US$ Abbildung: 28 Nordamerika: Textanalyse Abbildung: 29 Nordamerika: Chancenbewertung nach Synthese Abbildung: 30 Nordamerika: Chancenbewertung nach Produktform Abbildung: 31 Nordamerika: Chancenbewertung nach Anwendung Abbildung: 32 Nordamerika: Chancenanalyse nach Vertriebskanal : Abb. 33 Marktanteil von glasartigem Kohlenstoff in Nordamerika (%), nach Land, 2023 Abb. 34 Marktanteil von glasartigem Kohlenstoff in Nordamerika (%), nach Land, 2032 Abb. 35 Marktanteil von glasartigem Kohlenstoff in Nordamerika (%), nach Synthese, 2023 Abb. 36 Marktanteil von glasartigem Kohlenstoff in Nordamerika (%), nach Synthese, 2032 Abb. 37 Marktanteil von glasartigem Kohlenstoff in Nordamerika (%), nach Produktform, 2023 Abb. 38 Marktanteil von glasartigem Kohlenstoff in Nordamerika (%), nach Produktform, 2032 Abb. 39 Marktanteil von glasartigem Kohlenstoff in Nordamerika (%), nach Anwendung, 2023 Abb. 40 Marktanteil von glasartigem Kohlenstoff in Nordamerika (%), nach Anwendung, 2032 Abb. 41 Marktanteil von glasartigem Kohlenstoff in Nordamerika (%), nach Vertriebskanal, 2023 Abb. 42 Marktanteil von glasartigem Kohlenstoff in Nordamerika (%), nach Vertriebskanal, 2032 Abbildung 43: Europa: Segment mit dem höchsten Anteil (%) Abbildung 44: Europa: Netto-Marktpotenzial (in Mio. US$) Abbildung 45: Europa: Textanalyse Abbildung 46: Europa: Chancenbewertung nach Synthese Abbildung 47: Europa: Chancenbewertung nach Produktform Abbildung 48: Europa: Chancenbewertung nach Anwendung Abbildung 49: Europa: Chancenbewertung nach Vertriebskanal Abbildung 50: Marktanteil von glasartigem Kohlenstoff in Europa (%), nach Land, 2023 Abbildung 51: Marktanteil von glasartigem Kohlenstoff in Europa (%), nach Land, 2032 Abbildung 52: Marktanteil von glasartigem Kohlenstoff in Europa (%), nach Synthese, 2023 Abbildung 53: Marktanteil von glasartigem Kohlenstoff in Europa (%), nach Synthese, 2032 Abbildung 54: Marktanteil von glasartigem Kohlenstoff in Europa (%), nach Produktform, 2023 Abbildung 55: Marktanteil von glasartigem Kohlenstoff in Europa (%), nach Produktform, 2032 Abbildung 56 Marktanteil von glasähnlichem Kohlenstoff in Europa (%), nach Anwendung, 2023 Abbildung: 57 Marktanteil von glasähnlichem Kohlenstoff in Europa (%), nach Anwendung, 2032 Abbildung: 58 Marktanteil von glasähnlichem Kohlenstoff in Europa (%), nach Vertriebskanal, 2023 Abbildung: 59 Marktanteil von glasähnlichem Kohlenstoff in Europa (%), nach Vertriebskanal, 2032 Abbildung: 60 Asien-Pazifik: Segment mit dem höchsten Anteil (%) Abbildung : 61 Asien-Pazifik: Netto-Potenzialzuwachs in Mio. US$ Abbildung: 62 Asien-Pazifik: Textanalyse Abbildung: 63 Asien-Pazifik: Chancenbewertung, nach Synthese Abbildung: 64 Asien-Pazifik: Chancenbewertung, nach Produktform Abbildung: 65 Asien-Pazifik: Chancenbewertung, nach Anwendung Abbildung: 66 Asien-Pazifik: Chancenbewertung, nach Vertriebskanal Abbildung: 67 Marktanteil von glasähnlichem Kohlenstoff in Asien-Pazifik (%), nach Land, 2023 Abbildung: 68 Marktanteil von glasähnlichem Kohlenstoff in Asien-Pazifik (%), nach Land, 2032 Abbildung: 69 Marktanteil von glasähnlichem Kohlenstoff im asiatisch-pazifischen Raum (%), nach Synthese, 2023 Abbildung: 70 Marktanteil von glasähnlichem Kohlenstoff im asiatisch-pazifischen Raum (%), nach Synthese, 2032 Abbildung: 71 Marktanteil von glasähnlichem Kohlenstoff im asiatisch-pazifischen Raum (%), nach Produktform, 2023 Abbildung: 72 Marktanteil von glasähnlichem Kohlenstoff im asiatisch-pazifischen Raum (%), nach Produktform, 2032 Abbildung: 73 Marktanteil von glasähnlichem Kohlenstoff im asiatisch-pazifischen Raum (%), nach Anwendung, 2023 Abbildung: 74 Marktanteil von glasähnlichem Kohlenstoff im asiatisch-pazifischen Raum (%), nach Anwendung, 2032 Abbildung: 75 Marktanteil von glasähnlichem Kohlenstoff im asiatisch-pazifischen Raum (%), nach Vertriebskanal, 2023 Abbildung: 76 Marktanteil von glasähnlichem Kohlenstoff im asiatisch-pazifischen Raum (%), nach Vertriebskanal, 2032 Abbildung: 77 Naher Osten und Afrika: Segment mit dem höchsten Anteil (%) Abbildung: 78 Naher Osten und Afrika: Nettopotenzialzuwachs in Mio. US$ Abbildung: 79 Naher Osten und Afrika: Textanalyse Abbildung: 80 Naher Osten Naher Osten & Afrika: Chancenanalyse, nach Synthese Abbildung: 81 Naher Osten & Afrika: Chancenanalyse, nach Produktform Abbildung: 82 Naher Osten & Afrika: Chancenanalyse, nach Anwendung Abbildung: 83 Naher Osten & Afrika: Chancenanalyse, nach Vertriebskanal Abbildung: 84 Marktanteil von glasartigem Kohlenstoff im Nahen Osten & Afrika (%), nach Land, 2023 Abbildung: 85 Marktanteil von glasartigem Kohlenstoff im Nahen Osten & Afrika (%), nach Land, 2032 Abbildung: 86 Marktanteil von glasartigem Kohlenstoff im Nahen Osten & Afrika (%), nach Synthese, 2023 Abbildung: 87 Marktanteil von glasartigem Kohlenstoff im Nahen Osten & Afrika (%), nach Synthese, 2032 Abbildung: 88 Marktanteil von glasartigem Kohlenstoff im Nahen Osten & Afrika (%), nach Produktform, 2023 Abbildung: 89 Marktanteil von glasartigem Kohlenstoff im Nahen Osten & Afrika (%), nach Produktform, 2032 Abbildung: 90 Marktanteil von glasartigem Kohlenstoff im Nahen Osten & Afrika (%), nach Anwendung Abbildung 91 : Marktanteil von glasähnlichem Kohlenstoff im Nahen Osten und Afrika (%), nach Anwendung, 2032; Abbildung 92: Marktanteil von glasähnlichem Kohlenstoff im Nahen Osten und Afrika (%), nach Vertriebskanal, 2023; Abbildung 93: Marktanteil von glasähnlichem Kohlenstoff im Nahen Osten und Afrika (%), nach Vertriebskanal, 2032; Abbildung 94: Südamerika: Segment mit dem höchsten Anteil (%) ; Abbildung 95: Südamerika: Netto-Potenzialzuwachs in Mio. US$ ; Abbildung 96: Südamerika: Textanalyse; Abbildung 97: Südamerika: Chancenbewertung, nach Synthese ; Abbildung 98: Südamerika: Chancenbewertung, nach Produktform ; Abbildung 99: Südamerika : Chancenbewertung, nach Anwendung ; Abbildung 100: Südamerika: Chancenbewertung, nach Vertriebskanal ; Abbildung 101: Marktanteil von glasähnlichem Kohlenstoff in Südamerika (%), nach Land, 2023 ; Abbildung 102: Marktanteil von glasähnlichem Kohlenstoff in Südamerika (%), nach Land, 2032 103 Marktanteil von glasartigem Kohlenstoff in Südamerika (%), nach Synthese, 2023 Abbildung: 104 Marktanteil von glasartigem Kohlenstoff in Südamerika (%), nach Synthese, 2032 Abbildung: 105 Marktanteil von glasartigem Kohlenstoff in Südamerika (%), nach Produktform, 2023 Abbildung: 106 Marktanteil von glasartigem Kohlenstoff in Südamerika (%), nach Produktform, 2032 Abbildung: 107 Marktanteil von glasartigem Kohlenstoff in Südamerika (%), nach Anwendung, 2023 Abbildung: 108 Marktanteil von glasartigem Kohlenstoff in Südamerika (%), nach Anwendung, 2032 Abbildung: 109 Marktanteil von glasartigem Kohlenstoff in Südamerika (%), nach Vertriebskanal, 2023 Abbildung: 110 Marktanteil von glasartigem Kohlenstoff in Südamerika (%), nach Vertriebskanal, 2032 Abbildung: 111 Bioanalytical Systems, Inc.: Umsatzsegmentierung nach Geschäftsbereich, 2023 Abbildung: 112 Bioanalytical Systems, Inc.: Umsatzsegmentierung nach geografischer Lage Abbildung 113 : Merck KGaA: Umsatzsegmentierung nach Geschäftsbereichen, 2023; Abbildung 114: Merck KGaA: Umsatzsegmentierung nach geografischer Region, 2023; Abbildung 115: Resonac Holdings Corporation: Umsatzsegmentierung nach Geschäftsbereichen, 2023; Abbildung 116: Resonac Holdings Corporation: Umsatzsegmentierung nach geografischer Region, 2023; Abbildung 117: Tokai Carbon Co., Ltd.: Umsatzsegmentierung nach Geschäftsbereichen, 2023


Merkmale | Lizenzart | ||||
Datenbuch | Einzelbenutzer |   Mehrere Benutzer | Unternehmen | ||
| E-Zugang | ✓ | ✓ | ✓ | ✓ | |
Benutzerfreigabe | Nur für 1 Benutzer | Nur für 1 Benutzer | Bis zu 7 Benutzer | Unbegrenzter Benutzerzugriff | |
⨉ | ⨉ | ⨉ | ✓ | ||
Kostenlose Anpassung | Keine kostenlose Anpassung | Bis zu 30 Stunden Arbeit | Bis zu 60 Stunden Arbeit | Bis zu 80 Arbeitsstunden | |
Lieferformat |
| ⨉ | ✓ | ✓ | ✓ |
| ✓ | ⨉ | ✓ | ✓ | |
| ⨉ | ⨉ | ⨉ | ✓ | |
Analystenunterstützung | 2 Monate Analystenunterstützung | 4 Monate Analystenunterstützung | 7 Monate Analystenunterstützung | Ein Jahr Analystenbetreuung | |
Kostenloses Bericht-Update im nächsten Aktualisierungszyklus | ⨉ | ⨉ | ⨉ | ✓ | |
Kostenloses Branchen-Update (Innerhalb von 180 Tagen) | ⨉ | ⨉ | ⨉ | ✓ | |
Nutzen | Bis zu 10 % Rabatt nach dem Kauf | Bis zu 20 % Rabatt nach dem Kauf | Bis zu 30 % Rabatt nach dem Kauf | Bis zu 40 % Rabatt nach dem Kauf | |