Markt für Datenannotationstools in Japan: Nach Datentyp (Text, Bild, Video und Audio); nach Technologie – überwacht, halbüberwacht und automatisch); Gerätetyp (Mac OS, Windows, Linux und andere); Endnutzer (Automobilindustrie, Gesundheitswesen, Einzelhandel, Transport und Logistik und andere) – Branchendynamik, Marktgröße und Potenzialprognose für 2024–2032
- Letzte Aktualisierung: 19. Oktober 2024 | | Bericht-ID: AA0322158
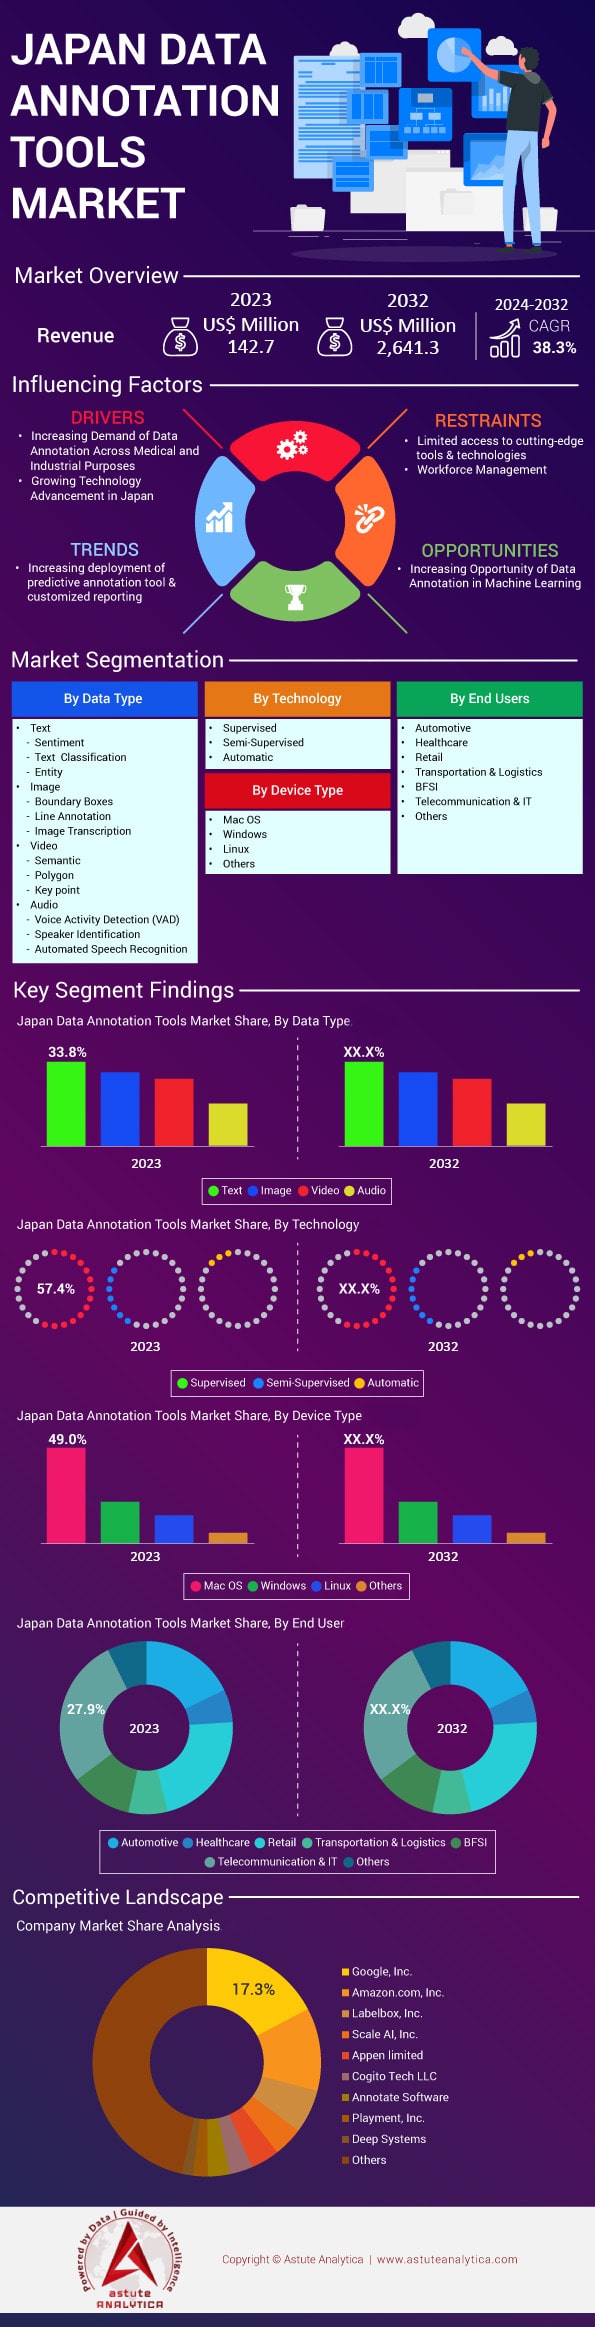
Tabelle 1. Marktgröße für Datenannotationstools in Japan (Mio. US$), nach Datentyp, 2019–2032.
Tabelle 2. Marktgröße für Datenannotationstools in Japan (Mio. US$), nach Technologie, 2019–2032.
Tabelle 3. Marktgröße für Datenannotationstools in Japan (Mio. US$), nach Gerätetyp, 2019–2032.
Tabelle 4. Marktgröße für Datenannotationstools (Mio. US$), nach Endnutzer, 2019–2032.
Tabelle 5. Alphabet Inc.: Finanzanalyse.
Tabelle 6. Google LLC: Analyse der Preispläne (Etikettierungskosten).
Tabelle 7. Labelbox, Inc.: Analyse der Preispläne.
Tabelle 8. LightTag: Analyse der Preispläne.
Tabelle 9. Annotate.com: Analyse der Preispläne.
Tabelle 10. Appen Limited: Finanzanalyse.
Tabelle 11. Appen Limited: Analyse der Preispläne
Tabelle 12. CloudFactory Limited: Analyse der Preispläne.
Tabelle 13. CloudApp: Analyse der Preispläne.
Tabelle 14.tagtog Sp. z oo: Analyse der Preispläne (Cloud-Abonnement)
Tabelle 15.tagtog Sp. z oo: Analyse der Preispläne (On-Premise-Abonnement)
Abbildung 1: Zusammenfassung: Markt für Datenannotationstools in Japan, Wert (Mio. US$), 2019–2032 Abbildung 2: F&E-Ausgaben in Japan (% des BIP) Abbildung 3: Städtische Bevölkerung in Japan (% der Gesamtbevölkerung) Abbildung 4: Auswirkungen von Covid-19 auf den Markt für Datenannotationstools in Japan und Erholung, 2019–2032 (in %) Abbildung 5: Produktpreisanalyse Abbildung 6: Marktanteilsanalyse nach Unternehmen, basierend auf dem Umsatz (2020) Abbildung 7: Marktanalyse für Datenannotationstools in Japan, nach Datentyp, CAGR (%), 2023–2032 Abbildung 8: Marktanteil für Datenannotationstools in Japan (%), nach Datentyp, 2023 Abbildung 9: Marktanteil für Datenannotationstools in Japan (%), nach Datentyp, 2032 Abbildung 10: Marktanalyse für Datenannotationstools in Japan, nach Technologie, CAGR (%), 2023–2032 Abbildung 11: Markt für Datenannotationstools in Japan Marktanteil (%) nach Technologie, 2023 Abbildung 12: Marktanteil (%) des japanischen Marktes für Datenannotationstools nach Technologie, 2032 Abbildung 13: Marktanalyse für Datenannotationstools in Japan nach Gerätetyp, CAGR (%), 2023–2032 Abbildung 14: Marktanteil (%) des japanischen Marktes für Datenannotationstools nach Gerätetyp, 2023 Abbildung 15: Marktanteil (%) des japanischen Marktes für Datenannotationstools nach Gerätetyp, 2032 Abbildung 16: Marktanalyse für Datenannotationstools in Japan nach Endnutzer, CAGR (%), 2023–2032 Abbildung 17: Marktanteil (%) des japanischen Marktes für Datenannotationstools nach Endnutzer, 2023 Abbildung 18: Marktanteil (%) des japanischen Marktes für Datenannotationstools nach Endnutzer, 2032 Abbildung 19: Alphabet Inc.: Umsatzsegmentierung, 2023 Abbildung 20 : Alphabet Inc.: Geografische Umsatzsegmentierung, 2023 21:Appen Limited: Umsatzsegmentierung nach Geschäftsbereichen, 2023 Abbildung 22:Appen Limited: Geografische Umsatzsegmentierung, 2023


Merkmale | Lizenzart | ||||
Datenbuch | Einzelbenutzer |   Mehrere Benutzer | Unternehmen | ||
| E-Zugang | ✓ | ✓ | ✓ | ✓ | |
Benutzerfreigabe | Nur für 1 Benutzer | Nur für 1 Benutzer | Bis zu 7 Benutzer | Unbegrenzter Benutzerzugriff | |
⨉ | ⨉ | ⨉ | ✓ | ||
Kostenlose Anpassung | Keine kostenlose Anpassung | Bis zu 30 Stunden Arbeit | Bis zu 60 Stunden Arbeit | Bis zu 80 Arbeitsstunden | |
Lieferformat |
| ⨉ | ✓ | ✓ | ✓ |
| ✓ | ⨉ | ✓ | ✓ | |
| ⨉ | ⨉ | ⨉ | ✓ | |
Analystenunterstützung | 2 Monate Analystenunterstützung | 4 Monate Analystenunterstützung | 7 Monate Analystenunterstützung | Ein Jahr Analystenbetreuung | |
Kostenloses Bericht-Update im nächsten Aktualisierungszyklus | ⨉ | ⨉ | ⨉ | ✓ | |
Kostenloses Branchen-Update (Innerhalb von 180 Tagen) | ⨉ | ⨉ | ⨉ | ✓ | |
Nutzen | Bis zu 10 % Rabatt nach dem Kauf | Bis zu 20 % Rabatt nach dem Kauf | Bis zu 30 % Rabatt nach dem Kauf | Bis zu 40 % Rabatt nach dem Kauf | |