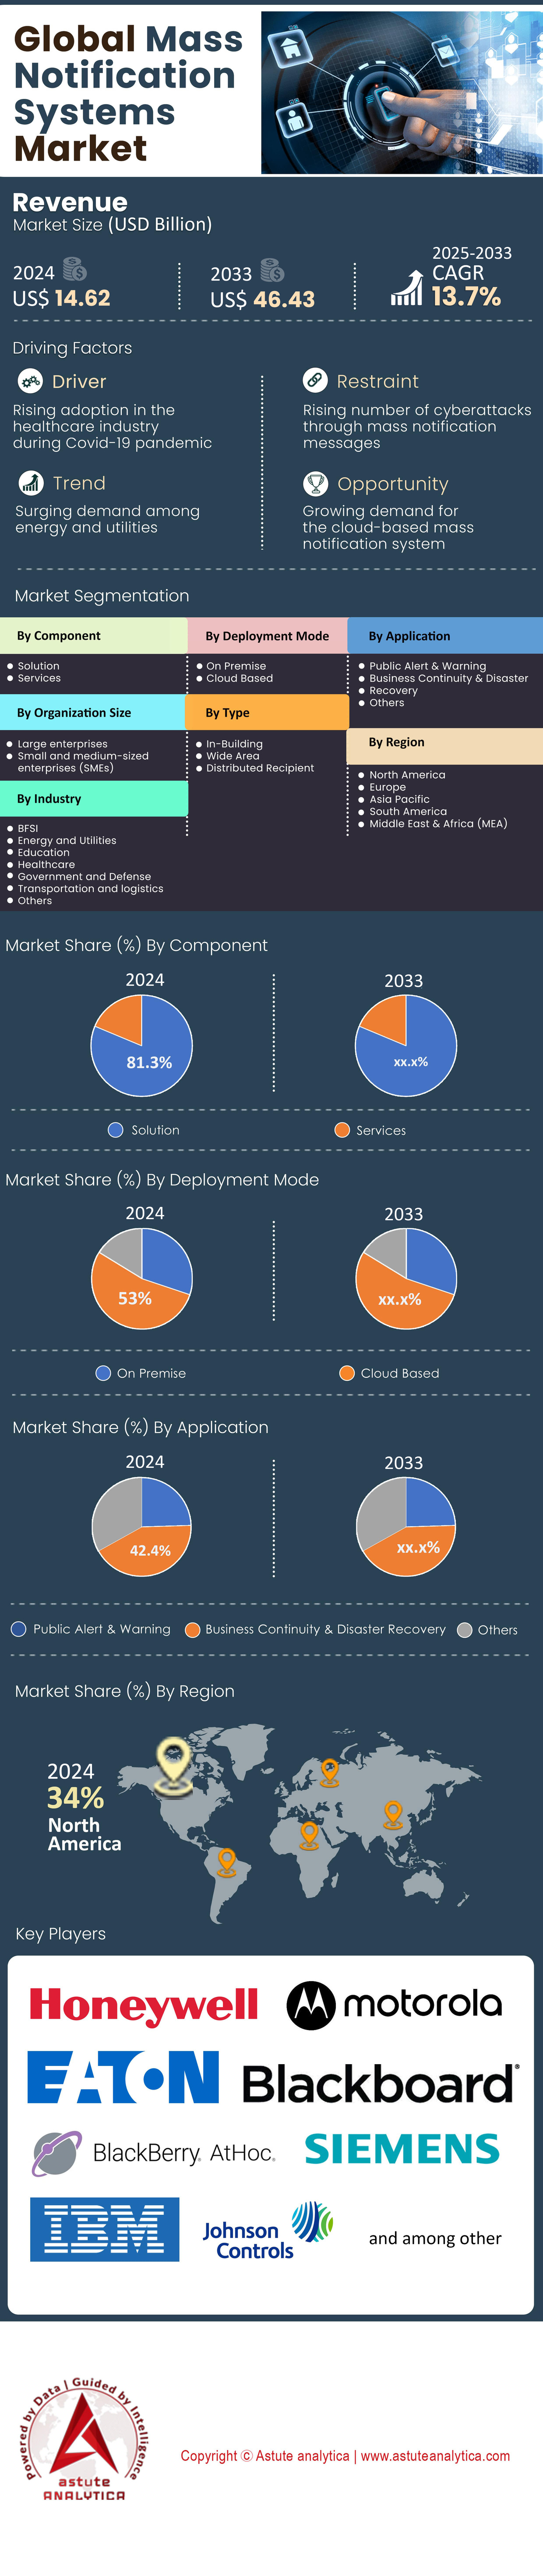
Markt für Massenbenachrichtigungssysteme: Nach Komponenten (Lösungen und Dienstleistungen); Bereitstellung (lokal und Cloud-basiert); Anwendung (öffentliche Warnungen, Geschäftskontinuität und Notfallwiederherstellung sowie Sonstige); Unternehmensgröße (Großunternehmen und KMU); Typ (Gebäudebenachrichtigung, Weitbereichsbenachrichtigung und verteilte Empfängerbenachrichtigung); Branche (Banken, Finanzdienstleistungen und Versicherungen, Energie und Versorgung, Bildungswesen und Sonstige); Region – Marktgröße, Branchendynamik, Chancenanalyse und Prognose für 2025–2033
- Letzte Aktualisierung: 17. Mai 2025 | | Bericht-ID: AA0622276
Tabelle 1. Weltweiter Markt für Massenbenachrichtigungssysteme (Mio. US$), nach Komponente, 2020–2033 Tabelle 2. Weltweiter Markt für Massenbenachrichtigungssysteme (Mio. US$), nach Bereitstellungsmodus, 2020–2033 Tabelle 3. Weltweiter Markt für Massenbenachrichtigungssysteme (Mio. US$), nach Anwendung, 2020–2033 Tabelle 4. Weltweiter Markt für Massenbenachrichtigungssysteme (Mio. US$), nach Unternehmensgröße, 2020–2033 Tabelle 5. Weltweiter Markt für Massenbenachrichtigungssysteme (Mio. US$), nach Typ, 2020–2033 Tabelle 6. Weltweiter Markt für Massenbenachrichtigungssysteme (Mio. US$), nach Branche, 2020–2033 Tabelle 7. Weltweiter Markt für Massenbenachrichtigungssysteme (Mio. US$), nach Region, 2020–2033 Tabelle 8. Marktgröße für Massenbenachrichtigungssysteme in Nordamerika (Mio. US$), nach Land, 2020–2033 Tabelle 9. Massenbenachrichtigungssysteme in Nordamerika Marktgröße für Massenbenachrichtigungssysteme (Mio. US$), nach Komponente, 2020–2033 Tabelle 10. Marktgröße für Massenbenachrichtigungssysteme in Nordamerika (Mio. US$), nach Bereitstellungsmodus, 2020–2033 Tabelle 11. Marktgröße für Massenbenachrichtigungssysteme in Nordamerika (Mio. US$), nach Anwendung, 2020–2033 Tabelle 12. Marktgröße für Massenbenachrichtigungssysteme in Nordamerika (Mio. US$), nach Unternehmensgröße, 2020–2033 Tabelle 13. Marktgröße für Massenbenachrichtigungssysteme in Nordamerika (Mio. US$), nach Typ, 2020–2033 Tabelle 14. Marktgröße für Massenbenachrichtigungssysteme in Nordamerika (Mio. US$), nach Branche, 2020–2033 Tabelle 15. Marktgröße für Massenbenachrichtigungssysteme in Europa (Mio. US$), nach Land, 2020–2033 Tabelle 16. Marktgröße für Massenbenachrichtigungssysteme in Europa (Mio. US$), nach Komponente, 2020–2033 17. Marktgröße für Massenbenachrichtigungssysteme in Europa (Mio. US$), nach Bereitstellungsart, 2020–2033 Tabelle 18. Marktgröße für Massenbenachrichtigungssysteme in Europa (Mio. US$), nach Anwendung, 2020–2033 Tabelle 19. Marktgröße für Massenbenachrichtigungssysteme in Europa (Mio. US$), nach Unternehmensgröße, 2020–2033 Tabelle 20. Marktgröße für Massenbenachrichtigungssysteme in Europa (Mio. US$), nach Typ, 2020–2033 Tabelle 21. Marktgröße für Massenbenachrichtigungssysteme in Europa (Mio. US$), nach Branche, 2020–2033 Tabelle 22. Marktgröße für Massenbenachrichtigungssysteme im asiatisch-pazifischen Raum (Mio. US$), nach Land, 2020–2033 Tabelle 23. Marktgröße für Massenbenachrichtigungssysteme im asiatisch-pazifischen Raum (Mio. US$), nach Komponente, 2020–2033 Tabelle 24. Marktgröße für Massenbenachrichtigungssysteme im asiatisch-pazifischen Raum (Mio. US$), nach Bereitstellungsart Tabelle 25. Marktgröße für Massenbenachrichtigungssysteme im asiatisch-pazifischen Raum (Mio. US$), nach Anwendung, 2020–2033 Tabelle 26. Marktgröße für Massenbenachrichtigungssysteme im asiatisch-pazifischen Raum (Mio. US$), nach Unternehmensgröße, 2020–2033 Tabelle 27. Marktgröße für Massenbenachrichtigungssysteme im asiatisch-pazifischen Raum (Mio. US$), nach Typ, 2020–2033 Tabelle 28. Marktgröße für Massenbenachrichtigungssysteme im asiatisch-pazifischen Raum (Mio. US$), nach Branche, 2020–2033 Tabelle 29. Marktgröße für Massenbenachrichtigungssysteme im Nahen Osten und Afrika (Mio. US$), nach Land, 2020–2033 Tabelle 30. Marktgröße für Massenbenachrichtigungssysteme im Nahen Osten und Afrika (Mio. US$), nach Komponente, 2020–2033 Tabelle 31. Marktgröße für Massenbenachrichtigungssysteme im Nahen Osten und Afrika (Mio. US$), nach Bereitstellungsmodus, 2020–2033 32. Marktgröße für Massenbenachrichtigungssysteme im Nahen Osten und Afrika (Mio. US$), nach Anwendung, 2020–2033 Tabelle 33. Marktgröße für Massenbenachrichtigungssysteme im Nahen Osten und Afrika (Mio. US$), nach Unternehmensgröße, 2020–2033 Tabelle 34. Marktgröße für Massenbenachrichtigungssysteme im Nahen Osten und Afrika (Mio. US$), nach Typ, 2020–2033 Tabelle 35. Marktgröße für Massenbenachrichtigungssysteme im Nahen Osten und Afrika (Mio. US$), nach Branche, 2020–2033 Tabelle 36. Marktgröße für Massenbenachrichtigungssysteme in Südamerika (Mio. US$), nach Land, 2020–2033 Tabelle 37. Marktgröße für Massenbenachrichtigungssysteme in Südamerika (Mio. US$), nach Komponente, 2020–2033 Tabelle 38. Marktgröße für Massenbenachrichtigungssysteme in Südamerika (Mio. US$), nach Bereitstellungsmodus, 2020–2033 Tabelle 39. Marktgröße für Massenbenachrichtigungssysteme in Südamerika (Mio. US$), nach Anwendung, 2020–2033 Tabelle 40. Marktgröße für Massenbenachrichtigungssysteme in Südamerika (Mio. US$), nach Unternehmensgröße, 2020–2033 Tabelle 41. Marktgröße für Massenbenachrichtigungssysteme in Südamerika (Mio. US$), nach Typ, 2020–2033 Tabelle 42. Marktgröße für Massenbenachrichtigungssysteme in Südamerika (Mio. US$), nach Branche, 2020–2033 Tabelle 43. BlackBerry Limited: Finanzanalyse Tabelle 44. Motorola Solutions, Inc.: Finanzanalyse Tabelle 45. Eaton Corporation PLC: Finanzanalyse Tabelle 46. Everbridge, Inc.: Finanzanalyse Tabelle 47. Johnson Controls International PLC: Finanzanalyse Tabelle 48. Siemens AG: Finanzanalyse Tabelle 49. Alphabet Inc.: Finanzanalyse Tabelle 50. Honeywell International Inc.: Finanzanalyse Tabelle 51. IBM Corporation: Finanzanalyse Tabelle 52. Ice Soft Technologies Inc.: Finanzanalyse
Abbildung 1: Weltweiter Markt für Massennetzwerksysteme, Wert (Mio. US$), 2020–2033
Abbildung 2: Weltweiter Markt für Massenbenachrichtigungssysteme, Auswirkungen von Covid-19 und Erholung, 2017–2033 (in %)
Abbildung 3: Preisanalyse nach Nutzer (Durchschnittspreis in USD)
Abbildung 4: Preisanalyse nach Gerät (Durchschnittspreis in USD)
Abbildung 5: Marktanteilsanalyse nach Unternehmen, basierend auf dem Umsatz (2020)
Abbildung 6: Weltweiter Markt für Massenbenachrichtigungssysteme, nach Komponente, CAGR (%), 2024–2033
Abbildung 7: Weltweiter Marktanteil für Massenbenachrichtigungssysteme (%), nach Komponente, 2024
Abbildung 8: Weltweiter Marktanteil für Massenbenachrichtigungssysteme (%), nach Komponente, 2033
Abbildung 9: Weltweiter Markt für Massenbenachrichtigungssysteme, nach Bereitstellungsmodus, CAGR (%), 2024–2033
Abbildung 10: Weltweiter Marktanteil für Massenbenachrichtigungssysteme (%), nach Bereitstellungsmodus, 2024
Abbildung 11: Weltweit Marktanteile von Massenbenachrichtigungssystemen (%), nach Bereitstellungsmodus, 2033
Abbildung 12: Weltweiter Markt für Massenbenachrichtigungssysteme, nach Anwendung, CAGR (%), 2024–2033
Abbildung 13: Weltweiter Marktanteil von Massenbenachrichtigungssystemen (%), nach Anwendung, 2024
Abbildung 14: Weltweiter Marktanteil von Massenbenachrichtigungssystemen (%), nach Anwendung, 2033
Abbildung 15: Weltweiter Markt für Massenbenachrichtigungssysteme, nach Unternehmensgröße, CAGR (%), 2024–2033
Abbildung 16: Weltweiter Marktanteil von Massenbenachrichtigungssystemen (%), nach Unternehmensgröße, 2024
Abbildung 17: Weltweiter Marktanteil von Massenbenachrichtigungssystemen (%), nach Unternehmensgröße, 2033
Abbildung 18: Weltweiter Markt für Massenbenachrichtigungssysteme, nach Typ, CAGR (%), 2024–2033
Abbildung 19: Weltweiter Marktanteil von Massenbenachrichtigungssystemen (%), nach Typ, 2024
Abbildung 20: Weltweiter Marktanteil von Massenbenachrichtigungssystemen (%), nach Typ, 2033
Abbildung 21: Globaler Markt für Massenbenachrichtigungssysteme, nach Branchen, CAGR (%), 2024–2033
Abbildung 22: Globaler Marktanteil für Massenbenachrichtigungssysteme (%), nach Branchen, 2024
Abbildung 23: Globaler Marktanteil für Massenbenachrichtigungssysteme (%), nach Branchen, 2033
Abbildung 24: Globaler Markt für Massenbenachrichtigungssysteme, nach Region, CAGR (%), 2024–2033
Abbildung 25: Globaler Marktanteil für Massenbenachrichtigungssysteme (%), nach Region, 2024
Abbildung 26: Globaler Marktanteil für Massenbenachrichtigungssysteme (%), nach Region, 2033
Abbildung 27: Nordamerikanischer Markt für Massenbenachrichtigungssysteme: Segment mit dem höchsten Anteil (%)
Abbildung 28: Nordamerikanischer Markt für Massenbenachrichtigungssysteme: Nettopotenzialzuwachs in Mio. US$
Abbildung 29: Nordamerikanischer Markt für Massenbenachrichtigungssysteme: Wirkungsanalyse – Diagramm
Abbildung 30: Nordamerikanischer Markt für Massenbenachrichtigungssysteme: Potenzialanalyse nach Komponenten
Abbildung 31: Nordamerikanischer Markt für Massenbenachrichtigungssysteme: Potenzialanalyse nach Bereitstellungsmodus
Abbildung 32: Markt für Massenbenachrichtigungssysteme in Nordamerika: Chancenanalyse nach Anwendung
Abbildung 33: Markt für Massenbenachrichtigungssysteme in Nordamerika: Chancenanalyse nach Unternehmensgröße
Abbildung 34: Markt für Massenbenachrichtigungssysteme in Nordamerika: Chancenanalyse nach Typ
Abbildung 35: Markt für Massenbenachrichtigungssysteme in Nordamerika: Chancenanalyse nach Branche Abbildung
36: Marktanteil (%) von Massenbenachrichtigungssystemen in Nordamerika nach Land, 2024
Abbildung 37: Marktanteil (%) von Massenbenachrichtigungssystemen in Nordamerika nach Land, 2033
Abbildung 38: Marktanteil (%) von Massenbenachrichtigungssystemen in Nordamerika nach Komponente, 2024
Abbildung 39: Marktanteil (%) von Massenbenachrichtigungssystemen in Nordamerika nach Komponente, 2033
Abbildung 40: Marktanteil (%) von Massenbenachrichtigungssystemen in Nordamerika nach Bereitstellungsmodus, 2024
Abbildung 41: Marktanteil (%) von Massenbenachrichtigungssystemen in Nordamerika nach Bereitstellungsmodus, 2033
Abbildung 42: Marktanteil (%) von Massenbenachrichtigungssystemen in Nordamerika nach Anwendung
Abbildung 43: Marktanteile (%) am nordamerikanischen Markt für Massenbenachrichtigungssysteme nach Anwendung,
Abbildung 44: Marktanteile (%) am nordamerikanischen Markt für Massenbenachrichtigungssysteme nach Unternehmensgröße,
Abbildung 45: Marktanteile (%) am nordamerikanischen Markt für Massenbenachrichtigungssysteme nach Unternehmensgröße, 2033
Abbildung 46: Marktanteile (%) am nordamerikanischen Markt für Massenbenachrichtigungssysteme nach Typ, 2024
Abbildung 47: Marktanteile (%) am nordamerikanischen Markt für Massenbenachrichtigungssysteme nach Typ, 2033
Abbildung 48: Marktanteile (%) am nordamerikanischen Markt für Massenbenachrichtigungssysteme nach Branche, 2024
Abbildung 49: Marktanteile (%) am nordamerikanischen Markt für Massenbenachrichtigungssysteme nach Branche, 2033
Abbildung 50: Markt für Massenbenachrichtigungssysteme in Europa: Segment mit dem höchsten Anteil (%) Abbildung
51: Markt für Massenbenachrichtigungssysteme in Europa: Nettopotenzialzuwachs in Mio. US-Dollar
Abbildung 52: Markt für Massenbenachrichtigungssysteme in Europa: Wirkungsanalyse – Diagramm
Abbildung 53: Markt für Massenbenachrichtigungssysteme in Europa: Potenzialanalyse nach
Komponenten Abbildung 54: Markt für Massenbenachrichtigungssysteme in Europa: Chancenanalyse nach Bereitstellungsmodus
Abbildung 55: Markt für Massenbenachrichtigungssysteme in Europa: Chancenanalyse nach Anwendung
Abbildung 56: Markt für Massenbenachrichtigungssysteme in Europa: Chancenanalyse nach Unternehmensgröße
Abbildung 57: Markt für Massenbenachrichtigungssysteme in Europa: Chancenanalyse nach Typ
Abbildung 58: Markt für Massenbenachrichtigungssysteme in Europa: Chancenanalyse nach Branche
Abbildung 59: Marktanteil (%) für Massenbenachrichtigungssysteme in Europa nach Land, 2024
Abbildung 60: Marktanteil (%) für Massenbenachrichtigungssysteme in Europa nach Land, 2033
Abbildung 61: Marktanteil (%) für Massenbenachrichtigungssysteme in Europa nach Komponente, 2024
Abbildung 62: Marktanteil (%) für Massenbenachrichtigungssysteme in Europa nach Komponente, 2033
Abbildung 63: Marktanteil (%) für Massenbenachrichtigungssysteme in Europa nach Bereitstellungsmodus, 2024
Abbildung 64: Marktanteil (%) für Massenbenachrichtigungssysteme in Europa nach Bereitstellungsmodus, 2033
Abbildung 65: Massenbenachrichtigungssysteme in Europa Marktanteile (%), nach Anwendung, 2024
Abbildung 66: Marktanteile von Massenbenachrichtigungssystemen in Europa (%), nach Anwendung, 2033
Abbildung 67: Marktanteile von Massenbenachrichtigungssystemen in Europa (%), nach Unternehmensgröße, 2024
Abbildung 68: Marktanteile von Massenbenachrichtigungssystemen in Europa (%), nach Unternehmensgröße, 2033
Abbildung 69: Marktanteile von Massenbenachrichtigungssystemen in Europa (%), nach Typ, 2024
Abbildung 70: Marktanteile von Massenbenachrichtigungssystemen in Europa (%), nach Typ, 2033
Abbildung 71: Marktanteile von Massenbenachrichtigungssystemen in Europa (%), nach Branchensegment, 2024
Abbildung 72: Marktanteile von Massenbenachrichtigungssystemen in Europa (%), nach Branchensegment, 2033
Abbildung 73: Markt für Massenbenachrichtigungssysteme im asiatisch-pazifischen Raum: Segment mit dem höchsten Anteil (%) Abbildung
74: Markt für Massenbenachrichtigungssysteme im asiatisch-pazifischen Raum: Nettopotenzial, in Mio. US$
Abbildung 75: Markt für Massenbenachrichtigungssysteme im asiatisch-pazifischen Raum: Wirkungsanalyse – Diagramm
Abbildung 76: Markt für Massenbenachrichtigungssysteme im asiatisch-pazifischen Raum: Potenzial Bewertung nach Komponente
Abbildung 77: Markt für Massenbenachrichtigungssysteme im asiatisch-pazifischen Raum: Chancenbewertung nach Bereitstellungsmodus
Abbildung 78: Markt für Massenbenachrichtigungssysteme im asiatisch-pazifischen Raum: Chancenbewertung nach Anwendung
Abbildung 79: Markt für Massenbenachrichtigungssysteme im asiatisch-pazifischen Raum: Chancenbewertung nach Unternehmensgröße
Abbildung 80: Markt für Massenbenachrichtigungssysteme im asiatisch-pazifischen Raum: Chancenbewertung nach Typ
Abbildung 81: Markt für Massenbenachrichtigungssysteme im asiatisch-pazifischen Raum: Chancenbewertung nach Branche
Abbildung 82: Marktanteil (%) für Massenbenachrichtigungssysteme im asiatisch-
pazifischen Raum nach Land, 2024 Abbildung 83: Marktanteil (%) für Massenbenachrichtigungssysteme im asiatisch-pazifischen Raum nach Land, 2033
Abbildung 84: Marktanteil (%) für Massenbenachrichtigungssysteme im asiatisch-pazifischen Raum nach Komponente, 2024
Abbildung 85: Marktanteil (%) für Massenbenachrichtigungssysteme im asiatisch-pazifischen Raum nach Komponente, 2033
Abbildung 86: Marktanteil (%) für Massenbenachrichtigungssysteme im asiatisch-pazifischen Raum nach Bereitstellungsmodus, 2024
Abbildung 87: Marktanteil (%) für Massenbenachrichtigungssysteme im asiatisch-pazifischen Raum nach Bereitstellung Modus, 2033
Abbildung 88: Marktanteil von Massenbenachrichtigungssystemen im asiatisch-pazifischen Raum (%), nach Anwendung, 2024
Abbildung 89: Marktanteil von Massenbenachrichtigungssystemen im asiatisch-pazifischen Raum (%), nach Anwendung, 2033
Abbildung 90: Marktanteil von Massenbenachrichtigungssystemen im asiatisch-pazifischen Raum (%), nach Unternehmensgröße, 2024
Abbildung 91: Marktanteil von Massenbenachrichtigungssystemen im asiatisch-pazifischen Raum (%), nach Unternehmensgröße, 2033
Abbildung 92: Marktanteil von Massenbenachrichtigungssystemen im asiatisch-pazifischen Raum (%), nach Typ, 2024
Abbildung 93: Marktanteil von Massenbenachrichtigungssystemen im asiatisch-pazifischen Raum (%), nach Typ, 2033
Abbildung 94: Marktanteil von Massenbenachrichtigungssystemen im asiatisch-pazifischen Raum (%), nach Branchensegment, 2024
Abbildung 95: Marktanteil von Massenbenachrichtigungssystemen im asiatisch-pazifischen Raum (%), nach Branchensegment, 2033
Abbildung 96: Markt für Massenbenachrichtigungssysteme im Nahen Osten und Afrika: Segment mit dem höchsten Anteil (%) Abbildung
97: Markt für Massenbenachrichtigungssysteme im Nahen Osten und Afrika: Nettopotenzialzuwachs in Mio. US
$ 98: Markt für Massenbenachrichtigungssysteme im Nahen Osten und Afrika: Wirkungsanalyse – Diagramm
Abbildung 99: Markt für Massenbenachrichtigungssysteme im Nahen Osten und Afrika: Chancenanalyse nach Komponente
Abbildung 100: Markt für Massenbenachrichtigungssysteme im Nahen Osten und Afrika: Chancenanalyse nach Bereitstellungsmodus
Abbildung 101: Markt für Massenbenachrichtigungssysteme im Nahen Osten und Afrika: Chancenanalyse nach Anwendung
Abbildung 102: Markt für Massenbenachrichtigungssysteme im Nahen Osten und Afrika: Chancenanalyse nach Unternehmensgröße
Abbildung 103: Markt für Massenbenachrichtigungssysteme im Nahen Osten und Afrika: Chancenanalyse nach Typ
Abbildung 104: Markt für Massenbenachrichtigungssysteme im Nahen Osten und Afrika: Chancenanalyse nach Branche
Abbildung 105: Marktanteil (%) von Massenbenachrichtigungssystemen im Nahen Osten und Afrika nach Land, 2024
Abbildung 106: Marktanteil (%) von Massenbenachrichtigungssystemen im Nahen Osten und Afrika nach Land, 2033
Abbildung 107: Marktanteil (%) von Massenbenachrichtigungssystemen im Nahen Osten und Afrika nach Komponente, 2024
Abbildung 108: Naher Osten und Marktanteile von Massenbenachrichtigungssystemen in Afrika (%), nach Komponente, 2033
Abbildung 109: Marktanteile von Massenbenachrichtigungssystemen im Nahen Osten und Afrika (%), nach Bereitstellungsmodus, 2024
Abbildung 110: Marktanteile von Massenbenachrichtigungssystemen im Nahen Osten und Afrika (%), nach Bereitstellungsmodus, 2033
Abbildung 111: Marktanteile von Massenbenachrichtigungssystemen im Nahen Osten und Afrika (%), nach Anwendung, 2024
Abbildung 112: Marktanteile von Massenbenachrichtigungssystemen im Nahen Osten und Afrika (%), nach Anwendung, 2033
Abbildung 113: Marktanteile von Massenbenachrichtigungssystemen im Nahen Osten und Afrika (%), nach Unternehmensgröße, 2024
Abbildung 114: Marktanteile von Massenbenachrichtigungssystemen im Nahen Osten und Afrika (%), nach Unternehmensgröße, 2033
Abbildung 115: Marktanteile von Massenbenachrichtigungssystemen im Nahen Osten und Afrika (%), nach Typ, 2024
Abbildung 116: Marktanteile von Massenbenachrichtigungssystemen im Nahen Osten und Afrika (%), nach Typ, 2033
Abbildung 117: Massenbenachrichtigungssysteme im Nahen Osten und Afrika Marktanteil (%), nach Branchensegment, 2024
Abbildung 118: Marktanteil (%) für Massenbenachrichtigungssysteme im Nahen Osten und Afrika, nach Branchensegment, 2033
Abbildung 119: Markt für Massenbenachrichtigungssysteme in Südamerika: Segment mit dem höchsten Anteil (%) Abbildung
120: Markt für Massenbenachrichtigungssysteme in Südamerika: Netto-Potenzialzuwachs in Mio. US$
Abbildung 121: Markt für Massenbenachrichtigungssysteme in Südamerika: Wirkungsanalyse – Diagramm
Abbildung 122: Markt für Massenbenachrichtigungssysteme in Südamerika: Potenzialanalyse nach Komponente
Abbildung 123: Markt für Massenbenachrichtigungssysteme in Südamerika: Potenzialanalyse nach Bereitstellungsmodus
Abbildung 124: Markt für Massenbenachrichtigungssysteme in Südamerika: Potenzialanalyse nach Anwendung
Abbildung 125: Markt für Massenbenachrichtigungssysteme in Südamerika: Potenzialanalyse nach Unternehmensgröße
Abbildung 126: Markt für Massenbenachrichtigungssysteme in Südamerika: Potenzialanalyse nach Typ
Abbildung 127: Markt für Massenbenachrichtigungssysteme in Südamerika: Potenzialanalyse nach Branchensegment
Abbildung 128: Markt für Massenbenachrichtigungssysteme in Südamerika Marktanteil (%), nach Land, 2024
Abbildung 129: Marktanteil von Massenbenachrichtigungssystemen in Südamerika (%), nach Land, 2033
Abbildung 130: Marktanteil von Massenbenachrichtigungssystemen in Südamerika (%), nach Komponente, 2024
Abbildung 131: Marktanteil von Massenbenachrichtigungssystemen in Südamerika (%), nach Komponente, 2033
Abbildung 132: Marktanteil von Massenbenachrichtigungssystemen in Südamerika (%), nach Bereitstellungsmodus, 2024
Abbildung 133: Marktanteil von Massenbenachrichtigungssystemen in Südamerika (%), nach Bereitstellungsmodus, 2033
Abbildung 134: Marktanteil von Massenbenachrichtigungssystemen in Südamerika (%), nach Anwendung, 2024
Abbildung 135: Marktanteil von Massenbenachrichtigungssystemen in Südamerika (%), nach Anwendung, 2033
Abbildung 136: Marktanteil von Massenbenachrichtigungssystemen in Südamerika (%), nach Unternehmensgröße, 2024
Abbildung 137: Marktanteil von Massenbenachrichtigungssystemen in Südamerika (%), nach Unternehmensgröße, 2033
Abbildung 138: Massenbenachrichtigung Marktanteile von Systemen (%), nach Typ, 2024
Abbildung 139: Marktanteile von Massenbenachrichtigungssystemen in Südamerika (%), nach Typ, 2033
Abbildung 140: Marktanteile von Massenbenachrichtigungssystemen in Südamerika (%), nach Branchensegment, 2024
Abbildung 141: Marktanteile von Massenbenachrichtigungssystemen in Südamerika (%), nach Branchensegment, 2033
Abbildung 142: BlackBerry Limited: Umsatzsegmentierung nach Geschäftskunden, 2024
Abbildung 143: BlackBerry Limited: Umsatzsegmentierung nach geografischer Region, 2024 Abbildung 144
: Motorola Solutions, Inc.: Umsatzsegmentierung nach Geschäftskunden, 2024 Abbildung
145: Motorola Solutions, Inc.: Umsatzsegmentierung nach geografischer Region,
Abbildung 146: Eaton Corporation PLC: Umsatzsegmentierung nach Geschäftskunden, 2024
Abbildung 147: Eaton Corporation PLC: Umsatzsegmentierung nach geografischer Region, 2024
Abbildung 148: Everbridge, Inc.: Umsatzsegmentierung nach Geschäftskunden, 2024
Abbildung 149: Everbridge, Inc.: Geografische Umsatzsegmentierung, 2024
(Abbildung 150): Johnson Controls International PLC: Umsatzsegmentierung, 2024
(Abbildung 151): Siemens AG: Umsatzsegmentierung, 2024 (
Abbildung 152): Siemens AG: Geografische Umsatzsegmentierung, 2024
(Abbildung 153): Alphabet Inc.: Umsatzsegmentierung, 2024 (
Abbildung 154): Alphabet Inc.: Geografische Umsatzsegmentierung, 2024
(Abbildung 155): Honeywell International Inc.: Umsatzsegmentierung, 2024 (
Abbildung 156): Honeywell International Inc.: Geografische Umsatzsegmentierung, 2024
(Abbildung 157): IBM Corporation: Umsatzsegmentierung, 2024 (
Abbildung 158): IBM Corporation: Geografische Umsatzsegmentierung, 2024
(Abbildung 159): Ice Soft Technologies Inc: Umsatzsegmentierung, 2024


Merkmale | Lizenzart | ||||
Datenbuch | Einzelbenutzer |   Mehrere Benutzer | Unternehmen | ||
| E-Zugang | ✓ | ✓ | ✓ | ✓ | |
Benutzerfreigabe | Nur für 1 Benutzer | Nur für 1 Benutzer | Bis zu 7 Benutzer | Unbegrenzter Benutzerzugriff | |
⨉ | ⨉ | ⨉ | ✓ | ||
Kostenlose Anpassung | Keine kostenlose Anpassung | Bis zu 30 Stunden Arbeit | Bis zu 60 Stunden Arbeit | Bis zu 80 Arbeitsstunden | |
Lieferformat |
| ⨉ | ✓ | ✓ | ✓ |
| ✓ | ⨉ | ✓ | ✓ | |
| ⨉ | ⨉ | ⨉ | ✓ | |
Analystenunterstützung | 2 Monate Analystenunterstützung | 4 Monate Analystenunterstützung | 7 Monate Analystenunterstützung | Ein Jahr Analystenbetreuung | |
Kostenloses Bericht-Update im nächsten Aktualisierungszyklus | ⨉ | ⨉ | ⨉ | ✓ | |
Kostenloses Branchen-Update (Innerhalb von 180 Tagen) | ⨉ | ⨉ | ⨉ | ✓ | |
Nutzen | Bis zu 10 % Rabatt nach dem Kauf | Bis zu 20 % Rabatt nach dem Kauf | Bis zu 30 % Rabatt nach dem Kauf | Bis zu 40 % Rabatt nach dem Kauf | |