Tabelle 1. Preisanalyse für ophthalmologische Geräte, 2020 (Durchschnittspreise in US$/Einheit)
Tabelle 2. Weltweiter Markt für ophthalmologische Geräte (in Tsd. Einheiten) nach Produkt, 2020–2033
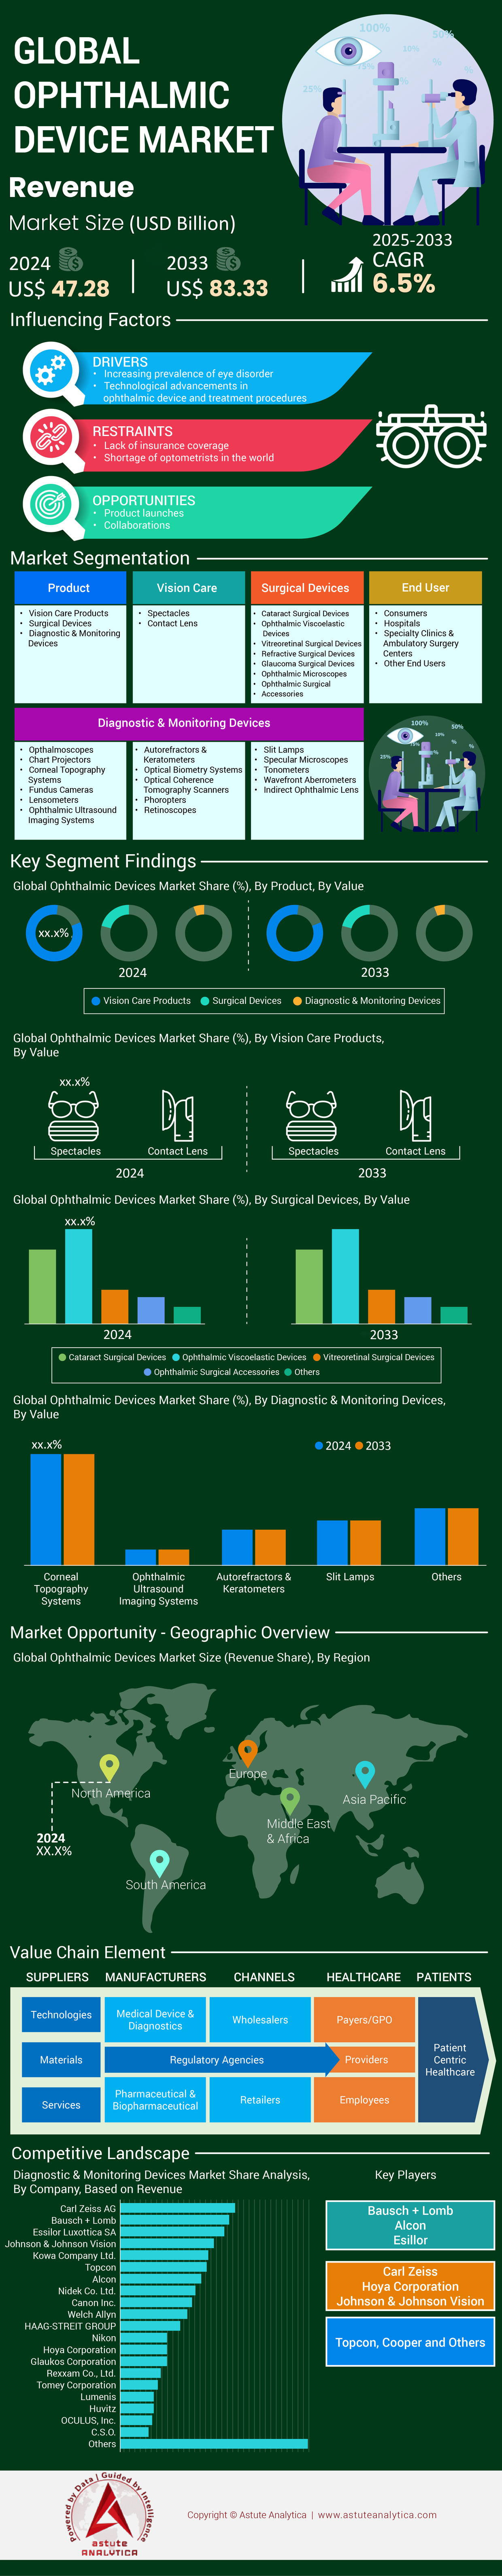
Tabelle 3. Weltweiter Markt für ophthalmologische Geräte (in Mrd. US$) nach Produkt, 2020–2033
Tabelle 4. Weltweiter Markt für ophthalmologische Geräte (in Tsd. Einheiten) nach Produkten für die Augengesundheit, 2020–2033
Tabelle 5. Weltweiter Markt für ophthalmologische Geräte (in Mrd. US$) nach Produkten für die Augengesundheit, 2020–2033
Tabelle 6. Weltweiter Markt für ophthalmologische Geräte (in Tsd. Einheiten) nach chirurgischen Geräten, 2020–2033
Tabelle 7. Weltweiter Markt für ophthalmologische Geräte (in Mrd. US$) nach chirurgischen Geräten, 2020–2033
Tabelle 8. Weltweit Marktgröße für ophthalmologische Geräte (in Tsd. Einheiten), nach Diagnose- und Überwachungsgeräten, 2020–2033
(Tabelle 9). Weltweite Marktgröße für ophthalmologische Geräte (in Mrd. US-Dollar), nach Diagnose- und Überwachungsgeräten, 2020–2033 (
Tabelle 10). Weltweite Marktgröße für ophthalmologische Geräte (in Tsd. Einheiten), nach Endnutzer, 2020–2033 (
Tabelle 11). Weltweite Marktgröße für ophthalmologische Geräte (in Mrd. US-Dollar), nach Endnutzer, 2020–2033 (
Tabelle 12). Weltweite Marktgröße für ophthalmologische Geräte (in Tsd. Einheiten), nach Region, 2020–2033 (
Tabelle 13). Weltweite Marktgröße für ophthalmologische Geräte (in Mrd. US-Dollar), nach Region, 2020–2033 (
Tabelle 14). Marktgröße für ophthalmologische Geräte in Nordamerika (in Tsd. Einheiten), nach Land, 2020–2033 (
Tabelle
Tabelle 16. Marktgröße für ophthalmologische Geräte in Nordamerika (Tsd. Einheiten), nach Produkt, 2020–2033
Tabelle 17. Marktgröße für ophthalmologische Geräte in Nordamerika (Mrd. US$), nach Produkt, 2020–2033
Tabelle 18. Marktgröße für ophthalmologische Geräte in Nordamerika (Tsd. Einheiten), nach Produkten für die Augengesundheit, 2020–2033
Tabelle 19. Marktgröße für ophthalmologische Geräte in Nordamerika (Mrd. US$), nach Produkten für die Augengesundheit, 2020–2033
Tabelle 20. Marktgröße für ophthalmologische Geräte in Nordamerika (Tsd. Einheiten), nach chirurgischen Geräten, 2020–2033
Tabelle 21. Marktgröße für ophthalmologische Geräte in Nordamerika (Tsd. Einheiten), nach Diagnose- und Überwachungsgeräten
Tabelle 22. Marktgröße für ophthalmologische Geräte in Nordamerika (Mrd. US$), nach Diagnose- und Überwachungsgeräten, 2020–2033
23. Marktgröße für ophthalmologische Geräte in Nordamerika (Mrd. US$), nach chirurgischen Geräten, 2020–2033 Tabelle 24.
Marktgröße für ophthalmologische Geräte in Nordamerika (Tsd. Einheiten), nach Endnutzer, 2020–2033
Tabelle 25. Marktgröße für ophthalmologische Geräte in Nordamerika (Mrd. US$), nach Endnutzer, 2020–2033
Tabelle 26. Marktgröße für ophthalmologische Geräte in Europa (Tsd. Einheiten), nach Land, 2020–2033
Tabelle 27. Marktgröße für ophthalmologische Geräte in Europa (Mrd. US$), nach Land, 2020–2033
Tabelle 28. Marktgröße für ophthalmologische Geräte in Europa (Tsd. Einheiten)
Tabelle 29. Marktgröße für ophthalmologische Geräte in Europa (Mrd. US$
Tabelle 30. Marktgröße für ophthalmologische Geräte in Europa (Tsd. Einheiten), nach Produkten für die Augengesundheit, 2020–2033 Tabelle 31. Marktgröße für
ophthalmologische Geräte in Europa (Mrd. US$), nach Produkten für die Augengesundheit, 2020–2033
Tabelle 32. Marktgröße für ophthalmologische Geräte in Europa (Tsd. Einheiten), nach chirurgischen Geräten, 2020–2033
Tabelle 33. Marktgröße für ophthalmologische Geräte in Europa (Mrd. US$), nach chirurgischen Geräten, 2020–2033
Tabelle 34. Marktgröße für ophthalmologische Geräte in Europa (Tsd. Einheiten), nach Diagnose- und Überwachungsgeräten, 2020–2033
Tabelle 35. Marktgröße für ophthalmologische Geräte in Europa Marktgröße für ophthalmologische Geräte (Mrd. US$), nach Diagnose- und Überwachungsgeräten, 2020–2033
Tabelle 36. Marktgröße für ophthalmologische Geräte in Europa (Tsd. Einheiten), nach Endnutzer, 2020–2033
Tabelle 37. Marktgröße für ophthalmologische Geräte in Europa (Mrd. US$), nach Endnutzer, 2020–2033
Tabelle 38. Marktgröße für ophthalmologische Geräte im asiatisch-pazifischen Raum (Tsd. Einheiten), nach Land, 2020–2033
Tabelle 39. Marktgröße für ophthalmologische Geräte im asiatisch-pazifischen Raum (Mrd. US$), nach Land, 2020–2033
Tabelle 40. Marktgröße für ophthalmologische Geräte im asiatisch-pazifischen Raum (Tsd. Einheiten), nach Produkt, 2020–2033
Tabelle 41. Marktgröße für ophthalmologische Geräte im asiatisch-pazifischen Raum (Mrd. US$), nach Produkt, 2020–2033
Tabelle 42. Marktgröße für ophthalmologische Geräte (in Tsd. Einheiten), nach Produkten für die Augengesundheit, 2020–2033
(Tabelle 43). Marktgröße für ophthalmologische Geräte im asiatisch-pazifischen Raum (in Mrd. US-Dollar), nach Produkten für die Augengesundheit, 2020–2033
(Tabelle 44). Marktgröße für ophthalmologische Geräte im asiatisch-pazifischen Raum (in Tsd. Einheiten), nach chirurgischen Geräten, 2020–2033 (
Tabelle 45). Marktgröße für ophthalmologische Geräte im asiatisch-pazifischen Raum (in Mrd. US-Dollar), nach chirurgischen Geräten, 2020–2033
(Tabelle 46). Marktgröße für ophthalmologische Geräte im asiatisch-pazifischen Raum (in Tsd. Einheiten), nach Diagnose- und Überwachungsgeräten, 2020–2033 (
Tabelle 47). Marktgröße für ophthalmologische Geräte im asiatisch-pazifischen Raum (in Mrd. US-Dollar), nach Diagnose- und Überwachungsgeräten, 2020–2033 (
Tabelle 48). Marktgröße für ophthalmologische Geräte im asiatisch-pazifischen Raum (in Tsd. Einheiten), nach
Tabelle 49. Marktgröße für ophthalmologische Geräte im asiatisch-pazifischen Raum (Mrd. US$), nach Endnutzer
Tabelle 50. Marktgröße für ophthalmologische Geräte im Nahen Osten und Afrika (Tsd. Einheiten), nach Land, 2020–2033 Tabelle 51. Marktgröße für
ophthalmologische Geräte im Nahen Osten und Afrika (Mrd. US$), nach Land, 2020–2033
Tabelle 52. Marktgröße für ophthalmologische Geräte im Nahen Osten und Afrika (Tsd. Einheiten), nach Produkt, 2020–2033
Tabelle 53. Marktgröße für ophthalmologische Geräte im Nahen Osten und Afrika (Mrd. US$), nach Produkt, 2020–2033
Tabelle 54. Marktgröße für ophthalmologische Geräte im Nahen Osten und Afrika (Mrd. US$), nach Produkten für die Augengesundheit, 2020–2033
Tabelle 55. Marktgröße für ophthalmologische Geräte im Nahen Osten und Afrika (Mrd. US$), nach Produkten für die Augengesundheit, 2020–2033
Tabelle 56. Marktgröße für ophthalmologische Geräte in der MEA-Region (Tsd. Einheiten), nach chirurgischen Geräten, 2020–2033
Tabelle 57. Marktgröße für ophthalmologische Geräte in der MEA-Region (Mrd. US$), nach chirurgischen Geräten, 2020–2033
Tabelle 58. Marktgröße für ophthalmologische Geräte in der MEA-Region (Tsd. Einheiten), nach Diagnose- und Überwachungsgeräten, 2020–2033
Tabelle 59. Marktgröße für ophthalmologische Geräte in der MEA-Region (Mrd. US$), nach Diagnose- und Überwachungsgeräten, 2020–2033
Tabelle 60. Marktgröße für ophthalmologische Geräte in der MEA-Region (Tsd. Einheiten), nach Endnutzer, 2020–2033
Tabelle 61. Marktgröße für ophthalmologische Geräte in der MEA-Region (Mrd. US$), nach Endnutzer, 2020–2033
Marktgröße für ophthalmologische Geräte in Südamerika (in Tsd. Einheiten), nach Ländern, 2020–2033.
Tabelle 63. Marktgröße für ophthalmologische Geräte in Südamerika (in Mrd. US-Dollar), nach Ländern, 2020–2033.
Tabelle 64. Marktgröße für ophthalmologische Geräte in Südamerika (in Tsd. Einheiten), nach Produkt, 2020–2033.
Tabelle 65. Marktgröße für ophthalmologische Geräte in Südamerika (in Mrd. US-Dollar), nach Produkt, 2020–2033.
Tabelle 66. Marktgröße für ophthalmologische Geräte in Südamerika (in Tsd. Einheiten), nach Produkten für die Augengesundheit, 2020–2033.
Tabelle 67. Marktgröße für ophthalmologische Geräte in Südamerika (in Mrd. US-Dollar), nach Produkten für die Augengesundheit, 2020–2033.
Tabelle 68. Marktgröße für ophthalmologische Geräte in Südamerika (in Tsd. Einheiten), nach chirurgischen Eingriffen. Geräte, 2020–2033
Tabelle 69. Marktgröße für ophthalmologische Geräte in Südamerika (Mrd. US$), nach chirurgischen Geräten, 2020–2033
Tabelle 70. Marktgröße für ophthalmologische Geräte in Südamerika (Tsd. Einheiten), nach Diagnose- und Überwachungsgeräten, 2020–2033
Tabelle 71. Marktgröße für ophthalmologische Geräte in Südamerika (Mrd. US$), nach Diagnose- und Überwachungsgeräten, 2020–2033
Tabelle 72. Marktgröße für ophthalmologische Geräte in Südamerika (Tsd. Einheiten), nach Endnutzer, 2020–2033
Tabelle 73. Marktgröße für ophthalmologische Geräte in Südamerika (Mrd. US$), nach Endnutzer, 2020–2033
Tabelle 74. Marktgröße für ophthalmologische Geräte in Japan (Tsd. Einheiten), nach Produkt, 2020–2033
Tabelle 75. Japanische ophthalmologische Geräte Marktgröße für ophthalmologische Geräte in Japan (Mrd. US$), nach Produkt, 2020–2033
Tabelle 76. Marktgröße für ophthalmologische Geräte in Japan (Tsd. Einheiten), nach Produkten für die Augengesundheit, 2020–2033
Tabelle 77. Marktgröße für ophthalmologische Geräte in Japan (Mrd. US$), nach Produkten für die Augengesundheit, 2020–2033
Tabelle 78. Marktgröße für ophthalmologische Geräte in Japan (Tsd. Einheiten), nach chirurgischen Geräten, 2020–2033
Tabelle 79. Marktgröße für ophthalmologische Geräte in Japan (Mrd. US$), nach chirurgischen Geräten, 2020–2033
Tabelle 80. Marktgröße für ophthalmologische Geräte in Japan (Tsd. Einheiten), nach Diagnose- und Überwachungsgeräten, 2020–2033
Tabelle 81. Marktgröße für ophthalmologische Geräte in Japan (Mrd. US$), nach Diagnose- und Überwachungsgeräten, 2020–2033
Marktgröße für ophthalmologische Geräte in Japan (in Tsd. Einheiten), nach Endverbraucher, 2020–2033
Tabelle 83. Marktgröße für ophthalmologische Geräte in Japan (in Mrd. US-Dollar), nach Endverbraucher, 2020–2033
Tabelle 84. Alcon: Finanzanalyse
Tabelle 85. Canon Inc.: Finanzanalyse
Tabelle 86. Carl Zeiss AG: Finanzanalyse
Tabelle 87. EssilorLuxottica SA: Finanzanalyse
Tabelle 88. NIDEK CO., LTD: Finanzanalyse
Tabelle 89. Topcon: Finanzanalyse
Tabelle 90. Hoya Corporation: Finanzanalyse
Tabelle 91. Ellex Medical Lasers Limited: Finanzanalyse
Tabelle 92. IRIDEX Corporation: Finanzanalyse
Tabelle 93. STAAR Surgical Company: Finanzanalyse
Abbildung 1. Weltweiter Markt für ophthalmologische Geräte nach Wert, 2020–2033 (Mrd. USD) Abbildung 2. Weltweiter Markt für ophthalmologische Geräte nach jährlichem Wachstum, 2020–2033 (%) Abbildung 3. Analyse der Lieferkette des globalen Marktes für ophthalmologische Geräte Abbildung 4. Bewertung der Auswirkungen von COVID-19 auf den Marktwachstumstrend Abbildung 5. Marktanteilsanalyse nach Unternehmen, basierend auf dem Umsatz (2024) Abbildung 6. Marktanteilsanalyse für Diagnose- und Überwachungsgeräte nach Unternehmen, basierend auf dem Umsatz (2024) Abbildung 7. Umsatzprognosen (Mrd. USD), 2020–2033 Abbildung 8. Absatzprognosen (Tsd. Einheiten), 2020–2033 Abbildung 9. Weltweiter Markt für ophthalmologische Geräte nach Produkt, CAGR (%), 2020–2033 Abbildung 10. Weltweiter Marktanteil für ophthalmologische Geräte (%), nach Produkt, 2024 11. Weltweiter Marktanteil für ophthalmologische Geräte (%), nach Produkt, 2033 (Abbildung 12). Weltweiter Markt für ophthalmologische Geräte, nach Produkten für die Augengesundheit, CAGR (%), 2020–2033 (Abbildung 13). Weltweiter Marktanteil für ophthalmologische Geräte (%), nach Produkten für die Augengesundheit, 2024 (Abbildung 14). Weltweiter Marktanteil für ophthalmologische Geräte (%), nach Produkten für die Augengesundheit, 2033 ( Abbildung 15). Weltweiter Markt für ophthalmologische Geräte, nach chirurgischen Geräten, CAGR (%), 2020–2033 (Abbildung 16). Weltweiter Marktanteil für ophthalmologische Geräte (%), nach chirurgischen Geräten, 2024 (Abbildung 17). Weltweiter Marktanteil für ophthalmologische Geräte (%), nach chirurgischen Geräten, 2033 (Abbildung 18). Weltweiter Markt für ophthalmologische Geräte, nach Diagnose- und Überwachungsgeräten, CAGR (%), 2020–2033 (Abbildung 19). Weltweiter Markt für ophthalmologische Geräte Marktanteil (%) nach Diagnose- und Überwachungsgeräten, 2024 (Abbildung 20). Weltweiter Marktanteil (%) nach Diagnose- und Überwachungsgeräten, 2033 ( Abbildung 21). Weltweiter Markt für ophthalmologische Geräte nach Endnutzer, CAGR (%), 2020–2033 (Abbildung 22). Weltweiter Marktanteil (%) nach Endnutzer, 2024 (Abbildung 23). Weltweiter Marktanteil (%) nach Endnutzer, 2033 (Abbildung 24). Weltweiter Markt für ophthalmologische Geräte nach Region, CAGR (%), 2020–2033 ( Abbildung 25). Weltweiter Marktanteil (%) nach Region, 2024 (Abbildung 26). Weltweiter Marktanteil (%) nach Region, 2033 (Abbildung 27). Weltweiter Marktanteil (%) nach Region, 2033 (Abbildung 28). Nordamerikanischer Markt für ophthalmologische Geräte, CAGR des Top-Segments, 2020–2033 ( Abbildung 29). Nordamerika Marktanteile ophthalmologischer Geräte (%), nach Ländern, 2024 (Abbildung 29). Marktanteile ophthalmologischer Geräte in Nordamerika (%), nach Ländern, 2033 ( Abbildung 30). Marktanteile ophthalmologischer Geräte in Nordamerika (%), nach Produkt, 2024 (Abbildung 31). Marktanteile ophthalmologischer Geräte in Nordamerika (%), nach Produkt, 2033 ( Abbildung 32). Marktanteile ophthalmologischer Geräte in Nordamerika (%), nach Endnutzer, 2024 (Abbildung 33). Marktanteile ophthalmologischer Geräte in Nordamerika (%), nach Endnutzer, 2033 ( Abbildung 34). Markt für ophthalmologische Geräte in Europa, CAGR des Top-Segments (2020–2033) (Abbildung 35). Marktanteile ophthalmologischer Geräte in Europa (%), nach Ländern, 2024 ( Abbildung 36). Marktanteile ophthalmologischer Geräte in Europa (%), nach Ländern, 2033 (Abbildung 37). Marktanteile ophthalmologischer Geräte in Europa (%), nach Produkt, 2024 Abbildung 38. Marktanteil ophthalmischer Geräte in Europa (%), nach Produkt, 2033 Abbildung 39. Marktanteil ophthalmischer Geräte in Europa (%), nach Endnutzer, 2024 Abbildung 40. Marktanteil ophthalmischer Geräte in Europa (%), nach Endnutzer, 2033 Abbildung 41. Markt für ophthalmische Geräte im asiatisch-pazifischen Raum, CAGR des Top-Segments (%), 2020–2033 Abbildung 42. Marktanteil ophthalmischer Geräte im asiatisch-pazifischen Raum (%), nach Land, 2024 Abbildung 43. Marktanteil ophthalmischer Geräte im asiatisch-pazifischen Raum (%), nach Land , 2033 Abbildung 44. Marktanteil ophthalmischer Geräte im asiatisch-pazifischen Raum (%), nach Produkt, 2024 Abbildung 45. Marktanteil ophthalmischer Geräte im asiatisch-pazifischen Raum (%), nach Endnutzer, 2024 Abbildung 47. Marktanteile (%) am Markt für ophthalmologische Geräte im asiatisch-pazifischen Raum (APAC), nach Endnutzer, 2033 (Abbildung 48). 49. Marktanteile (%) am Markt für ophthalmologische Geräte im Nahen Osten und Afrika (MEA), nach Ländern, 2024 (Abbildung 50). 51. Marktanteile (%) am Markt für ophthalmologische Geräte im Nahen Osten und Afrika, nach Ländern, 2033 ( Abbildung 51). 52. Marktanteile (%) am Markt für ophthalmologische Geräte im Nahen Osten und Afrika (MEA), nach Produkten, 2024 ( Abbildung 52). 53. Marktanteile (%) am Markt für ophthalmologische Geräte im Nahen Osten und Afrika (MEA ), nach Produkten, 2033 ( Abbildung 53) . 54. Marktanteile (%) am Markt für ophthalmologische Geräte im Nahen Osten und Afrika (MEA), nach Endnutzer, 2024 (Abbildung 54). 55. Marktanteile (%) am Markt für ophthalmologische Geräte in Südamerika, nach Top-Segment (CAGR) (2020–2033). Abbildung 56. Marktanteile ophthalmologischer Geräte in Südamerika (%), nach Ländern, 2024. Abbildung 57. Marktanteile ophthalmologischer Geräte in Südamerika (%), nach Ländern, 2033. Abbildung 58. Marktanteile ophthalmologischer Geräte in Südamerika (%), nach Produkten, 2024. Abbildung 59. Marktanteile ophthalmologischer Geräte in Südamerika (%), nach Produkten, 2033. Abbildung 60. Marktanteile ophthalmologischer Geräte in Südamerika (%), nach Endnutzern, 2024. Abbildung 61. Marktanteile ophthalmologischer Geräte in Südamerika (%), nach Endnutzern, 2033. Abbildung 62. Jährliche Wachstumsrate (CAGR) des Top-Segments im japanischen Markt für ophthalmologische Geräte (2020–2033). Abbildung 63. Marktanteile ophthalmologischer Geräte in Japan (%), nach Produkten, 2024. Abbildung 64. Marktanteile ophthalmologischer Geräte in Japan (%), nach Produkten. Abbildung 65. Marktanteil (%) ophthalmologischer Geräte in Japan nach Endnutzer, 2024. Abbildung 66. Marktanteil (%) ophthalmologischer Geräte in Japan nach Endnutzer, 2033. Abbildung 67. Alcon: Umsatzsegmentierung nach Geschäftsbereichen, 2024. Abbildung 68. Alcon: Umsatzsegmentierung nach Region, 2024. Abbildung 69. Alcon: Umsatzzusammensetzung nach Geschäftsbereich Ophthalmologische Diagnostik und Überwachung. Abbildung 70. Bausch + Lamb: Umsatzzusammensetzung nach Geschäftsbereich Ophthalmologische Diagnostik und Überwachung. Abbildung 71. Canon Inc.: Umsatzsegmentierung nach Geschäftsbereichen, 2024. Abbildung 72. Canon Inc.: Umsatzsegmentierung nach Region, 2024. Abbildung 73. Canon Inc.: Umsatzzusammensetzung nach Geschäftsbereich Ophthalmologische Diagnostik und Überwachung. Abbildung 74. Carl Zeiss AG: Umsatzsegmentierung nach Geschäftsbereichen, 2024. Abbildung 75. Carl Zeiss AG: Umsatzsegmentierung nach Region, 2024. 76. Carl Zeiss AG: Umsatzzusammensetzung nach Geschäftsbereich Ophthalmologische Diagnostik und Monitoring (Abbildung 77). EssilorLuxottica SA: Umsatzsegmentierung, 2024 (Abbildung 78). EssilorLuxottica SA: Geografische Umsatzsegmentierung, 2024 (Abbildung 79). EssilorLuxottica SA: Umsatzzusammensetzung nach Geschäftsbereich Ophthalmologische Diagnostik und Monitoring (Abbildung 80). HAAG-STREIT Gruppe: Umsatzzusammensetzung nach Geschäftsbereich Ophthalmologische Diagnostik und Monitoring ( Abbildung 81). Johnson & Johnson Vision: Umsatzzusammensetzung nach Geschäftsbereich Ophthalmologische Diagnostik und Monitoring (Abbildung 82). Lumenis: Umsatzzusammensetzung nach Geschäftsbereich Ophthalmologische Diagnostik und Monitoring (Abbildung 83). NIDEK CO., LTD.: Umsatzsegmentierung, 2024 ( Abbildung 84). NIDEK CO., LTD.: Geografische Umsatzsegmentierung, 2024 (Abbildung 85). Nidek: Umsatzzusammensetzung nach Geschäftsbereich Ophthalmologische Diagnostik und Monitoring ( Abbildung 86). Topcon Konzern: Umsatzzusammensetzung nach Geschäftsbereich Ophthalmologische Diagnostik und Überwachung ( Abbildung 87). Topcon: Umsatzsegmentierung, 2024 (Abbildung 88). Topcon: Geografische Umsatzsegmentierung, 2024 (Abbildung 89). Marco: Umsatzzusammensetzung nach Geschäftsbereich Ophthalmologische Diagnostik und Überwachung (Abbildung 90). HEINE Optotechnik: Umsatzzusammensetzung nach Geschäftsbereich Ophthalmologische Diagnostik und Überwachung ( Abbildung 91). Hoya Corporation: Umsatzsegmentierung, 2024 (Abbildung 92). Hoya Corporation: Umsatzzusammensetzung nach Geschäftsbereich Ophthalmologische Diagnostik und Überwachung ( Abbildung 93). Keeler: Umsatzzusammensetzung nach Geschäftsbereich Ophthalmologische Diagnostik und Überwachung ( Abbildung 94). Rexxam: Umsatzzusammensetzung nach Geschäftsbereich Ophthalmologische Diagnostik und Überwachung ( Abbildung 95). Glaukos: Umsatzzusammensetzung nach Geschäftsbereich Ophthalmologische Diagnostik und Überwachung ( Abbildung 96). Inami: Umsatzzusammensetzung nach Geschäftsbereich Ophthalmologische Diagnostik und Überwachung (Abbildung 97). Volk Optical: Umsatzzusammensetzung nach Geschäftsbereich Ophthalmologische Diagnostik und Überwachung Abbildung 98. Ellex: Geografische Umsatzsegmentierung, 2019 Abbildung 99. Ellex: Umsatzzusammensetzung nach Geschäftsbereich Ophthalmologische Diagnostik und Überwachung Abbildung 100. Oculus: Umsatzzusammensetzung nach Geschäftsbereich Ophthalmologische Diagnostik und Überwachung Abbildung 101. Reichert: Umsatzzusammensetzung nach Geschäftsbereich Ophthalmologische Diagnostik und Überwachung Abbildung 102. CSO Costruzione Strumenti Oftalmici: Umsatzzusammensetzung nach Geschäftsbereich Ophthalmologische Diagnostik und Überwachung Abbildung 103. Takagi: Umsatzzusammensetzung nach Geschäftsbereich Ophthalmologische Diagnostik und Überwachung Abbildung 104. Welch Allyn: Umsatzzusammensetzung nach Geschäftsbereich Ophthalmologische Diagnostik und Überwachung Abbildung 105. Huvitz: Umsatzzusammensetzung nach Geschäftsbereich Ophthalmologische Diagnostik und Überwachung Abbildung 106. Plusoptix: Umsatzzusammensetzung nach Geschäftsbereich Ophthalmologische Diagnostik und Überwachung Abbildung 107. Tomey: Umsatzzusammensetzung nach Geschäftsbereich Ophthalmologische Diagnostik und Überwachung Abbildung 108. Luneau: Umsatzzusammensetzung nach Geschäftsbereich Ophthalmologische Diagnostik und Überwachung ( Abbildung 109). Umsatzsegmentierung nach Geschäftsbereichen, 2024 (Abbildung 110). Geografische Umsatzsegmentierung, 2024 (Abbildung 111). IRIDEX: Umsatzzusammensetzung nach Geschäftsbereich Ophthalmologische Diagnostik und Überwachung (Abbildung 112). STAAR Surgical Company: Umsatzsegmentierung nach Geschäftsbereichen, 2024 (Abbildung 113). Ziemer: Umsatzzusammensetzung nach Geschäftsbereich Ophthalmologische Diagnostik und Überwachung (Abbildung 114). Kowa: Umsatzzusammensetzung nach Geschäftsbereich Ophthalmologische Diagnostik und Überwachung (Abbildung 115). Aurolab: Umsatzzusammensetzung nach Geschäftsbereich Ophthalmologische Diagnostik und Überwachung


Merkmale | Lizenzart | ||||
Datenbuch | Einzelbenutzer |   Mehrere Benutzer | Unternehmen | ||
| E-Zugang | ✓ | ✓ | ✓ | ✓ | |
Benutzerfreigabe | Nur für 1 Benutzer | Nur für 1 Benutzer | Bis zu 7 Benutzer | Unbegrenzter Benutzerzugriff | |
⨉ | ⨉ | ⨉ | ✓ | ||
Kostenlose Anpassung | Keine kostenlose Anpassung | Bis zu 30 Stunden Arbeit | Bis zu 60 Stunden Arbeit | Bis zu 80 Arbeitsstunden | |
Lieferformat |
| ⨉ | ✓ | ✓ | ✓ |
| ✓ | ⨉ | ✓ | ✓ | |
| ⨉ | ⨉ | ⨉ | ✓ | |
Analystenunterstützung | 2 Monate Analystenunterstützung | 4 Monate Analystenunterstützung | 7 Monate Analystenunterstützung | Ein Jahr Analystenbetreuung | |
Kostenloses Bericht-Update im nächsten Aktualisierungszyklus | ⨉ | ⨉ | ⨉ | ✓ | |
Kostenloses Branchen-Update (Innerhalb von 180 Tagen) | ⨉ | ⨉ | ⨉ | ✓ | |
Nutzen | Bis zu 10 % Rabatt nach dem Kauf | Bis zu 20 % Rabatt nach dem Kauf | Bis zu 30 % Rabatt nach dem Kauf | Bis zu 40 % Rabatt nach dem Kauf | |