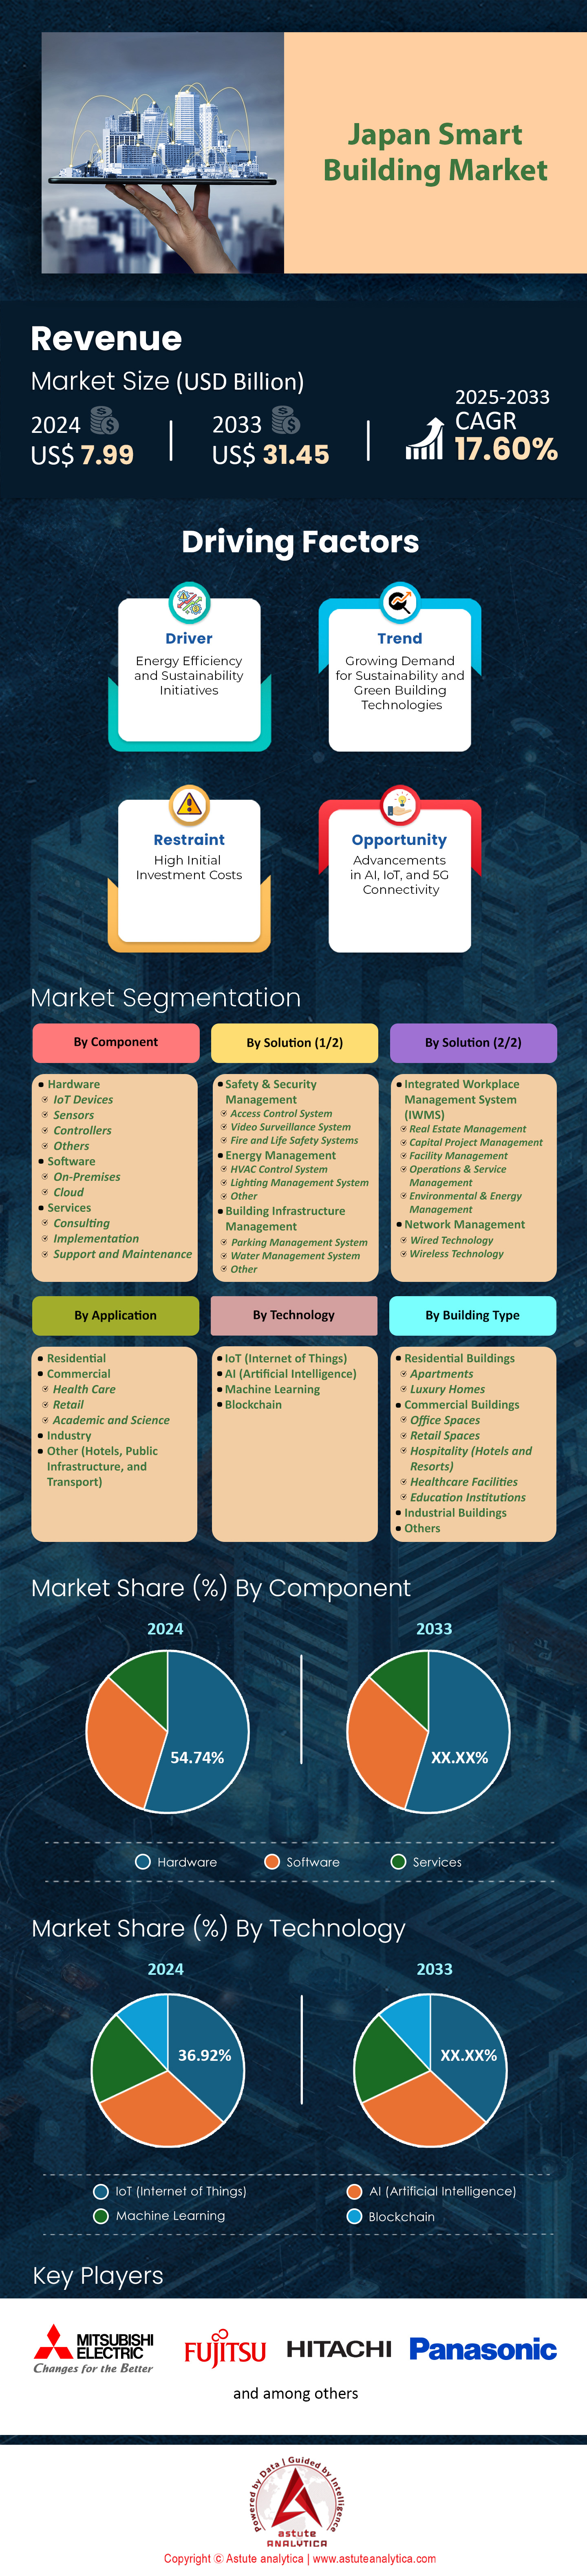
日本智能建筑市场:按组件(硬件(物联网设备、传感器、控制器等)、软件(本地部署、云端)、服务(咨询、实施、支持和维护);解决方案(安全管理(门禁系统、视频监控系统、消防和生命安全系统)、能源管理(暖通空调控制系统、照明管理系统等)、建筑基础设施管理(停车管理系统、水管理系统等)、集成工作场所管理系统(IWMS)(房地产管理、资本项目管理、设施管理、运营和服务管理、环境和能源管理)、网络管理(有线技术和无线技术);应用(住宅、商业(医疗保健、零售、学术和科研)、工业、其他(酒店、公共基础设施和交通运输));技术(物联网 (IoT)、人工智能 (AI)、机器学习、区块链);建筑类型(住宅建筑(公寓、豪华住宅)、商业建筑(办公空间、零售空间、酒店和度假村)、医疗设施、教育机构))划分。工业建筑及其他)——市场规模、行业动态、机遇分析及2025-2033年预测
- 最后更新日期:2025年3月22日 | | 报告编号:AA03251239
表1:PESTLE影响分析:政治因素
表2:PESTLE影响分析:经济因素
表3:PESTLE影响分析:社会因素
表4:PESTLE影响分析:技术因素
表5:PESTLE影响分析:法律因素
表6:PESTLE影响分析:环境因素
表7:市场动态与趋势:市场动态影响分析
表8:日本智能建筑市场规模(亿美元),按组件划分,2020-2033年
表9:日本智能建筑市场规模(亿美元),按解决方案划分,2020-2033年
表10:日本智能建筑市场规模(亿美元),按技术划分,2020-2033年
表11:日本智能建筑市场规模(亿美元),按建筑类型划分,2020-2033年
表12:ABB有限公司:近期发展
表13:ABB有限公司:产品
表14:ABB有限公司:财务分析
表15:罗伯特·博世有限公司:近期发展情况
表:16 罗伯特·博世有限公司:产品
表:17 罗伯特·博世有限公司:财务分析
表:18 思科系统公司:产品
表:19 思科系统公司:财务分析
表:20 艾默生电气公司:产品
表:21 艾默生电气公司:财务分析
表:22 日立有限公司:近期发展情况
表:23 日立有限公司:产品
表:24 日立有限公司:财务分析
表:25 霍尼韦尔国际公司:近期发展情况
表:26 霍尼韦尔国际公司:产品
表:27 霍尼韦尔国际公司:财务分析
表:28 英特尔公司:产品
表:29 英特尔公司:财务分析
表:30 江森自控:产品表
:31 江森自控:财务分析表
:32 LG电子:产品
表:33 LG电子:财务分析表
:34 施耐德电气:产品
表:35 施耐德电气:财务分析
表:36 西门子股份公司:产品
表:37 西门子股份公司:财务分析
表:38 罗格朗:产品
表:39 罗格朗:财务分析
表:40 泰利特·辛特龙:产品
表:41 其他主要参与者
表:42 附录:二手资料
图1:执行摘要:日本智能建筑市场规模及预测,2020-2033年(十亿美元)
图2:行业展望:日本最终能源消费总量(太焦耳),2022年
图3:行业展望:日本单位GDP能源供应总量(购买力平价)
图4:驱动因素:日本年度能源消费总量(千吨油当量)
图5:驱动因素:日本月度个人可支配收入(千美元)
图6:机遇:日本的技术组合
图7:趋势:截至2024年3月各城市绿色建筑百分比
图8:竞争格局:基于收入的公司市场份额分析(2024年)
图9:日本智能建筑市场(按组件划分),复合年增长率(%),2024-2033年
图10:日本智能建筑市场份额(%),按组件划分,2024年
图11:日本智能建筑市场份额(%),按组件划分
12 :日本智能建筑市场,按解决方案划分,2024-2033年复合年增长率(%);
图13:日本智能建筑市场份额(%),按解决方案划分,2024年;
图14:日本智能建筑市场份额(%),按解决方案划分,2033年;
图15:日本智能建筑市场,按技术划分,2024-2033年复合年增长率(%)
;图16:日本智能建筑市场份额(%),按技术划分,2024年
;图17:日本智能建筑市场份额(%),按技术划分,2033年
;图18:日本智能建筑市场,按建筑类型划分,2024-2033年复合年增长率(%);
图19:日本智能建筑市场份额(%),按建筑类型划分,2024年;
图20:日本智能建筑市场份额(%),按建筑类型划分,2033年;
图21:ABB有限公司:业务领域细分,2024年
。
22:ABB有限公司:2024年地域收入细分;23:罗伯特·博世有限公司:2024年业务收入细分;
24:罗伯特·博世有限公司:2024年地域收入细分;
25:思科系统公司:2024年业务收入细分
;图26:思科系统公司:2024年地域收入细分;
图27:艾默生电气公司:2024年业务领域细分
;图28:艾默生电气公司:2024年地域收入细分;
图29:日立有限公司:2024年业务收入细分;
图30:日立有限公司:2024年地域收入细分;
图31:霍尼韦尔国际公司:2024年业务收入细分;
图32:霍尼韦尔国际公司: 2024年地域收入细分
图33 英特尔公司:2024年业务收入细分
图34 英特尔公司:2024年地域收入细分
图35 江森自控:2024年业务收入细分
图36 江森自控:2024年地域收入细分
图37 LG电子:2024年业务收入细分
图38 施耐德电气:2024年业务收入细分
图39 施耐德电气:2024年地域收入细分
图40 西门子股份公司:2024年业务收入细分
图41 西门子股份公司:2024年地域收入细分
图42 罗格朗:2024年地域收入细分
图43 附录:国内生产总值(按现价计算,单位:十亿美元)
图44 附录:人均国内生产总值(按现价计算,单位:美元/人)
图45 附录:按年龄组划分的人口(单位:千人)
图46 附录:互联网用户占各年龄组的百分比
图47 附录:日本年度科技研发投入(单位:美元)
图48 附录:2021年各行业研发支出
图49 附录:日本企业技术进出口趋势(单位:美元)
图50 附录:软件支出占GDP的百分比


特征 | 许可证类型 | ||||
数据手册 | 单用户 |   多用户 | 公司的 | ||
| 电子访问 | ✓ | ✓ | ✓ | ✓ | |
用户共享 | 仅限1位用户 | 仅限1位用户 | 最多 7 位用户 | 无限制用户访问 | |
打印 | ⨉ | ⨉ | ⨉ | ✓ | |
免费定制 | 不提供免费定制服务 | 最多工作30小时 | 最多工作 60 小时 | 最多工作80小时 | |
交付物 |
| ⨉ | ✓ | ✓ | ✓ |
| ✓ | ⨉ | ✓ | ✓ | |
| ⨉ | ⨉ | ⨉ | ✓ | |
分析支持 | 2 个月分析师支持 | 4个月分析师支持 | 7 个月分析师支持 | 一年分析师支持 | |
免费报告更新即将发布 更新周期 | ⨉ | ⨉ | ⨉ | ✓ | |
免费行业动态 (180天内) | ⨉ | ⨉ | ⨉ | ✓ | |
益处 | 购买后最高可享 10% 折扣 | 购买后最高可享20%折扣 | 购买后最高可享30%折扣 | 购买后最高可享 40% 折扣 | |