Tabelle 1: Branchenausblick: Traktorenabsatzprognose, Top-Märkte, Volumen (Tsd. Einheiten) 2023–2032 Tabelle 2: Weltweiter Markt für Landwirtschaftstraktoren (Mrd. US$), nach Traktortyp, 2023–2032 Tabelle 3: Weltweiter Markt für Landwirtschaftstraktoren (Tsd. Einheiten), nach Traktortyp, 2023–2032 Tabelle 4: Weltweiter Markt für Landwirtschaftstraktoren (Mrd. US$), nach Produkt, 2023–2032 Tabelle 5: Weltweiter Markt für Landwirtschaftstraktoren (Tsd. Einheiten), nach Produkt, 2023–2032 Tabelle 6: Weltweiter Markt für Landwirtschaftstraktoren (Mrd. US$), nach Radtyp, 2023–2032 Tabelle 7: Weltweiter Markt für Landwirtschaftstraktoren (Tsd. Einheiten), nach Radtyp, 2023–2032 Tabelle 8: Weltweiter Markt für Landwirtschaftstraktoren Marktgröße (Mrd. US$), nach Motorleistung, 2023–2032 Tabelle 9: Weltweiter Markt für Landwirtschaftstraktoren (in Tsd. Einheiten), nach Motorleistung, 2023–2032 Tabelle 10: Weltweiter Markt für Landwirtschaftstraktoren (in Mrd. US$), nach Region, 2023–2032 Tabelle 11: Weltweiter Markt für Landwirtschaftstraktoren (in Mrd. US$), nach Region, 2023–2032 Tabelle 12: Marktgröße für Landwirtschaftstraktoren in Nordamerika (in Mrd. US$), nach Land, 2023–2032 Tabelle 13: Marktgröße für Landwirtschaftstraktoren in Nordamerika (in Tsd. Einheiten), nach Land, 2023–2032 Tabelle 14: Marktgröße für Landwirtschaftstraktoren in Nordamerika (in Mrd. US$), nach Traktortyp, 2023–2032 Tabelle 15: Marktgröße für Landwirtschaftstraktoren in Nordamerika (in Tsd. Einheiten), nach Traktorentyp, 2023–2032 Tabelle 16: Marktgröße für landwirtschaftliche Traktoren in Nordamerika (Mrd. US$), nach Produkt, 2023–2032 Tabelle 17: Marktgröße für landwirtschaftliche Traktoren in Nordamerika (Tsd. Einheiten), nach Produkt, 2023–2032 Tabelle 18: Marktgröße für landwirtschaftliche Traktoren in Nordamerika (Mrd. US$), nach Radtyp, 2023–2032 Tabelle 19: Marktgröße für landwirtschaftliche Traktoren in Nordamerika (Tsd. Einheiten), nach Radtyp, 2023–2032 Tabelle 20: Marktgröße für landwirtschaftliche Traktoren in Nordamerika (Mrd. US$), nach Motorleistung, 2023–2032 Tabelle 21: Marktgröße für landwirtschaftliche Traktoren in Nordamerika (Tsd. Einheiten), nach Motorleistung, 2023–2032 Tabelle 22: Marktgröße für landwirtschaftliche Traktoren in Südamerika (Mrd. US$), nach Land Tabelle 23: Marktgröße für landwirtschaftliche Traktoren in Südamerika (in Tsd. Einheiten), nach Land, 2023–2032 Tabelle 24: Marktgröße für landwirtschaftliche Traktoren in Südamerika (in Mrd. US$), nach Traktortyp, 2023–2032 Tabelle 25: Marktgröße für landwirtschaftliche Traktoren in Südamerika (in Tsd. Einheiten), nach Traktortyp, 2023–2032 Tabelle 26: Marktgröße für landwirtschaftliche Traktoren in Südamerika (in Mrd. US$), nach Produkt, 2023–2032 Tabelle 27: Marktgröße für landwirtschaftliche Traktoren in Südamerika (in Tsd. Einheiten), nach Produkt, 2023–2032 Tabelle 28: Marktgröße für landwirtschaftliche Traktoren in Südamerika (in Mrd. US$), nach Radtyp, 2023–2032 Tabelle 29: Marktgröße für landwirtschaftliche Traktoren in Südamerika (in Tsd. Einheiten), nach Radtyp Tabelle 30: Marktgröße für landwirtschaftliche Traktoren in Südamerika (Mrd. US$), nach Motorleistung, 2023–2032 Tabelle 31: Marktgröße für landwirtschaftliche Traktoren in Südamerika (Tsd. Einheiten), nach Motorleistung, 2023–2032 Tabelle 32: Marktgröße für landwirtschaftliche Traktoren in Europa (Mrd. US$), nach Land, 2023–2032 Tabelle 33: Marktgröße für landwirtschaftliche Traktoren in Europa (Tsd. Einheiten), nach Land, 2023–2032 Tabelle 34: Marktgröße für landwirtschaftliche Traktoren in Europa (Mrd. US$), nach Traktortyp, 2023–2032 Tabelle 35: Marktgröße für landwirtschaftliche Traktoren in Europa (Tsd. Einheiten), nach Traktortyp, 2023–2032 Tabelle 36: Marktgröße für landwirtschaftliche Traktoren in Europa (Mrd. US$), nach Produkt, 2023–2032 Tabelle 37 : Marktgröße für landwirtschaftliche Traktoren in Europa (in Tsd. Einheiten), nach Produkt, 2023–2032 Tabelle 38: Marktgröße für landwirtschaftliche Traktoren in Europa (in Mrd. US$), nach Radtyp, 2023–2032 Tabelle 39: Marktgröße für landwirtschaftliche Traktoren in Europa (in Tsd. Einheiten), nach Radtyp, 2023–2032 Tabelle 40: Marktgröße für landwirtschaftliche Traktoren in Europa (in Mrd. US$), nach Motorleistung, 2023–2032 Tabelle 41: Marktgröße für landwirtschaftliche Traktoren in Europa (in Tsd. Einheiten), nach Motorleistung, 2023–2032 Tabelle 42: Marktgröße für landwirtschaftliche Traktoren im asiatisch-pazifischen Raum (in Mrd. US$), nach Land, 2023–2032 Tabelle 43: Marktgröße für landwirtschaftliche Traktoren im asiatisch-pazifischen Raum (in Tsd. Einheiten), nach Land, 2023–2032 Tabelle 44: Marktgröße für landwirtschaftliche Traktoren im asiatisch-pazifischen Raum (Mrd. US$), nach Traktortyp, 2023–2032 Tabelle 45: Marktgröße für landwirtschaftliche Traktoren im asiatisch-pazifischen Raum (Tsd. Einheiten), nach Traktortyp, 2023–2032 Tabelle 46: Marktgröße für landwirtschaftliche Traktoren im asiatisch-pazifischen Raum (Mrd. US$), nach Produkt, 2023–2032 Tabelle 47: Marktgröße für landwirtschaftliche Traktoren im asiatisch-pazifischen Raum (Tsd. Einheiten), nach Produkt, 2023–2032 Tabelle 48: Marktgröße für landwirtschaftliche Traktoren im asiatisch-pazifischen Raum (Mrd. US$), nach Radtyp, 2023–2032 Tabelle 49: Marktgröße für landwirtschaftliche Traktoren im asiatisch-pazifischen Raum (Tsd. Einheiten), nach Radtyp, 2023–2032 Tabelle 50: Marktgröße für landwirtschaftliche Traktoren im asiatisch-pazifischen Raum (Mrd. US$), nach Motorleistung, 2023–2032 Tabelle 51: Marktgröße für landwirtschaftliche Traktoren im asiatisch-pazifischen Raum (in Tsd. Einheiten), nach Motorleistung, 2023–2032 Tabelle 52: Marktgröße für landwirtschaftliche Traktoren im Nahen Osten und Afrika (in Mrd. US-Dollar), nach Land, 2023–2032 Tabelle 53: Marktgröße für landwirtschaftliche Traktoren im Nahen Osten und Afrika (in Tsd. Einheiten), nach Land, 2023–2032 Tabelle 54: Marktgröße für landwirtschaftliche Traktoren im Nahen Osten und Afrika (in Mrd. US-Dollar), nach Traktortyp, 2023–2032 Tabelle 55: Marktgröße für landwirtschaftliche Traktoren im Nahen Osten und Afrika (in Tsd. Einheiten), nach Traktortyp, 2023–2032 Tabelle 56: Marktgröße für landwirtschaftliche Traktoren im Nahen Osten und Afrika (in Mrd. US-Dollar), nach Produkt, 2023–2032 Tabelle 57: Marktgröße für landwirtschaftliche Traktoren im Nahen Osten und Afrika Tabelle 58: Marktgröße für Landwirtschaftstraktoren im Nahen Osten und Afrika ( Mrd. US$), nach Radtyp, 2023–2032; Tabelle 59: Marktgröße für Landwirtschaftstraktoren im Nahen Osten und Afrika (Mrd. US$), nach Radtyp, 2023–2032; Tabelle 60: Marktgröße für Landwirtschaftstraktoren im Nahen Osten und Afrika (Mrd. US$), nach Motorleistung, 2023–2032; Tabelle 61: Marktgröße für Landwirtschaftstraktoren im Nahen Osten und Afrika (Mrd. US$), nach Motorleistung, 2023–2032; Tabelle 62: Marktgröße für Landwirtschaftstraktoren in China (Mrd. US$), nach Traktortyp, 2023–2032; Tabelle 63: Marktgröße für Landwirtschaftstraktoren in China (Mrd. US$), nach Traktortyp , 2023–2032 Tabelle 64: Marktgröße für landwirtschaftliche Traktoren in China (Mrd. US$), nach Produkt, 2023–2032 Tabelle 65: Marktgröße für landwirtschaftliche Traktoren in China (Tsd. Einheiten), nach Produkt, 2023–2032 Tabelle 66: Marktgröße für landwirtschaftliche Traktoren in China (Mrd. US$), nach Radtyp, 2023–2032 Tabelle 67: Marktgröße für landwirtschaftliche Traktoren in China (Tsd. Einheiten), nach Radtyp, 2023–2032 Tabelle 68: Marktgröße für landwirtschaftliche Traktoren in China (Mrd. US$), nach Motorleistung, 2023–2032 Tabelle 69: Marktgröße für landwirtschaftliche Traktoren in China (Tsd. Einheiten), nach Motorleistung, 2023–2032 Tabelle 70: Marktgröße für landwirtschaftliche Traktoren in Indien (Mrd. US$), nach Traktortyp, 2023–2032 Tabelle 71: Marktgröße für landwirtschaftliche Traktoren in Indien Marktgröße für Traktoren (in Tsd. Einheiten), nach Traktortyp, 2023–2032 Tabelle 72: Marktgröße für landwirtschaftliche Traktoren in Indien (in Mrd. US$), nach Produkt, 2023–2032 Tabelle 73: Marktgröße für landwirtschaftliche Traktoren in Indien (in Tsd. Einheiten), nach Produkt, 2023–2032 Tabelle 74: Marktgröße für landwirtschaftliche Traktoren in Indien (in Mrd. US$), nach Radtyp, 2023–2032 Tabelle 75: Marktgröße für landwirtschaftliche Traktoren in Indien (in Tsd. Einheiten), nach Radtyp, 2023–2032 Tabelle 76: Marktgröße für landwirtschaftliche Traktoren in Indien (in Mrd. US$), nach Motorleistung, 2023–2032 Tabelle 77: Marktgröße für landwirtschaftliche Traktoren in Indien (in Tsd. Einheiten), nach Motorleistung, 2023–2032 Tabelle 78: Japanische Landwirtschaft Marktgröße für Traktoren (Mrd. US$), nach Traktortyp, 2023–2032 Tabelle 79: Marktgröße für japanische Landwirtschaftstraktoren (Tsd. Einheiten), nach Traktortyp, 2023–2032 Tabelle 80: Marktgröße für japanische Landwirtschaftstraktoren (Mrd. US$), nach Produkt, 2023–2032 Tabelle 81: Marktgröße für japanische Landwirtschaftstraktoren (Tsd. Einheiten), nach Produkt, 2023–2032 Tabelle 82: Marktgröße für japanische Landwirtschaftstraktoren (Mrd. US$), nach Radtyp, 2023–2032 Tabelle 83: Marktgröße für japanische Landwirtschaftstraktoren (Tsd. Einheiten), nach Radtyp, 2023–2032 Tabelle 84: Marktgröße für japanische Landwirtschaftstraktoren (Mrd. US$), nach Motorleistung, 2023–2032 Tabelle 85: Marktgröße für japanische Landwirtschaftstraktoren Tabelle 86: Marktgröße für landwirtschaftliche Traktoren in ASEAN ( Mrd. US$), nach Traktortyp, 2023–2032 Tabelle 87: Marktgröße für landwirtschaftliche Traktoren in ASEAN (Mrd. US$), nach Traktortyp, 2023–2032 Tabelle 88: Marktgröße für landwirtschaftliche Traktoren in ASEAN (Mrd. US$), nach Produkt, 2023–2032 Tabelle 89: Marktgröße für landwirtschaftliche Traktoren in ASEAN (Mrd. US$), nach Produkt, 2023–2032 Tabelle 90: Marktgröße für landwirtschaftliche Traktoren in ASEAN (Mrd. US$), nach Radtyp, 2023–2032 Tabelle 91: Marktgröße für landwirtschaftliche Traktoren in ASEAN (Mrd. US$), nach Radtyp, 2023–2032 Tabelle 92: Marktgröße für landwirtschaftliche Traktoren in ASEAN Tabelle 93: Marktgröße für landwirtschaftliche Traktoren in ASEAN (in Tsd. Einheiten), nach Motorleistung, 2023–2032 Tabelle 94: Marktgröße für landwirtschaftliche Traktoren in Südkorea (in Mrd. US$) , nach Traktortyp, 2023–2032 Tabelle 95: Marktgröße für landwirtschaftliche Traktoren in Südkorea (in Tsd. Einheiten), nach Traktortyp , 2023–2032 Tabelle 96: Marktgröße für landwirtschaftliche Traktoren in Südkorea (in Mrd. US$), nach Produkt, 2023–2032 Tabelle 97: Marktgröße für landwirtschaftliche Traktoren in Südkorea (in Tsd. Einheiten), nach Produkt, 2023–2032 Tabelle 98: Marktgröße für landwirtschaftliche Traktoren in Südkorea (in Mrd. US$), nach Radtyp, 2023–2032 Tabelle 99: Marktgröße für landwirtschaftliche Traktoren in Südkorea Tabelle 100: Marktgröße für Landwirtschaftstraktoren in Südkorea (Mrd. US$), nach Motorleistung, 2023–2032; Tabelle 101: Marktgröße für Landwirtschaftstraktoren in Südkorea (Mrd. US$), nach Motorleistung, 2023–2032; Tabelle 102: Marktgröße für Landwirtschaftstraktoren in Australien und Neuseeland (Mrd. US$), nach Traktortyp, 2023–2032; Tabelle 103: Marktgröße für Landwirtschaftstraktoren in Australien und Neuseeland (Mrd. US$), nach Traktortyp, 2023–2032; Tabelle 104: Marktgröße für Landwirtschaftstraktoren in Australien und Neuseeland (Mrd. US$), nach Produkt, 2023–2032; Tabelle 105: Marktgröße für Landwirtschaftstraktoren in Australien und Neuseeland (Mrd. US$), nach Produkt 2023–2032 Tabelle 106: Marktgröße für landwirtschaftliche Traktoren in Australien und Neuseeland (Mrd. US$), nach Radtyp, 2023–2032 Tabelle 107: Marktgröße für landwirtschaftliche Traktoren in Australien und Neuseeland (Tsd. Einheiten), nach Radtyp, 2023–2032 Tabelle 108: Marktgröße für landwirtschaftliche Traktoren in Australien und Neuseeland (Mrd. US$), nach Motorleistung, 2023–2032 Tabelle 109: Marktgröße für landwirtschaftliche Traktoren in Australien und Neuseeland (Tsd. Einheiten), nach Motorleistung, 2023–2032 Tabelle 110: Marktgröße für landwirtschaftliche Traktoren in Myanmar (Mrd. US$), nach Traktortyp, 2023–2032 Tabelle 111: Marktgröße für landwirtschaftliche Traktoren in Myanmar (Tsd. Einheiten), nach Traktortyp, 2023–2032 Tabelle 112 : Marktgröße für landwirtschaftliche Traktoren in Myanmar (Mrd. US$), nach Produkt, 2023–2032 Tabelle 113: Marktgröße für landwirtschaftliche Traktoren in Myanmar (Tsd. Einheiten), nach Produkt, 2023–2032 Tabelle 114: Marktgröße für landwirtschaftliche Traktoren in Myanmar (Mrd. US$), nach Radtyp, 2023–2032 Tabelle 115: Marktgröße für landwirtschaftliche Traktoren in Myanmar (Tsd. Einheiten), nach Radtyp, 2023–2032 Tabelle 116: Marktgröße für landwirtschaftliche Traktoren in Myanmar (Mrd. US$), nach Motorleistung, 2023–2032 Tabelle 117: Marktgröße für landwirtschaftliche Traktoren in Myanmar (Tsd. Einheiten), nach Motorleistung, 2023–2032 Tabelle 118: Marktgröße für landwirtschaftliche Traktoren im übrigen Asien-Pazifik-Raum (Mrd. US$) Tabelle 119: Marktgröße für landwirtschaftliche Traktoren im übrigen Asien-Pazifik-Raum (in Tsd. Einheiten ), nach Traktortyp, 2023–2032 Tabelle 120: Marktgröße für landwirtschaftliche Traktoren im übrigen Asien-Pazifik-Raum (in Mrd. US$), nach Produkt, 2023–2032 Tabelle 121: Marktgröße für landwirtschaftliche Traktoren im übrigen Asien-Pazifik-Raum (in Tsd. Einheiten), nach Produkt, 2023–2032 Tabelle 122: Marktgröße für landwirtschaftliche Traktoren im übrigen Asien-Pazifik-Raum (in Mrd. US$), nach Radtyp, 2023–2032 Tabelle 123: Marktgröße für landwirtschaftliche Traktoren im übrigen Asien-Pazifik-Raum (in Tsd. Einheiten), nach Radtyp, 2023–2032 Tabelle 124: Marktgröße für landwirtschaftliche Traktoren im übrigen Asien-Pazifik-Raum (in Mrd. US$), nach Motorleistung, 2023 Tabelle 125 : Marktgröße für landwirtschaftliche Traktoren im übrigen Asien-Pazifik-Raum (in Tausend Einheiten), nach Motorleistung, 2023–2032; Tabelle 126: John Deere: Finanzanalyse; Tabelle 127: Case IH: Finanzanalyse; Tabelle 128: Escorts Group: Finanzanalyse; Tabelle 129: Kubota: Finanzanalyse; Tabelle 130: Claas: Finanzanalyse; Tabelle 131: Ford Motor Company: Finanzanalyse; Tabelle 132: Mahindra & Mahindra Ltd.: Finanzanalyse; Tabelle 133: Iseki & Co., Ltd.: Finanzanalyse
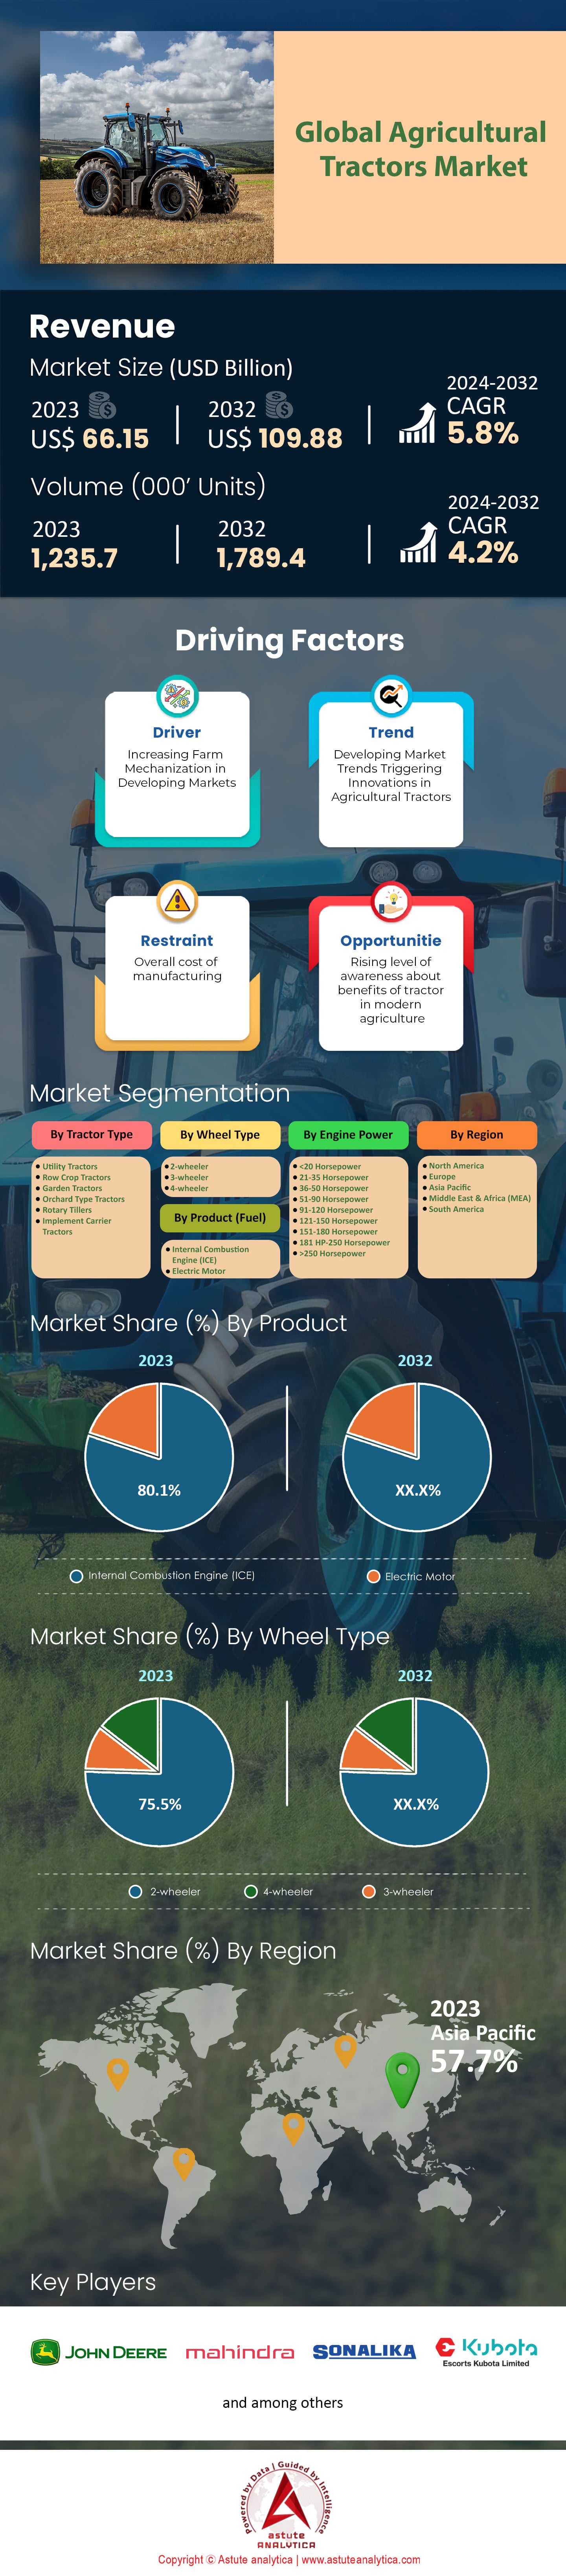
Abbildung 1: Zusammenfassung: Weltmarkt für Landwirtschaftstraktoren (nach Wert), 2019–2032 (Mio. US$)
Abbildung 2: Zusammenfassung: Weltmarkt für Landwirtschaftstraktoren (nach Volumen), 2019–2032 (Tsd. Einheiten)
Abbildung 3: Weltmarkt für Landwirtschaftstraktoren, jährliches Wachstum (%), 2018–2032
Abbildung 4: Umsatz nach Produkt (Kraftstoff) (Mio. US$)
Abbildung 5: Weltmarkt für Landwirtschaftstraktoren, Auswirkungen von Covid-19 und Erholung, 2018–2032 (jährliches Wachstum (%))
Abbildung 6: Preisanalyse nach Kategorien
Abbildung 7: Wettbewerbsübersicht: Marktanteilsanalyse nach Unternehmen, basierend auf dem Umsatz (2023)
Abbildung 8: Weltmarkt für Landwirtschaftstraktoren, nach Traktortyp, CAGR (%), 2022–2032
Abbildung 9: Weltmarktanteil für Landwirtschaftstraktoren (%), nach Traktortyp, 2023
Abbildung 10: Weltmarktanteil für Landwirtschaftstraktoren (%), nach Traktortyp
: Weltweiter Markt für Landwirtschaftstraktoren nach Produkt, CAGR (%), 2022–2032;
Abbildung 12: Weltweiter Marktanteil für Landwirtschaftstraktoren (%), nach Produkt, 2023;
Abbildung 13: Weltweiter Marktanteil für Landwirtschaftstraktoren (%), nach Produkt, 2032;
Abbildung 14: Weltweiter Markt für Landwirtschaftstraktoren nach Radtyp, CAGR (%), 2022–2032;
Abbildung 15: Weltweiter Marktanteil für Landwirtschaftstraktoren (%), nach Radtyp, 2023;
Abbildung 16: Weltweiter Marktanteil für Landwirtschaftstraktoren (%), nach Radtyp, 2032;
Abbildung 17: Weltweiter Markt für Landwirtschaftstraktoren nach Motorleistung, CAGR (%), 2022–2032; Abbildung 18
: Weltweiter Marktanteil für Landwirtschaftstraktoren (%), nach Motorleistung, 2023;
Abbildung 19: Weltweiter Marktanteil für Landwirtschaftstraktoren (%), nach Motorleistung, 2032;
Abbildung 20: Weltweiter Markt für Landwirtschaftstraktoren nach Region, CAGR (%), 2022–2032
Abbildung 21: Weltweiter Marktanteil von Landwirtschaftstraktoren (%), nach Region, 2023
Abbildung 22: Weltweiter Marktanteil von Landwirtschaftstraktoren (%), nach Region, 2032
Abbildung 23: Markt für Landwirtschaftstraktoren in Nordamerika: Segment mit dem höchsten Anteil (%) Abbildung
24: Netto-Marktpotenzial für Landwirtschaftstraktoren in Nordamerika, in Mio. US$
Abbildung 25: Marktpotenzialanalyse für Landwirtschaftstraktoren in Nordamerika, nach Produkt
Abbildung 26: Marktpotenzialanalyse für Landwirtschaftstraktoren in Nordamerika, nach Traktortyp
Abbildung 27: Marktpotenzialanalyse für Landwirtschaftstraktoren in Nordamerika, nach Radtyp
Abbildung 28: Marktpotenzialanalyse für Landwirtschaftstraktoren in Nordamerika, nach Motorleistung
Abbildung 29: Marktanteil von Landwirtschaftstraktoren in Nordamerika (%), nach Land, 2023
Abbildung 30: Marktanteil von Landwirtschaftstraktoren in Nordamerika (%), nach Land, 2032
Abbildung 31: Marktanteil von Landwirtschaftstraktoren in Nordamerika (%), nach Traktortyp
: Marktanteile nordamerikanischer Landwirtschaftstraktoren (%), nach Traktortyp, 2032
Abbildung 33: Marktanteile nordamerikanischer Landwirtschaftstraktoren (%), nach Produkt, 2023
Abbildung 34: Marktanteile nordamerikanischer Landwirtschaftstraktoren (%), nach Produkt, 2032
Abbildung 35: Marktanteile nordamerikanischer Landwirtschaftstraktoren (%), nach Radtyp, 2023 Abbildung 36
: Marktanteile nordamerikanischer Landwirtschaftstraktoren (%), nach Radtyp, 2032 Abbildung 37
: Marktanteile nordamerikanischer Landwirtschaftstraktoren (%), nach Motorleistung, 2023
Abbildung 38: Marktanteile nordamerikanischer Landwirtschaftstraktoren (%), nach Motorleistung, 2032
Abbildung 39: Markt für Landwirtschaftstraktoren in Südamerika: Segment mit dem höchsten Anteil (%) Abbildung
40: Nettopotenzial des südamerikanischen Marktes für Landwirtschaftstraktoren in Mio. US$
Abbildung 41: Bewertung des Marktpotenzials für Landwirtschaftstraktoren in Südamerika, nach Produkt
Abbildung 42: Markt für Landwirtschaftstraktoren in Südamerika Chancenanalyse nach Traktortyp
Abbildung 43: Chancenanalyse des Marktes für landwirtschaftliche Traktoren in Südamerika nach Radtyp
Abbildung 44: Chancenanalyse des Marktes für landwirtschaftliche Traktoren in Südamerika nach Motorleistung
Abbildung 45: Marktanteile (%) für landwirtschaftliche Traktoren in Südamerika nach Land, 2023
Abbildung 46: Marktanteile (%) für landwirtschaftliche Traktoren in Südamerika nach Land, 2032
Abbildung 47: Marktanteile (%) für landwirtschaftliche Traktoren in Südamerika nach Traktortyp, 2023
Abbildung 48: Marktanteile (%) für landwirtschaftliche Traktoren in Südamerika nach Traktortyp, 2032
Abbildung 49: Marktanteile (%) für landwirtschaftliche Traktoren in Südamerika nach Produkt, 2023
Abbildung 50: Marktanteile (%) für landwirtschaftliche Traktoren in Südamerika nach Produkt, 2032
Abbildung 51: Marktanteile (%) für landwirtschaftliche Traktoren in Südamerika nach Radtyp, 2023
Abbildung 52: Marktanteile (%) für landwirtschaftliche Traktoren in Südamerika nach Radtyp, 2032
Abbildung 53: Südamerika Marktanteile von Landwirtschaftstraktoren (%), nach Motorleistung, 2023
Abbildung 54: Marktanteile von Landwirtschaftstraktoren in Südamerika (%), nach Motorleistung, 2032
Abbildung 55: Markt für Landwirtschaftstraktoren in Europa: Segment mit dem höchsten Anteil (%)
Abbildung 56: Netto-Marktpotenzial für Landwirtschaftstraktoren in Europa, in Mio. US$
Abbildung 57: Marktpotenzialanalyse für Landwirtschaftstraktoren in Europa, nach Produkt
Abbildung 58: Marktpotenzialanalyse für Landwirtschaftstraktoren in
Europa, nach Traktortyp Abbildung 59: Marktpotenzialanalyse für Landwirtschaftstraktoren in Europa, nach Radtyp
Abbildung 60: Marktpotenzialanalyse für Landwirtschaftstraktoren in Europa, nach Motorleistung
Abbildung 61: Marktanteile von Landwirtschaftstraktoren in Europa (%), nach Land, 2023
Abbildung 62: Marktanteile von Landwirtschaftstraktoren in Europa (%), nach Land, 2032
Abbildung 63: Marktanteile von Landwirtschaftstraktoren in Europa (%), nach Traktortyp, 2023
Abbildung 64: Marktanteile von Landwirtschaftstraktoren in Europa (%), nach Traktortyp
: Marktanteile von Landwirtschaftstraktoren in Europa (%), nach Produkt, 2023
Abbildung 66: Marktanteile von Landwirtschaftstraktoren in Europa (%), nach Produkt, 2032
Abbildung 67: Marktanteile von Landwirtschaftstraktoren in Europa (%), nach Radtyp, 2023
Abbildung 68: Marktanteile von Landwirtschaftstraktoren in Europa (%), nach Radtyp, 2032 Abbildung 69
: Marktanteile von Landwirtschaftstraktoren in Europa (%), nach Motorleistung, 2023 Abbildung 70: Marktanteile von Landwirtschaftstraktoren in Europa (%)
, nach Motorleistung, 2032
Abbildung 71: Markt für Landwirtschaftstraktoren im asiatisch-pazifischen Raum: Segment mit dem höchsten Anteil (%)
Abbildung 72: Nettopotenzial für den Markt für Landwirtschaftstraktoren im asiatisch-pazifischen Raum, in Mio. US$
Abbildung 73: Bewertung des Marktpotenzials für Landwirtschaftstraktoren im asiatisch-pazifischen Raum, nach Produkt
Abbildung 74: Bewertung des Marktpotenzials für Landwirtschaftstraktoren im asiatisch-pazifischen Raum, nach Traktortyp
Abbildung 75: Bewertung des Marktpotenzials für Landwirtschaftstraktoren im asiatisch-pazifischen Raum, nach Radtyp
Abbildung 76: Marktpotenzialanalyse für landwirtschaftliche Traktoren im asiatisch-pazifischen Raum nach Motorleistung
Abbildung 77: Marktanteile (%) für landwirtschaftliche Traktoren im asiatisch-pazifischen Raum nach Ländern, 2023
Abbildung 78: Marktanteile (%) für landwirtschaftliche Traktoren im asiatisch
-pazifischen Raum nach Ländern, 2032 Abbildung 79: Marktanteile (%) für landwirtschaftliche Traktoren im asiatisch-pazifischen Raum nach Traktortyp, 2023
Abbildung 80: Marktanteile (%) für landwirtschaftliche Traktoren im asiatisch-pazifischen Raum nach Traktortyp, 2032
Abbildung 81: Marktanteile (%) für landwirtschaftliche Traktoren im asiatisch-pazifischen Raum nach Produkt, 2023
Abbildung 82: Marktanteile (%) für
landwirtschaftliche Traktoren im asiatisch-pazifischen Raum nach Produkt, 2032 Abbildung 83: Marktanteile (%) für landwirtschaftliche Traktoren im asiatisch-pazifischen Raum nach Radtyp, 2023
Abbildung 84: Marktanteile (%) für landwirtschaftliche Traktoren im asiatisch-pazifischen Raum nach Radtyp, 2032
Abbildung 85: Marktanteile (%) für landwirtschaftliche Traktoren im asiatisch-pazifischen Raum nach Motorleistung, 2023
Abbildung 86: Marktanteile von Landwirtschaftstraktoren im asiatisch-pazifischen Raum (%), nach Motorleistung, 2032
Abbildung 87: Markt für Landwirtschaftstraktoren im Nahen Osten und Afrika: Segment mit dem höchsten Marktanteil (%)
Abbildung 88: Netto-Marktpotenzial für Landwirtschaftstraktoren im
Nahen Osten und Afrika (in Mio. US-Dollar) Abbildung 89: Marktpotenzialanalyse für Landwirtschaftstraktoren im Nahen Osten und Afrika, nach Produkt
Abbildung 90: Marktpotenzialanalyse für Landwirtschaftstraktoren im Nahen Osten und Afrika, nach Traktortyp
Abbildung 91: Marktpotenzialanalyse für Landwirtschaftstraktoren im Nahen Osten und Afrika, nach Radtyp
Abbildung 92: Marktpotenzialanalyse für Landwirtschaftstraktoren im Nahen Osten und Afrika, nach Motorleistung
Abbildung 93: Marktanteile von Landwirtschaftstraktoren im Nahen Osten und Afrika (%), nach Land, 2023
Abbildung 94: Marktanteile von Landwirtschaftstraktoren im Nahen Osten und Afrika (%), nach Land, 2032
Abbildung 95: Marktanteile von Landwirtschaftstraktoren im Nahen Osten und Afrika (%), nach Traktortyp, 2023
Abbildung 96: Marktanteile von Landwirtschaftstraktoren im Nahen Osten und Afrika (%), nach Traktortyp, 2032
Abbildung 97: Marktanteile von Landwirtschaftstraktoren im Nahen Osten und Afrika (%), nach Produkt, 2023
Abbildung 98: Marktanteile von Landwirtschaftstraktoren im Nahen Osten und Afrika (%), nach Produkt, 2032
Abbildung 99: Marktanteile von Landwirtschaftstraktoren im Nahen Osten und Afrika (%), nach Radtyp, 2023
Abbildung 100: Marktanteile von Landwirtschaftstraktoren im Nahen Osten und Afrika (%), nach Radtyp, 2032
Abbildung 101: Marktanteile von Landwirtschaftstraktoren im Nahen Osten und Afrika (%), nach Motorleistung, 2023
Abbildung 102: Marktanteile von Landwirtschaftstraktoren im Nahen Osten und Afrika (%), nach Motorleistung, 2032
Abbildung 103: Chinesischer Markt für Landwirtschaftstraktoren: Segment mit dem höchsten Marktanteil (%) Abbildung
104: Nettopotenzial des chinesischen Marktes für Landwirtschaftstraktoren in Mio. US$
Abbildung 105: Chinesischer Markt für Landwirtschaftstraktoren Chancenanalyse nach Produkt
Abbildung 106: Chancenanalyse des chinesischen Marktes für Landwirtschaftstraktoren nach Traktortyp
Abbildung 107: Chancenanalyse des chinesischen Marktes für Landwirtschaftstraktoren nach Radtyp Abbildung
108: Chancenanalyse des chinesischen Marktes für Landwirtschaftstraktoren nach Motorleistung
Abbildung 109: Marktanteil (%) des chinesischen Marktes für Landwirtschaftstraktoren nach Traktortyp, 2023
Abbildung 110: Marktanteil (%) des chinesischen Marktes für Landwirtschaftstraktoren nach Traktortyp, 2032
Abbildung 111: Marktanteil (%) des chinesischen Marktes für Landwirtschaftstraktoren nach Produkt, 2023
Abbildung 112: Marktanteil (%) des chinesischen Marktes für Landwirtschaftstraktoren nach Produkt, 2032
Abbildung 113: Marktanteil (%) des chinesischen Marktes für Landwirtschaftstraktoren nach Radtyp, 2023
Abbildung 114: Marktanteil (%) des chinesischen Marktes für Landwirtschaftstraktoren nach Radtyp, 2032
Abbildung 115: Marktanteil (%) des chinesischen Marktes für Landwirtschaftstraktoren nach Motorleistung, 2023
Abbildung 116: China Landwirtschaft Marktanteile von Traktoren (%), nach Motorleistung, 2032
Abbildung 117: Indischer Markt für Landwirtschaftstraktoren: Segment mit dem höchsten Anteil (%) Abbildung
118: Netto-Marktpotenzial für Landwirtschaftstraktoren in Indien, in Mio. US$
Abbildung 119: Marktpotenzialanalyse für Landwirtschaftstraktoren in Indien, nach Produkt
Abbildung 120: Marktpotenzialanalyse für Landwirtschaftstraktoren in Indien, nach Traktortyp
Abbildung 121: Marktpotenzialanalyse für Landwirtschaftstraktoren in Indien, nach Radtyp Abbildung
122: Marktpotenzialanalyse für Landwirtschaftstraktoren in Indien, nach Motorleistung
Abbildung 123: Marktanteile von Landwirtschaftstraktoren in Indien (%), nach Traktortyp, 2023
Abbildung 124: Marktanteile von Landwirtschaftstraktoren in Indien (%), nach Traktortyp, 2032
Abbildung 125: Marktanteile von Landwirtschaftstraktoren in Indien (%), nach Produkt, 2023
Abbildung 126: Marktanteile von Landwirtschaftstraktoren in Indien (%), nach Produkt, 2032
Abbildung 127: Marktanteile indischer Landwirtschaftstraktoren (%), nach Radtyp, 2023
Abbildung 128: Marktanteile indischer Landwirtschaftstraktoren (%), nach Radtyp, 2032
Abbildung 129: Marktanteile indischer Landwirtschaftstraktoren (%), nach Motorleistung, 2023
Abbildung 130: Marktanteile indischer Landwirtschaftstraktoren (%), nach Motorleistung, 2032
Abbildung 131: Japanischer Markt für Landwirtschaftstraktoren: Segment mit dem höchsten Anteil (%) Abbildung
132: Netto-Marktpotenzial für Landwirtschaftstraktoren in Japan, in Mio. US$
Abbildung 133: Marktpotenzialanalyse für Landwirtschaftstraktoren in Japan, nach Produkt
Abbildung 134: Marktpotenzialanalyse für Landwirtschaftstraktoren in Japan, nach Traktortyp
Abbildung 135: Marktpotenzialanalyse für Landwirtschaftstraktoren in Japan, nach Radtyp Abbildung
136: Marktpotenzialanalyse für Landwirtschaftstraktoren in Japan, nach Motorleistung
Abbildung 137: Marktanteile japanischer Landwirtschaftstraktoren (%), nach Traktortyp
: Marktanteil japanischer Landwirtschaftstraktoren (%), nach Traktortyp, 2032
Abbildung 139: Marktanteil japanischer Landwirtschaftstraktoren (%), nach Produkt, 2023
Abbildung 140: Marktanteil japanischer Landwirtschaftstraktoren (%), nach Produkt, 2032
Abbildung 141: Marktanteil japanischer Landwirtschaftstraktoren (%), nach Radtyp, 2023
Abbildung 142: Marktanteil japanischer Landwirtschaftstraktoren (%), nach Radtyp, 2032
Abbildung 143: Marktanteil japanischer Landwirtschaftstraktoren (%), nach Motorleistung, 2023 Abbildung 144
: Marktanteil japanischer Landwirtschaftstraktoren (%), nach Motorleistung, 2032 Abbildung
145: ASEAN-Markt für Landwirtschaftstraktoren: Segment mit dem höchsten Anteil (%) Abbildung
146: Nettopotenzial des ASEAN-Marktes für Landwirtschaftstraktoren in Mio. US$
Abbildung 147: Bewertung des Marktpotenzials für Landwirtschaftstraktoren in ASEAN nach Produkt
Abbildung 148: ASEAN-Landwirtschaft Marktpotenzialanalyse für Traktoren nach Traktortyp (
Abbildung 149): Marktpotenzialanalyse für landwirtschaftliche Traktoren in ASEAN nach Radtyp (Abbildung
150): Marktpotenzialanalyse für landwirtschaftliche Traktoren in ASEAN nach Motorleistung
(Abbildung 151): Marktanteile landwirtschaftlicher Traktoren in ASEAN (%) nach Traktortyp, 2023
(Abbildung 152): Marktanteile landwirtschaftlicher Traktoren in ASEAN (%) nach Traktortyp, 2032
(Abbildung 153): Marktanteile landwirtschaftlicher Traktoren in ASEAN (%) nach Produkt, 2023
(Abbildung 154): Marktanteile landwirtschaftlicher Traktoren in ASEAN (%) nach Produkt, 2032
(Abbildung 155): Marktanteile landwirtschaftlicher Traktoren in ASEAN (%) nach Radtyp, 2023
(Abbildung 156): Marktanteile landwirtschaftlicher Traktoren in ASEAN (%) nach Radtyp, 2032
(Abbildung 157): Marktanteile landwirtschaftlicher Traktoren in ASEAN (%) nach Motorleistung, 2023
(Abbildung 158): Marktanteile landwirtschaftlicher Traktoren in ASEAN (%), nach Motorleistung, 2032
Abbildung 159: Südkoreanischer Markt für Landwirtschaftstraktoren: Segment mit dem höchsten Anteil (%) Abbildung
160: Netto-Marktpotenzial für Landwirtschaftstraktoren in Südkorea, in Mio. US$
Abbildung 161: Marktpotenzialanalyse für Landwirtschaftstraktoren in Südkorea, nach Produkt
Abbildung 162: Marktpotenzialanalyse für Landwirtschaftstraktoren in Südkorea, nach Traktortyp
Abbildung 163: Marktpotenzialanalyse für Landwirtschaftstraktoren in Südkorea, nach Radtyp Abbildung
164: Marktpotenzialanalyse für Landwirtschaftstraktoren in Südkorea, nach Motorleistung
Abbildung 165: Marktanteil (%) für Landwirtschaftstraktoren in Südkorea, nach Traktortyp, 2023
Abbildung 166: Marktanteil (%) für Landwirtschaftstraktoren in Südkorea, nach Traktortyp, 2032
Abbildung 167: Marktanteil (%) für Landwirtschaftstraktoren in Südkorea, nach Produkt, 2023
Abbildung 168: Marktanteil (%) für Landwirtschaftstraktoren in Südkorea, nach Produkt, 2032
Abbildung 169: Südkorea Marktanteile von Landwirtschaftstraktoren in Korea (%), nach Radtyp, 2023
(Abbildung 170): Marktanteile von Landwirtschaftstraktoren in Südkorea (%), nach Radtyp, 2032
(Abbildung 171): Marktanteile von Landwirtschaftstraktoren in Südkorea (%), nach Motorleistung, 2023
(Abbildung 172): Marktanteile von Landwirtschaftstraktoren in Südkorea (%), nach Motorleistung, 2032
(Abbildung 173): Landwirtschaftstraktorenmarkt in Australien und Neuseeland: Segment mit dem höchsten Anteil (%)
(Abbildung 174): Netto-Zuwachs des Marktes für Landwirtschaftstraktoren in Australien und Neuseeland (in Mio. US$) (
Abbildung 175): Marktpotenzialanalyse für Landwirtschaftstraktoren in Australien und Neuseeland, nach Produkt
(Abbildung 176): Marktpotenzialanalyse für Landwirtschaftstraktoren in Australien und Neuseeland, nach Traktortyp
(Abbildung 177): Marktpotenzialanalyse für Landwirtschaftstraktoren in Australien und Neuseeland, nach Radtyp (
Abbildung 178): Marktpotenzialanalyse für Landwirtschaftstraktoren in Australien und Neuseeland, nach Motorleistung
Abbildung 179: Marktanteile von Landwirtschaftstraktoren in Australien und Neuseeland (%), nach Traktortyp, 2023
Abbildung 180: Marktanteile von Landwirtschaftstraktoren in Australien und Neuseeland (%), nach Traktortyp, 2032
Abbildung 181: Marktanteile von Landwirtschaftstraktoren in Australien und Neuseeland (%), nach Produkt, 2023
Abbildung 182: Marktanteile von Landwirtschaftstraktoren in Australien und Neuseeland (%), nach Produkt, 2032
Abbildung 183: Marktanteile von Landwirtschaftstraktoren in Australien und Neuseeland (%), nach Radtyp, 2023
Abbildung 184: Marktanteile von Landwirtschaftstraktoren in Australien und Neuseeland (%), nach Radtyp, 2032
Abbildung 185: Marktanteile von Landwirtschaftstraktoren in Australien und Neuseeland (%), nach Motorleistung, 2023
Abbildung 186: Marktanteile von Landwirtschaftstraktoren in Australien und Neuseeland (%), nach Motorleistung, 2032
Abbildung 187: Markt für Landwirtschaftstraktoren in Myanmar: Höchster Marktanteil (%) Segment
Abbildung 188: Nettopotenzial für den Markt für landwirtschaftliche Traktoren in Myanmar (in Mio. US$)
Abbildung 189: Marktpotenzialanalyse für landwirtschaftliche Traktoren in Myanmar nach Produkt
Abbildung 190: Marktpotenzialanalyse für landwirtschaftliche Traktoren
in Myanmar nach Traktortyp Abbildung 191: Marktpotenzialanalyse für
landwirtschaftliche Traktoren in Myanmar nach Radtyp Abbildung 192: Marktpotenzialanalyse für landwirtschaftliche Traktoren in Myanmar nach Motorleistung
Abbildung 193: Marktanteil (%) für landwirtschaftliche Traktoren in Myanmar nach Traktortyp, 2023
Abbildung 194: Marktanteil (%) für landwirtschaftliche Traktoren in Myanmar nach Traktortyp, 2032
Abbildung 195: Marktanteil (%) für landwirtschaftliche Traktoren in Myanmar nach Produkt, 2023
Abbildung 196: Marktanteil (%) für landwirtschaftliche Traktoren in Myanmar nach Produkt, 2032
Abbildung 197: Marktanteil (%) für landwirtschaftliche Traktoren in Myanmar nach Radtyp
: Marktanteile von Landwirtschaftstraktoren in Myanmar (%), nach Radtyp, 2023;
Abbildung 199: Marktanteile von Landwirtschaftstraktoren in Myanmar (%), nach Motorleistung, 2023;
Abbildung 200: Marktanteile von Landwirtschaftstraktoren in Myanmar (%), nach Motorleistung, 2032;
Abbildung 201: Landwirtschaftstraktorenmarkt im übrigen Asien-Pazifik-Raum: Segment mit dem höchsten Anteil (%);
Abbildung 202: Nettopotenzial für den Landwirtschaftstraktorenmarkt im übrigen Asien-Pazifik-Raum (in Mio. US-Dollar);
Abbildung 203: Marktpotenzialanalyse für Landwirtschaftstraktoren im übrigen Asien-Pazifik-Raum nach Produkt
; Abbildung 204: Marktpotenzialanalyse für Landwirtschaftstraktoren im übrigen Asien-Pazifik-Raum nach Traktortyp; Abbildung
205: Marktpotenzialanalyse für Landwirtschaftstraktoren im übrigen Asien-Pazifik-Raum nach Radtyp;
Abbildung 206: Marktpotenzialanalyse für Landwirtschaftstraktoren im übrigen Asien-Pazifik-Raum nach Motorleistung;
Abbildung 207: Marktanteile von Landwirtschaftstraktoren im übrigen Asien-Pazifik-Raum (%), nach Traktortyp, 2023
Abbildung 208: Marktanteil der übrigen APAC-Landwirtschaftstraktoren (%), nach Traktortyp, 2032
Abbildung 209: Marktanteil der übrigen APAC-Landwirtschaftstraktoren (%), nach Produkt, 2023
Abbildung 210: Marktanteil der übrigen APAC-Landwirtschaftstraktoren (%), nach Produkt, 2032
Abbildung 211: Marktanteil der übrigen APAC-Landwirtschaftstraktoren (%), nach Radtyp, 2023
Abbildung 212: Marktanteil der übrigen APAC-Landwirtschaftstraktoren (%), nach Radtyp, 2032
Abbildung 213: Marktanteil der übrigen APAC-Landwirtschaftstraktoren (%), nach Motorleistung, 2023
Abbildung 214: Marktanteil der übrigen APAC-Landwirtschaftstraktoren (%), nach Motorleistung, 2032
Abbildung 215: John Deere: Umsatzsegmentierung, 2023
Abbildung 216: John Deere: Geografische Umsatzsegmentierung
: Case IH: Umsatzsegmentierung nach Geschäftsfeld, 2023
Abbildung 218: Case IH: Umsatzsegmentierung nach Region, 2023
Abbildung 219: Escorts Group: Umsatzsegmentierung nach Geschäftsfeld, 2023
Abbildung 220: Escorts Group: Umsatzsegmentierung nach Region, 2023
Abbildung 221: Kubota: Umsatzsegmentierung nach Geschäftsfeld, 2023
Abbildung 222: Kubota: Umsatzsegmentierung nach Region, 2023
Abbildung 223: Claas: Umsatzsegmentierung nach Region, 2023
Abbildung 224: Ford Motor Company: Umsatzsegmentierung nach Geschäftsfeld, 2023
Abbildung 225: Ford Motor Company: Umsatzsegmentierung nach Region, 2023
Abbildung 226: Mahindra & Mahindra Ltd.: Umsatzsegmentierung nach Geschäftsfeld, 2023 Abbildung
227: Mahindra & Mahindra Ltd.: Umsatzsegmentierung nach Region, 2023
Abbildung 228: Iseki & Co., Ltd.: Umsatzsegmentierung nach Geschäftsbereichen, 2023
Abbildung 229: Iseki & Co., Ltd.: Geografische Umsatzsegmentierung, 2023


Merkmale | Lizenzart | ||||
Datenbuch | Einzelbenutzer |   Mehrere Benutzer | Unternehmen | ||
| E-Zugang | ✓ | ✓ | ✓ | ✓ | |
Benutzerfreigabe | Nur für 1 Benutzer | Nur für 1 Benutzer | Bis zu 7 Benutzer | Unbegrenzter Benutzerzugriff | |
⨉ | ⨉ | ⨉ | ✓ | ||
Kostenlose Anpassung | Keine kostenlose Anpassung | Bis zu 30 Stunden Arbeit | Bis zu 60 Stunden Arbeit | Bis zu 80 Arbeitsstunden | |
Lieferformat |
| ⨉ | ✓ | ✓ | ✓ |
| ✓ | ⨉ | ✓ | ✓ | |
| ⨉ | ⨉ | ⨉ | ✓ | |
Analystenunterstützung | 2 Monate Analystenunterstützung | 4 Monate Analystenunterstützung | 7 Monate Analystenunterstützung | Ein Jahr Analystenbetreuung | |
Kostenloses Bericht-Update im nächsten Aktualisierungszyklus | ⨉ | ⨉ | ⨉ | ✓ | |
Kostenloses Branchen-Update (Innerhalb von 180 Tagen) | ⨉ | ⨉ | ⨉ | ✓ | |
Nutzen | Bis zu 10 % Rabatt nach dem Kauf | Bis zu 20 % Rabatt nach dem Kauf | Bis zu 30 % Rabatt nach dem Kauf | Bis zu 40 % Rabatt nach dem Kauf | |