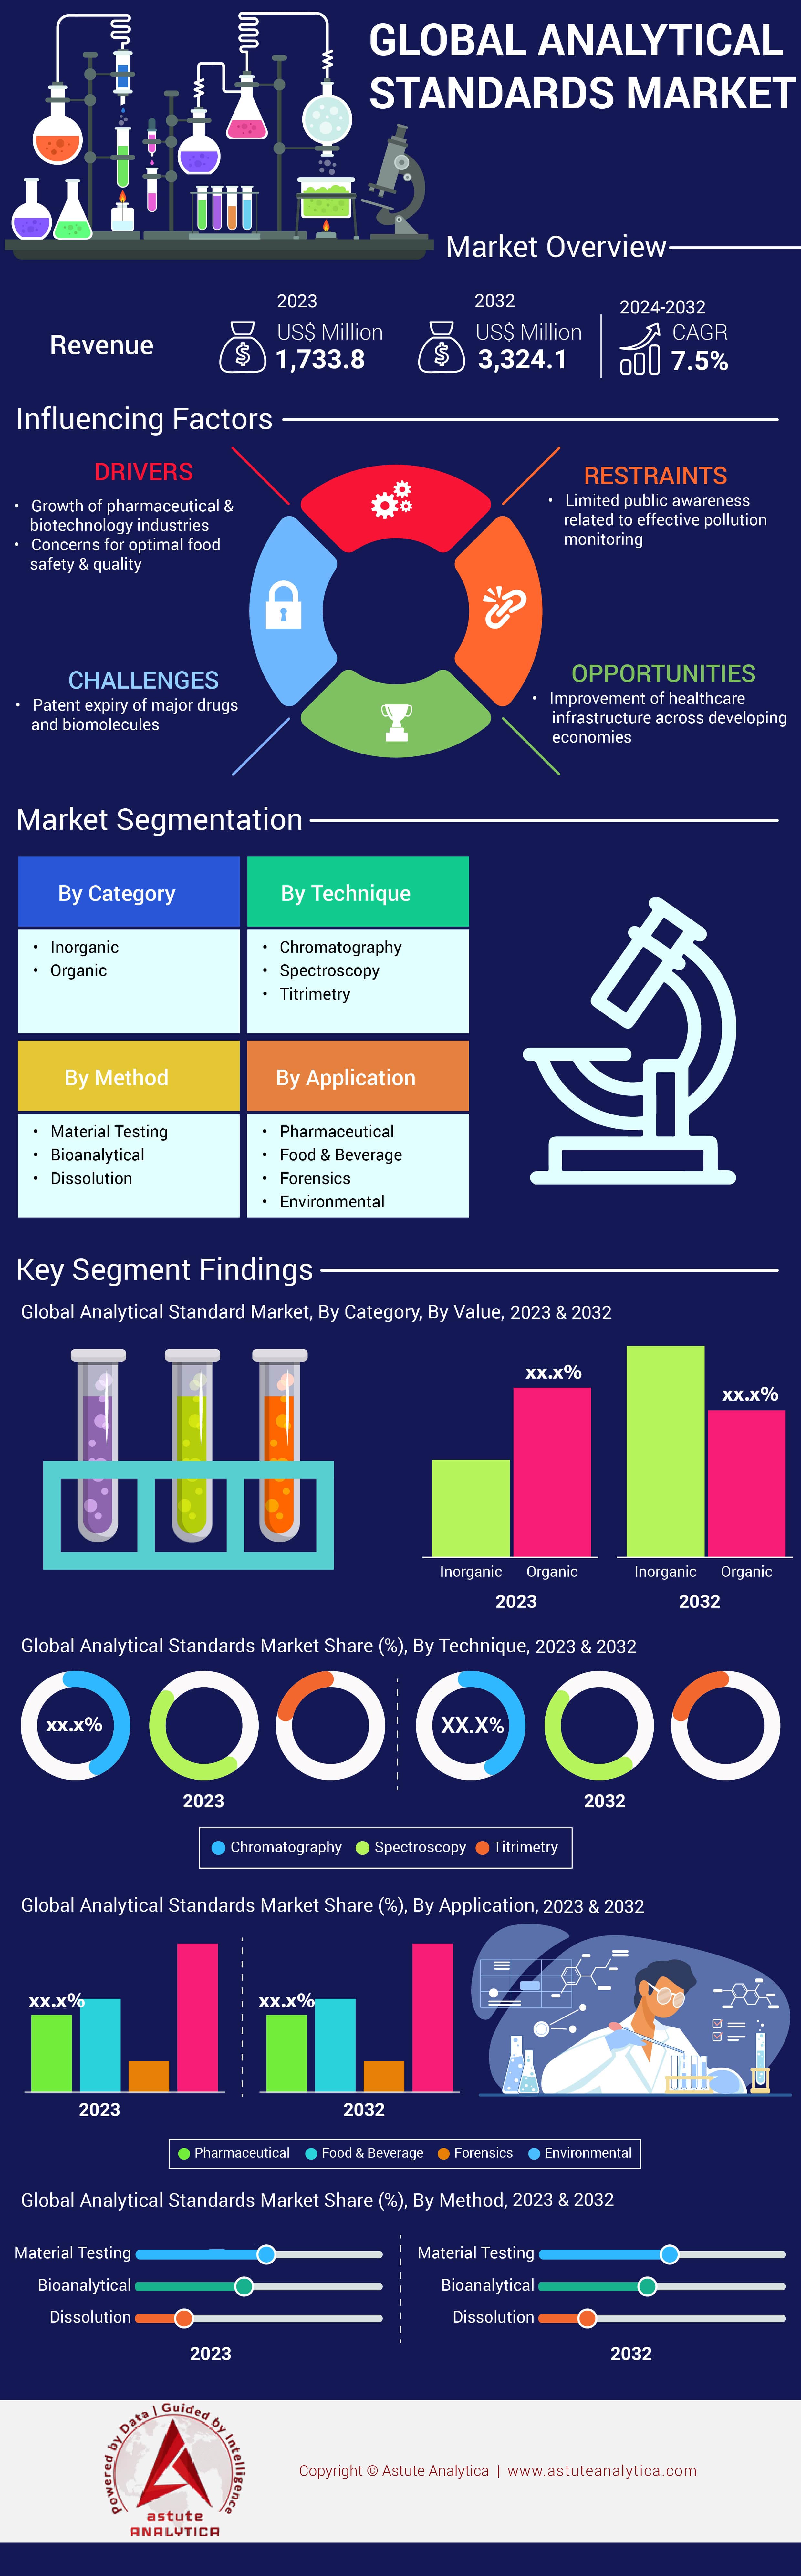
Globaler Markt für analytische Standards: Nach Kategorie (organisch und anorganisch), Technik (Chromatographie, Spektroskopie und Titrimetrie), Methode (Materialprüfung, Bioanalytik und Auflösung), Anwendung (Pharmazeutik, Lebensmittel und Getränke, Forensik und Umwelt); Region – Marktgröße, Branchendynamik, Chancenanalyse und Prognose für 2024–2032
- Letzte Aktualisierung: 24. Juli 2024 | | Bericht-ID: AA0921093
Tabelle 1: Weltweiter Markt für analytische Standards nach Kategorie und Wert, 2023 und 2032. Tabelle 2: Weltweiter Markt für analytische Standards nach Technik und Wert, 2023 und 2032. Tabelle 3: Weltweiter Markt für analytische Standards nach Methode und Wert, 2023 und 2032. Tabelle 4: Weltweiter Markt für analytische Standards nach Anwendung und Wert, 2023 und 2032. Tabelle 5: Weltweiter Markt für analytische Standards (Mio. US$) nach Region, 2019–2032. Tabelle 6: Weltweiter Markt für analytische Standards nach Geografie und Wert, 2023 und 2032. Tabelle 7: Weltweiter Markt für analytische Standards (Mio. US$), 2019–2032. Tabelle 8: Marktgröße für analytische Standards in Nordamerika (Mio. US$), 2019–2032. Tabelle 9: Marktgröße für analytische Standards in Nordamerika (Mio. US$), 2019–2032. Tabelle 10: Marktgröße für analytische Standards in Nordamerika (Mio. US$), 2019–2032 Tabelle 11: Marktgröße für analytische Standards in Nordamerika (Mio. US$), 2019–2032 Tabelle 12: Marktgröße für analytische Standards in Nordamerika (Mio. US$), 2019–2032 Tabelle 13: Marktgröße für analytische Standards in Europa (Mio. US$), 2019–2032 Tabelle 14: Marktgröße für analytische Standards in Europa (Mio. US$), 2019–2032 Tabelle 15: Marktgröße für analytische Standards in Europa (Mio. US$), 2019–2032 Tabelle 16: Marktgröße für analytische Standards in Europa (Mio. US$), 2019–2032 Tabelle 17: Marktgröße für analytische Standards in Westeuropa (Mio. US$), 2019–2032 Tabelle 18: Marktgröße für analytische Standards im asiatisch-pazifischen Raum (Mio. US$) Tabelle 19 : Marktgröße für analytische Standards im asiatisch-pazifischen Raum (Mio. US$), Tabelle 20: Marktgröße für analytische Standards im asiatisch-pazifischen Raum (Mio. US$), Tabelle 21: Marktgröße für analytische Standards im asiatisch-pazifischen Raum (Mio. US$), Tabelle 22: Marktgröße für analytische Standards im asiatisch-pazifischen Raum ( Mio. US$), Tabelle 23: Marktgröße für analytische Standards in Südamerika (Mio. US$), Tabelle 24 : Marktgröße für analytische Standards in Südamerika (Mio. US$), Tabelle 25: Marktgröße für analytische Standards in Südamerika (Mio. US$), Tabelle 26: Marktgröße für analytische Standards in Südamerika (Mio. US$), Tabelle 27: Südamerika Marktgröße für analytische Standards (Mio. US$), 2019–2032 Tabelle 28: Marktgröße für analytische Standards im Nahen Osten und Afrika (Mio. US$), 2019–2032 Tabelle 29: Marktgröße für analytische Standards im Nahen Osten und Afrika (Mio. US$), 2019–2032 Tabelle 30: Marktgröße für analytische Standards im Nahen Osten und Afrika (Mio. US$), 2019–2032 Tabelle 31: Marktgröße für analytische Standards im Nahen Osten und Afrika (Mio. US$), 2019–2032 Tabelle 32: Marktgröße für analytische Standards im Nahen Osten und Afrika (Mio. US$), 2019–2032 Tabelle 33: Finanzkennzahlen Merck KGaA Tabelle 34: Finanzkennzahlen Thermo Fisher Scientific Inc. Tabelle 35: Finanzkennzahlen Agilent Technologies Inc. Tabelle 36: Finanzkennzahlen LGC Science Group Holdings Ltd. Tabelle 37: Finanzkennzahlen Waters Corporation 38: Perkin Elmer Inc. – Finanzübersicht (Tabelle) 39: Mallinckrodt Plc – Finanzübersicht (Tabelle) 40: United States Pharmacopeia – Finanzübersicht
Abbildung 1: Marktgröße für analytische Standards (Mio. US$) Abbildung 2: Markt für analytische Standards nach Kategorie und Wert (in %), 2023 Abbildung 3: Marktanteile der Unternehmen (%), 2023 Abbildung 4: Globaler Markt für analytische Standards nach Kategorie und Wert, 2019–2032 Abbildung 5: Globaler Markt für analytische Standards (Mio. US$) nach Kategorie und Wert, 2023 und 2032 Abbildung 6: Globaler Markt für analytische Standards (Mio. US$) nach anorganischen Rohstoffen und Wert, 2019–2032 Abbildung 7: Globaler Markt für analytische Standards (Mio. US$) nach organischen Rohstoffen und Wert, 2019–2032 Abbildung 8: Globaler Markt für analytische Standards nach Analyseverfahren und Wert, 2019–2032 Abbildung 9: Globaler Markt für analytische Standards (Mio. US$) nach Analyseverfahren und Wert, 2023 und 2032 Abbildung 10: Globaler Markt für analytische Standards (Mio. US$) nach Chromatographie, nach Wert, 2019–2032 Abbildung 11: Weltweiter Markt für analytische Standards (Mio. US$), nach Spektroskopie, nach Wert, 2019–2032 Abbildung 12: Weltweiter Markt für analytische Standards (Mio. US$), nach Titrimetrie, nach Wert, 2019–2032 Abbildung 13: Weltweiter Markt für analytische Standards, nach Methode, nach Wert, 2019–2032 Abbildung 14: Weltweiter Markt für analytische Standards (Mio. US$), nach Methode, nach Wert, 2023 und 2032 Abbildung 15: Weltweiter Markt für analytische Standards (Mio. US$), nach Materialprüfung, nach Wert, 2019–2032 Abbildung 16: Weltweiter Markt für analytische Standards (Mio. US$), nach Bioanalytik, nach Wert, 2019–2032 Abbildung 17: Weltweiter Markt für analytische Standards (Mio. US$), nach Auflösung, nach Wert, 2019–2032 Abbildung 18: Globaler Markt für analytische Standards, nach Methode und Wert, 2019–2032; Abbildung 19: Globaler Markt für analytische Standards (Mio. US$), nach Anwendung und Wert, 2023 und 2032; Abbildung 20: Globaler Markt für analytische Standards (Mio. US$), nach Pharmazeutika und Wert, 2019–2032; Abbildung 21: Globaler Markt für analytische Standards (Mio. US$), nach Lebensmitteln und Getränken und Wert, 2019–2032; Abbildung 22: Globaler Markt für analytische Standards (Mio. US$), nach Forensik und Wert, 2019–2032; Abbildung 23: Globaler Markt für analytische Standards (Mio. US$), nach Umweltanalytik und Wert, 2019–2032 ; Abbildung 24: Globaler Markt für analytische Standards (Mio. US$), nach Region und Wert, 2023 und 2032; Abbildung 25: Markt für analytische Standards in Nordamerika (Mio. US$), nach Wert Abbildung 26: Markt für analytische Standards in Europa (Mio. US$), nach Wert, 2019–2032 Abbildung 27: Markt für analytische Standards im asiatisch-pazifischen Raum (Mio. US$), nach Wert, 2019–2032 Abbildung 28: Markt für analytische Standards in Südamerika (Mio. US$), nach Wert, 2019–2032 Abbildung 29: Markt für analytische Standards im Nahen Osten und Afrika (Mio. US$), nach Wert, 2019–2032 Abbildung 30: Umsatz der Geschäftssegmente von Merck KGaA, 2023 Abbildung 31: Umsatz der Geschäftssegmente von Merck KGaA, 2023 Abbildung 32: Umsatz der Geschäftssegmente von Thermo Fisher, 2023 Abbildung 33: Umsatz der Geschäftssegmente von Thermo Fisher, 2023 Abbildung 34: Umsatz der Geschäftssegmente von Agilent Technologies Inc., 2023 Abbildung 35: Umsatz der Geschäftssegmente von Agilent Technologies Inc. , 2023 Umsatz, 2023 Abbildung 36: LGC Science Group Holdings Ltd. – Umsatz nach Geschäftsbereich, 2023 Abbildung 37: LGC Science Group Holdings Ltd. – Umsatz nach Region, 2023 Abbildung 38: Waters Corporation – Umsatz nach Geschäftsbereich, 2023 Abbildung 39: Waters Corporation – Umsatz nach Region, 2023 Abbildung 40: Perkin Elmer Inc. – Umsatz nach Geschäftsbereich, 2023 Abbildung 41: Perkin Elmer Inc. – Umsatz nach Region, 2023 Abbildung 42: Mallinckrodt Plc – Umsatz nach Geschäftsbereich, 2023 Abbildung 43: Mallinckrodt Plc – Umsatz nach Region, 2023


Merkmale | Lizenzart | ||||
Datenbuch | Einzelbenutzer |   Mehrere Benutzer | Unternehmen | ||
| E-Zugang | ✓ | ✓ | ✓ | ✓ | |
Benutzerfreigabe | Nur für 1 Benutzer | Nur für 1 Benutzer | Bis zu 7 Benutzer | Unbegrenzter Benutzerzugriff | |
⨉ | ⨉ | ⨉ | ✓ | ||
Kostenlose Anpassung | Keine kostenlose Anpassung | Bis zu 30 Stunden Arbeit | Bis zu 60 Stunden Arbeit | Bis zu 80 Arbeitsstunden | |
Lieferformat |
| ⨉ | ✓ | ✓ | ✓ |
| ✓ | ⨉ | ✓ | ✓ | |
| ⨉ | ⨉ | ⨉ | ✓ | |
Analystenunterstützung | 2 Monate Analystenunterstützung | 4 Monate Analystenunterstützung | 7 Monate Analystenunterstützung | Ein Jahr Analystenbetreuung | |
Kostenloses Bericht-Update im nächsten Aktualisierungszyklus | ⨉ | ⨉ | ⨉ | ✓ | |
Kostenloses Branchen-Update (Innerhalb von 180 Tagen) | ⨉ | ⨉ | ⨉ | ✓ | |
Nutzen | Bis zu 10 % Rabatt nach dem Kauf | Bis zu 20 % Rabatt nach dem Kauf | Bis zu 30 % Rabatt nach dem Kauf | Bis zu 40 % Rabatt nach dem Kauf | |