Markt für Batterie-as-a-Service: Produkttyp – Stationär und Mobil/Tragbar; nach Serviceart – Abonnement (Miete) und nutzungsabhängige Bezahlung; nach Fahrzeugtyp – Zwei- und Dreiräder, Pkw, leichte Nutzfahrzeuge (LCV), schwere Nutzfahrzeuge (HCV) und Sonstige; und nach Region; Region – Marktgröße, Branchendynamik, Chancenanalyse und Prognose für 2025–2033
- Letzte Aktualisierung: 10. Juli 2025 | | Bericht-ID: AA0422212
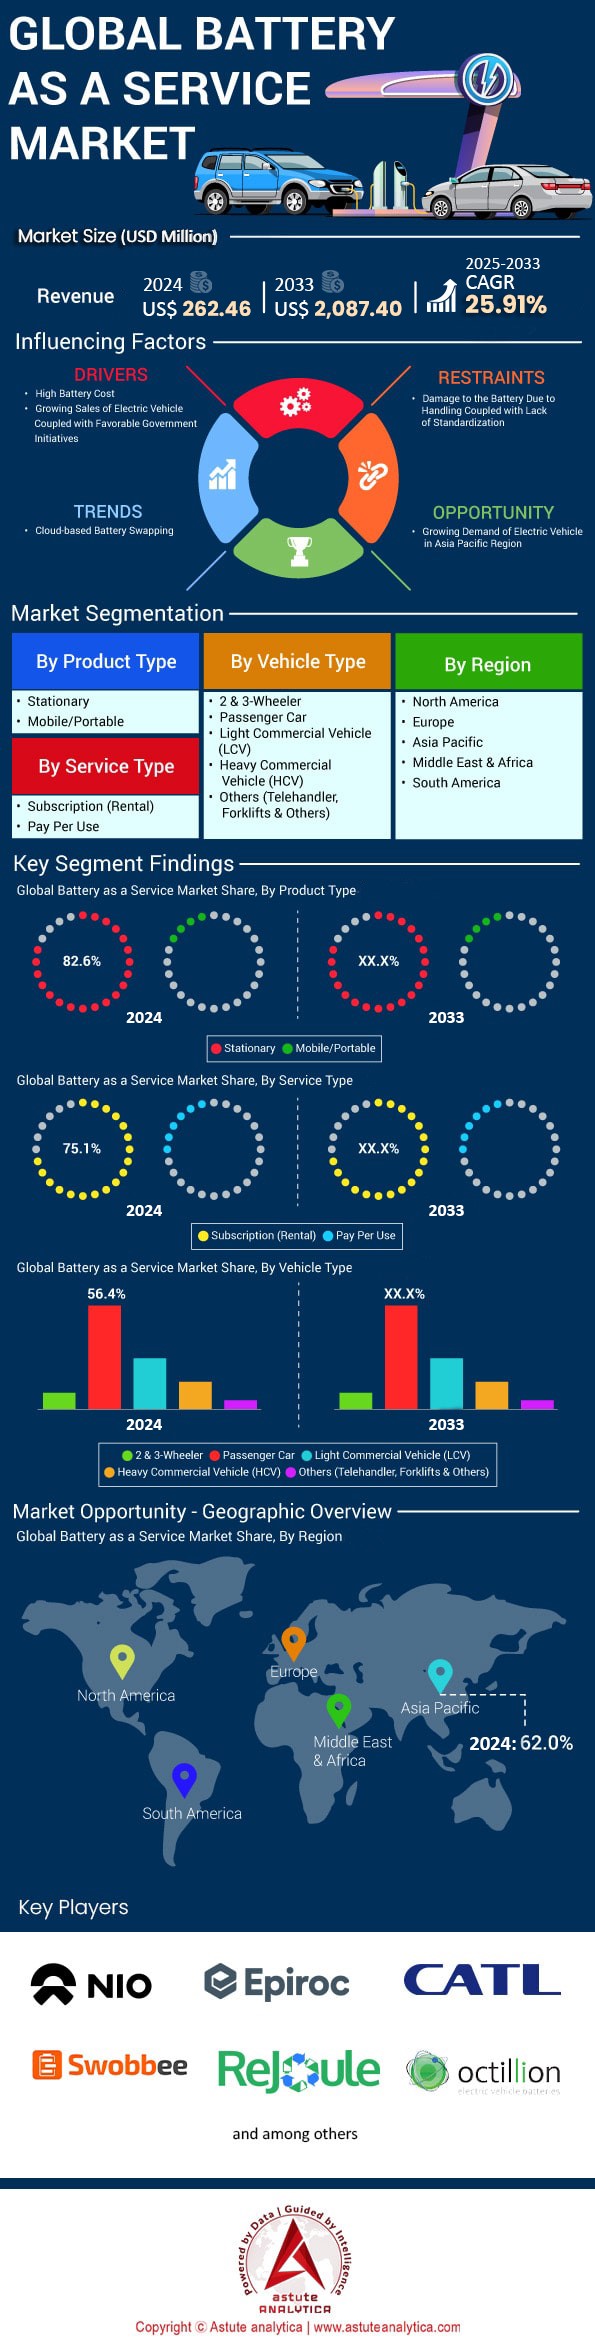
Tabelle 1. Marktaussichten für Elektrofahrzeuge (Mio. Einheiten) nach Region, 2020–2033 Tabelle 2. Marktaussichten für Elektrofahrzeuge (Mio. Einheiten) nach Region, 2031–2050 Tabelle 3. Marktaussichten für Elektrofahrzeuge (Mio. Einheiten) nach Fahrzeugtyp, 2020–2033 Tabelle 4. Marktaussichten für Elektrofahrzeuge (Mio. Einheiten) nach Fahrzeugtyp, 2031–2050 Tabelle 5. Weltweite Marktgröße für Battery as a Service (Mio. US$) nach Produkttyp, 2020–2033 Tabelle 6. Weltweite Marktgröße für Battery as a Service (Mio. US$) nach Serviceart, 2020–2033 Tabelle 7. Weltweite Marktgröße für Battery as a Service (Mio. US$) nach Fahrzeugtyp, 2020–2033 Tabelle 8. Marktgröße für Battery as a Service in Nordamerika (Mio. US$) nach Produkttyp, 2020–2033 9. Marktgröße für Batterie-as-a-Service in Nordamerika (Mio. US$), nach Serviceart, 2020–2033 Tabelle 10. Marktgröße für Batterie-as-a-Service in Nordamerika (Mio. US$), nach Fahrzeugtyp, 2020–2033 Tabelle 11. Marktgröße für Batterie-as-a-Service in Nordamerika (Mio. US$), nach Land, 2020–2033 Tabelle 12. Marktgröße für Batterie-as-a-Service in Europa (Mio. US$), nach Produkttyp, 2020–2033 Tabelle 13. Marktgröße für Batterie-as-a-Service in Europa (Mio. US$), nach Serviceart, 2020–2033 Tabelle 14. Marktgröße für Batterie-as-a-Service in Europa (Mio. US$), nach Fahrzeugtyp, 2020–2033 Tabelle 15. Marktgröße für Batterie-as-a-Service in Europa (Mio. US$), nach Land, 2020–2033 Tabelle 16. Marktgröße für Batterie-as-a-Service im asiatisch-pazifischen Raum (Mio. US$), nach Produkt Tabelle 17. Marktgröße für „Battery as a Service“ im asiatisch-pazifischen Raum (Mio. US$), nach Serviceart, 2020–2033 Tabelle 18. Marktgröße für „Battery as a Service“ im asiatisch-pazifischen Raum (Mio. US$), nach Fahrzeugtyp, 2020–2033 Tabelle 19. Marktgröße für „Battery as a Service“ im asiatisch-pazifischen Raum (Mio. US$), nach Land, 2020–2033 Tabelle 20. Marktgröße für „Battery as a Service“ im Nahen Osten und Afrika (Mio. US$), nach Produkttyp, 2020–2033 Tabelle 21. Marktgröße für „Battery as a Service“ im Nahen Osten und Afrika (Mio. US$), nach Serviceart, 2020–2033 Tabelle 22. Marktgröße für „Battery as a Service“ im Nahen Osten und Afrika (Mio. US$), nach Fahrzeugtyp, 2020–2033 Tabelle 23. Marktgröße für „Battery as a Service“ im Nahen Osten und Afrika (Mio. US$), nach Land Tabelle 24. Marktgröße für „Battery as a Service“ in Südamerika (Mio. US$), nach Produkttyp, 2020–2033 . Tabelle 25. Marktgröße für „Battery as a Service“ in Südamerika (Mio. US$), nach Serviceart, 2020–2033. Tabelle 26. Marktgröße für „Battery as a Service“ in Südamerika (Mio. US$), nach Fahrzeugtyp, 2020–2033. Tabelle 27. Marktgröße für „Battery as a Service“ in Südamerika (Mio. US$), nach Land, 2020–2033.
Abbildung 1: Weltweiter Markt für Batterie-als-Service (BaaS) nach Wert, 2020–2033 (Mrd. US$) Abbildung 2: Weltweiter Markt für Batterie-als-Service (BaaS) nach jährlichem Wachstum, 2024–2033 (%) Abbildung 3: Marktanteilsanalyse Abbildung 4: Weltweite Umsatzprognosen (Mio. US$), 2020–2033 Abbildung 5: Weltweiter Markt für Batterie-als-Service (BaaS) nach Produkttyp, CAGR (%), 2024–2033 Abbildung 6: Weltweiter Marktanteil für Batterie-als-Service (BaaS) nach Produkttyp, 2024 Abbildung 7: Weltweiter Marktanteil für Batterie-als-Service (BaaS) nach Produkttyp, 2033 Abbildung 8: Weltweiter Markt für Batterie-als-Service (BaaS) nach Serviceart, CAGR (%), 2024–2033 Abbildung 9: Weltweiter Marktanteil für Batterie-als-Service (BaaS) nach Serviceart, 2024 Abbildung 10: Weltweiter Marktanteil für Batterie-als-Service (BaaS) nach Serviceart Serviceart, 2033 Abbildung 11: Weltweiter Markt für Batterie-als-Service, nach Fahrzeugtyp, CAGR (%), 2024–2033 Abbildung 12: Weltweiter Marktanteil für Batterie-als-Service (%), nach Fahrzeugtyp, 2024 Abbildung 13: Weltweiter Marktanteil für Batterie-als-Service (%), nach Fahrzeugtyp, 2033 Abbildung 14: Umsatzprognosen für den nordamerikanischen Markt (Mio. US$), 2020–2033 Abbildung 15: Marktanteil für Batterie-als-Service in Nordamerika (%), nach Produkttyp, 2024 Abbildung 16: Marktanteil für Batterie-als-Service in Nordamerika (%), nach Produkttyp, 2033 Abbildung 17: Marktanteil für Batterie-als-Service in Nordamerika (%), nach Serviceart, 2024 Abbildung 18: Marktanteil für Batterie-als-Service in Nordamerika (%), nach Serviceart, 2033 Abbildung 19: Marktanteil für Batterie-als-Service in Nordamerika (%), nach Fahrzeugtyp, 2024 Abbildung 20: Marktanteil von Battery as a Service in Nordamerika (%), nach Fahrzeugtyp, 2033; Abbildung 21: Marktanteil von Battery as a Service in Nordamerika (%), nach Land, 2024; Abbildung 22: Marktanteil von Battery as a Service in Nordamerika (%), nach Land, 2033; Abbildung 23: Umsatzprognose für den europäischen Markt (Mio. US$), 2020–2033; Abbildung 24: Marktanteil von Battery as a Service in Europa (%), nach Produkttyp, 2024; Abbildung 25: Marktanteil von Battery as a Service in Europa (%), nach Produkttyp, 2033; Abbildung 26: Marktanteil von Battery as a Service in Europa (%), nach Serviceart, 2024; Abbildung 27: Marktanteil von Battery as a Service in Europa (%), nach Serviceart, 2033; Abbildung 28: Marktanteil von Battery as a Service in Europa (%), nach Fahrzeugtyp, 2024 ; Abbildung 29: Marktanteil von Battery as a Service in Europa (%), nach Fahrzeugtyp, 2033 Abbildung 30: Marktanteil von „Battery as a Service“ in Europa (%), nach Ländern, 2024; Abbildung 31: Marktanteil von „Battery as a Service“ in Europa (%), nach Ländern, 2033; Abbildung 32: Umsatzprognosen für den asiatisch-pazifischen Markt (Mio. US$), 2020–2033; Abbildung 33: Marktanteil von „Battery as a Service“ im asiatisch-pazifischen Raum (%), nach Produkttyp, 2024; Abbildung 34: Marktanteil von „Battery as a Service“ im asiatisch-pazifischen Raum (%), nach Produkttyp, 2033; Abbildung 35: Marktanteil von „Battery as a Service“ im asiatisch-pazifischen Raum (%), nach Serviceart, 2024; Abbildung 36: Marktanteil von „Battery as a Service“ im asiatisch-pazifischen Raum (%), nach Serviceart, 2033; Abbildung 37: Marktanteil von „Battery as a Service“ im asiatisch-pazifischen Raum (%), nach Fahrzeugtyp, 2024; Abbildung 38: Marktanteil von „Battery as a Service“ im asiatisch-pazifischen Raum (%), nach Fahrzeugtyp, 2033; Abbildung 39: Marktanteil von „Battery as a Service“ im asiatisch-pazifischen Raum (%), nach Land, 2024 Abbildung 40: Marktanteil von Battery as a Service (%) im asiatisch-pazifischen Raum, nach Land, 2033 Abbildung 41: Umsatzprognosen und Schätzungen für den Markt im Nahen Osten und Afrika (Mio. US$), 2020–2033 Abbildung 42: Marktanteil von Battery as a Service im Nahen Osten und Afrika (%), nach Produkttyp, 2024 Abbildung 43: Marktanteil von Battery as a Service im Nahen Osten und Afrika (%), nach Produkttyp, 2033 Abbildung 44: Marktanteil von Battery as a Service im Nahen Osten und Afrika (%), nach Serviceart, 2024 Abbildung 45: Marktanteil von Battery as a Service im Nahen Osten und Afrika (%), nach Serviceart, 2033 Abbildung 46: Marktanteil von Battery as a Service im Nahen Osten und Afrika (%), nach Fahrzeugtyp, 2024 Abbildung 47: Marktanteil von Battery as a Service im Nahen Osten und Afrika (%), nach Fahrzeugtyp, 2033 Abbildung 48: Naher Osten und Afrika Marktanteile von Battery as a Service (%), nach Land, 2024 Abbildung 49: Marktanteile von Battery as a Service im Nahen Osten und Afrika (%), nach Land, 2033 Abbildung 50: Umsatzprognosen für Südamerika (Mio. US$), 2020–2033 Abbildung 51: Marktanteile von Battery as a Service in Südamerika (%), nach Produkttyp, 2024 Abbildung 52: Marktanteile von Battery as a Service in Südamerika (%), nach Produkttyp, 2033 Abbildung 53: Marktanteile von Battery as a Service in Südamerika (%), nach Serviceart, 2024 Abbildung 54: Marktanteile von Battery as a Service in Südamerika (%), nach Serviceart, 2033 Abbildung 55: Marktanteile von Battery as a Service in Südamerika (%), nach Fahrzeugtyp, 2024 Abbildung 56: Marktanteile von Battery as a Service in Südamerika (%), nach Fahrzeugtyp, 2033 Abbildung 57: Marktanteile von Battery as a Service in Südamerika (%), nach Land Abbildung 58: Marktanteile (%) des Batterie-als-Dienstleistungsmarktes in Südamerika nach Ländern bis 2033


Merkmale | Lizenzart | ||||
Datenbuch | Einzelbenutzer |   Mehrere Benutzer | Unternehmen | ||
| E-Zugang | ✓ | ✓ | ✓ | ✓ | |
Benutzerfreigabe | Nur für 1 Benutzer | Nur für 1 Benutzer | Bis zu 7 Benutzer | Unbegrenzter Benutzerzugriff | |
⨉ | ⨉ | ⨉ | ✓ | ||
Kostenlose Anpassung | Keine kostenlose Anpassung | Bis zu 30 Stunden Arbeit | Bis zu 60 Stunden Arbeit | Bis zu 80 Arbeitsstunden | |
Lieferformat |
| ⨉ | ✓ | ✓ | ✓ |
| ✓ | ⨉ | ✓ | ✓ | |
| ⨉ | ⨉ | ⨉ | ✓ | |
Analystenunterstützung | 2 Monate Analystenunterstützung | 4 Monate Analystenunterstützung | 7 Monate Analystenunterstützung | Ein Jahr Analystenbetreuung | |
Kostenloses Bericht-Update im nächsten Aktualisierungszyklus | ⨉ | ⨉ | ⨉ | ✓ | |
Kostenloses Branchen-Update (Innerhalb von 180 Tagen) | ⨉ | ⨉ | ⨉ | ✓ | |
Nutzen | Bis zu 10 % Rabatt nach dem Kauf | Bis zu 20 % Rabatt nach dem Kauf | Bis zu 30 % Rabatt nach dem Kauf | Bis zu 40 % Rabatt nach dem Kauf | |