Globaler Markt für Computer-on-Module: Nach Prozessor (ARM, x86 und PowerPC); nach Formfaktor (Com Express, SMARC, Qseven und andere); nach Branche (Industrieautomation, Luft- und Raumfahrt, Automobilindustrie und andere); und nach Region) – Branchendynamik, Marktgröße und Wachstumsprognose für 2023–2030
- Letzte Aktualisierung: 24. Februar 2023 | | Bericht-ID: AA0222138
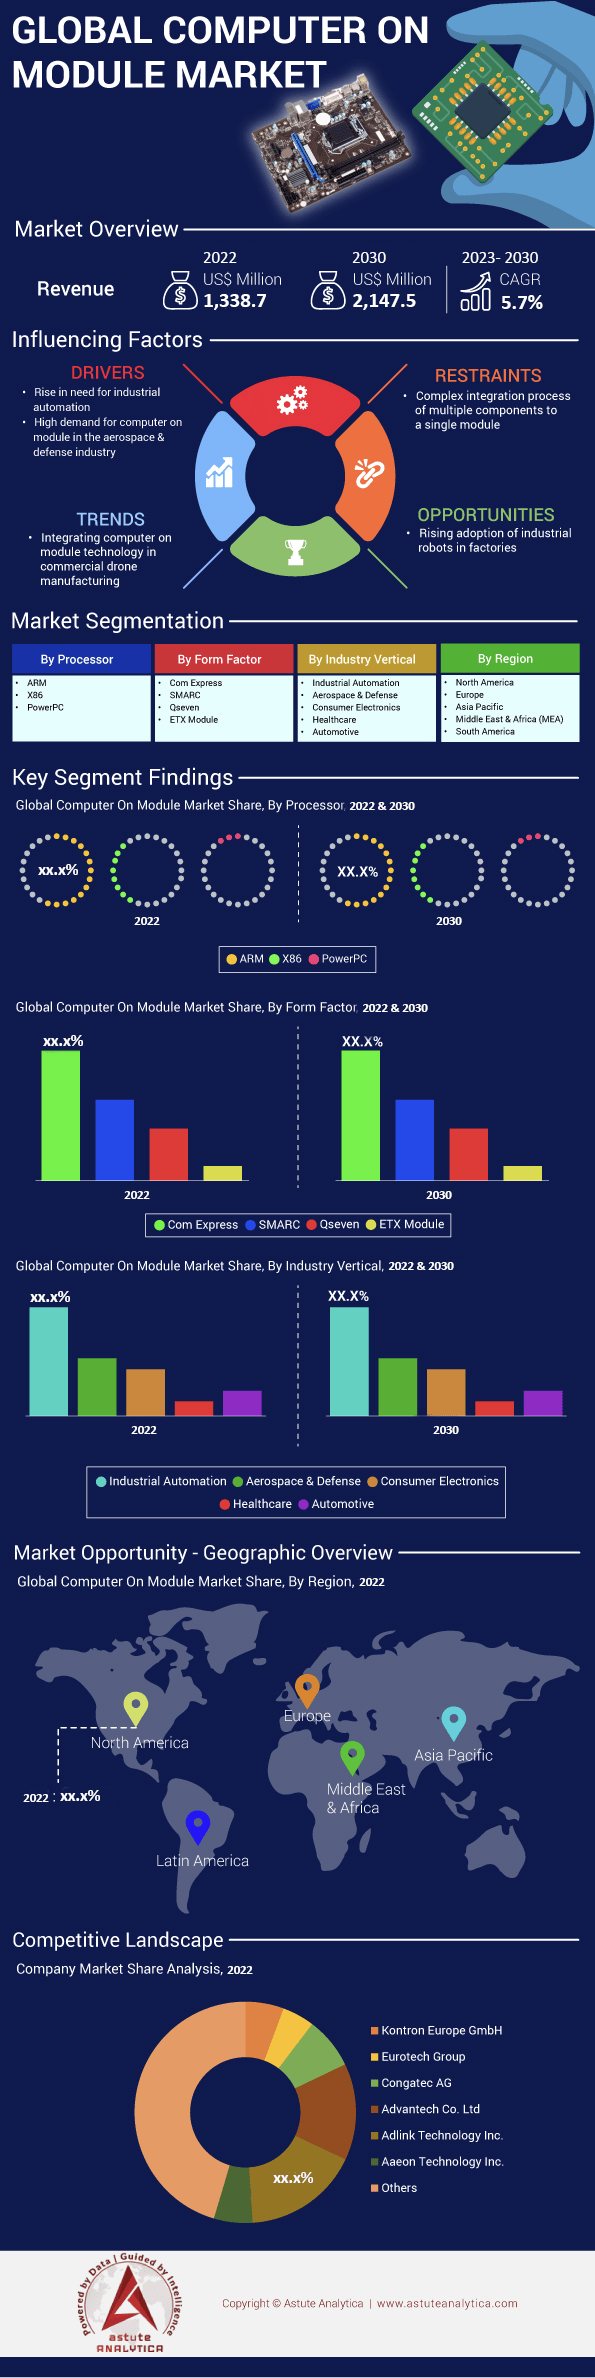
Tabelle 1. Weltweiter Markt für Computer-on-Module (Mio. US$) nach Prozessor, 2017–2030
Tabelle 2. Weltweiter Markt für Computer-on-Module (Mio. US$) nach Formfaktor, 2017–2030
Tabelle 3. Weltweiter Markt für Computer-on-Module (Mio. US$) nach Branche, 2017–2030
Tabelle 4. Weltweiter Markt für Computer-on-Module (Mio. US$) nach Region, 2017–2030
Tabelle 5. Marktgröße für Computer-on-Module in Nordamerika (Mio. US$) nach Land, 2017–2030
Tabelle 6. Marktgröße für Computer-on-Module in Nordamerika (Mio. US$) nach Prozessor, 2017–2030
Tabelle 7. Marktgröße für Computer-on-Module in Nordamerika (Mio. US$) nach Formfaktor, 2017–2030
Tabelle
8. Marktgröße für Computer-on-Module in Nordamerika (Mio. US$) nach Branche, 2017–2030 9. Marktgröße für Computer-on-Module in Europa (Mio. US$), nach Ländern, 2017–2030 Tabelle 10. Marktgröße für Computer-on-Module in Europa (Mio. US$), nach Prozessor, 2017–2030
Tabelle 11. Marktgröße für Computer-on-Module in Europa (Mio. US$), nach Formfaktor, 2017–2030
Tabelle 12. Marktgröße für Computer-on-Module in Europa (Mio. US$), nach Branchensegment, 2017–2030
Tabelle 13. Marktgröße für Computer-on-Module im asiatisch-pazifischen Raum (APAC) (Mio. US$), nach Ländern, 2017–2030
Tabelle 14. Marktgröße für Computer-on-Module im asiatisch-pazifischen Raum (APAC) (Mio. US$), nach Prozessor, 2017–2030
Tabelle 15. Marktgröße für Computer-on-Module im asiatisch-pazifischen Raum (APAC) (Mio. US$), nach Formfaktor, 2017–2030
Tabelle 16. Marktgröße für Computer-on-Module im asiatisch-pazifischen Raum (APAC) (Mio. US$), nach Branchensegment
Tabelle 17. Marktgröße für Computer-on-Module (Mio. US$) in der MEA-Region nach Ländern,
2017–2030 Tabelle 18. Marktgröße für Computer-on-Module (Mio. US$) in der MEA-Region nach Prozessoren, 2017–2030
Tabelle 19. Marktgröße für
Computer-on-Module (Mio. US$) in der MEA-Region nach Formfaktor, 2017–2030 Tabelle 20. Marktgröße für
Computer-on-Module (Mio. US$) in der MEA-Region nach Branchensegmenten, 2017–2030 Tabelle 21. Marktgröße für
Computer-on-Module in Südamerika nach Ländern, 2017–2030 Tabelle 22. Marktgröße für Computer-on-Module in Südamerika nach Prozessoren, 2017–2030
Tabelle 23. Marktgröße für Computer-on-Module in Südamerika nach Formfaktor, 2017–2030
Tabelle 24. Marktgröße für Computer-on-Module in Südamerika (Mio. US$) Nach Branchen, 2017–2030
Tabelle 25. Adlink Technology Inc.: Finanzanalyse
Tabelle 26. Intel Corporation: Finanzanalyse
Tabelle 27. Texas Instruments Inc.: Finanzanalyse
Abbildung 1: Zusammenfassung: Weltweiter Markt für Computer-on-Module (COM) nach Wert, 2020–2030 (Mrd. USD)
Abbildung 2: Analyse der Auswirkungen von COVID-19
Abbildung 3: Marktanteilsanalyse nach Unternehmen, basierend auf dem Umsatz (2021)
Abbildung 4: Weltweiter COM-Markt nach Prozessor, CAGR (%), 2020–2030
: Weltweiter COM-Marktanteil (%) nach Prozessor, 2021
: Weltweiter COM-Marktanteil (%) nach Prozessor, 2030
Abbildung 7: Weltweiter COM-Markt nach Formfaktor, CAGR (%), 2020–2030
Abbildung 8: Weltweiter COM-Marktanteil (%) nach Formfaktor, 2021
Abbildung 9: Weltweiter COM-Marktanteil (%) nach Formfaktor, 2030
Abbildung
10: Weltweiter COM-Markt nach Branche, CAGR (%), 2020–2030 Abbildung 11: Weltweiter Marktanteil von Computer-on-Module (%), nach Branchen, 2021 Abbildung 12: Weltweiter Marktanteil von Computer-on-Module (%), nach Branchen, 2030
Abbildung 13: Weltweiter Marktanteil von Computer-on-Module (%), nach Regionen, 2021
Abbildung 14: Weltweiter Marktanteil von Computer-on-Module (%), nach Regionen, 2030
Abbildung 15: Nordamerikanischer Computer-on-Module-Markt: Segment mit dem höchsten Anteil (%)
Abbildung 16: Nordamerikanischer Computer-on-Module-Markt, CAGR des Top-Segments (%), 2020–2030
Abbildung 17: Nordamerikanischer Computer-on-Module-Markt (%), nach Ländern, 2021
Abbildung 18: Nordamerikanischer Computer-on-Module-Markt (%), nach Ländern, 2030
Abbildung 19: Nordamerikanischer Computer-on-Module-Markt (%), nach Prozessoren, 2021
Abbildung 20: Nordamerikanischer Computer-on-Module-Markt (%), nach Prozessoren, 2030
Abbildung 21: Nordamerikanischer Computer-on-Module-Markt (%), nach Formfaktor, 2021
Abbildung 22: Marktanteil von Computer-on-Module (%) in Nordamerika nach Formfaktor, 2030
Abbildung 23: Marktanteil von Computer-on-Module (%) in Nordamerika nach Branchensegment, 2021
Abbildung 24: Marktanteil von Computer-on-Module (%) in Nordamerika nach Branchensegment, 2030
Abbildung 25: Markt für Computer-on-Module in Europa: Segment mit dem höchsten Anteil (%)
Abbildung 26: Markt für Computer-on-Module in Europa, CAGR des Top-Segments (%), 2020–2030
Abbildung 27: Marktanteil von Computer-on-Module in Europa (%) nach Land, 2021
Abbildung 28: Marktanteil von Computer-on-Module in Europa (%) nach Land, 2030
Abbildung 29: Marktanteil von Computer-on-Module in Europa (%) nach Prozessor, 2021 Abbildung
30: Marktanteil von Computer-on-Module in Europa (%) nach Prozessor, 2030 Abbildung
31: Marktanteil von Computer-on-Module in Europa (%) nach Formfaktor, 2021
Abbildung 32: Markt für Computer-on-Module in Europa Marktanteile von Modulen (%), nach Formfaktor, 2030
Abbildung 33: Marktanteile von Computer-on-Module in Europa (%), nach Branchen, 2021
Abbildung 34: Marktanteile von Computer-on-Module in Europa (%), nach Branchen, 2030
Abbildung 35: Markt für Computer-on-Module im asiatisch-pazifischen Raum: Segment mit dem höchsten Anteil (%)
Abbildung 36: CAGR des Marktes für Computer-on-Module im asiatisch-pazifischen Raum, Top-Segment, 2020–2030
Abbildung 37: Marktanteile von Computer-on-Module im asiatisch-pazifischen Raum (%), nach Land, 2021
Abbildung 38: Marktanteile von Computer-on-Module im asiatisch-pazifischen Raum (%), nach Land, 2030
Abbildung 39: Marktanteile von Computer-on-Module im asiatisch-pazifischen Raum (%), nach Prozessor, 2021
Abbildung 40: Marktanteile von Computer-on-Module im asiatisch-pazifischen Raum (%), nach Prozessor, 2030
Abbildung 41: Marktanteile von Computer-on-Module im asiatisch-pazifischen Raum (%), nach Formfaktor, 2021
Abbildung 42: Marktanteile von Computer-on-Module im asiatisch-pazifischen Raum (%), nach Formfaktor Faktor, 2030
Abbildung 43: Marktanteil von Computer-on-Module (%) im asiatisch-pazifischen Raum nach Branchen, 2021
Abbildung 44: Marktanteil von Computer-on-Module (%) im asiatisch-pazifischen Raum nach Branchen, 2030
Abbildung 45: Markt für Computer-on-Module im Nahen Osten und Afrika: Segment mit dem höchsten Anteil (%)
Abbildung 46: Markt für Computer-on-Module im Nahen Osten und Afrika, CAGR des Top-Segments (%), 2020–2030
Abbildung 47: Marktanteil von Computer-on-Module im Nahen Osten und Afrika (%) nach Ländern, 2021
Abbildung 48: Marktanteil von Computer-on-Module im Nahen Osten und Afrika (%) nach Ländern, 2030
Abbildung 49: Marktanteil von Computer-on-Module im Nahen Osten und Afrika (%) nach Prozessoren, 2021
Abbildung 50: Marktanteil von Computer-on-Module im Nahen Osten und Afrika (%) nach Prozessoren, 2030
Abbildung 51: Marktanteil von Computer-on-Module im Nahen Osten und Afrika (%) nach Formfaktor, 2021
Abbildung 52: Marktanteil von Computer-on-Module im Nahen Osten und Afrika (%) nach Formfaktor, 2030
Abbildung 53: Markt für Computer-on-Module im Nahen Osten und Afrika Marktanteil (%), nach Branchensegment, 2021
Abbildung 54: Marktanteil (%) des Computer-on-Module-Marktes in der MEA-Region, nach Branchensegment, 2030
Abbildung 55: Marktanteil des Computer-on-Module-Marktes in Südamerika: Segment mit dem höchsten Marktanteil (%)
Abbildung 56: CAGR (%) des südamerikanischen Computer-on-Module-Marktes, Top-Segment, 2020–2030
Abbildung 57: Marktanteil des Computer-on-Module-Marktes in Südamerika (%), nach Land, 2021
Abbildung 58: Marktanteil des Computer-on-Module-Marktes in Südamerika (%), nach Land, 2030
Abbildung 59: Marktanteil des Computer-on-Module-Marktes in Südamerika (%), nach Prozessor, 2021
Abbildung 60: Marktanteil des Computer-on-Module-Marktes in Südamerika (%), nach Prozessor, 2030
Abbildung 61: Marktanteil des Computer-on-Module-Marktes in Südamerika (%), nach Formfaktor, 2021
Abbildung 62: Marktanteil des Computer-on-Module-Marktes in Südamerika (%), nach Formfaktor, 2030
Abbildung 63: Marktanteil des Computer-on-Module-Marktes in Südamerika (%), nach Branchensegment
64 : Marktanteile (%) des südamerikanischen Computer-on-Module-Marktes nach Branchensegmenten, 2030;
Abbildung 65: Adlink Technology Inc.: Umsatzsegmentierung, 2022;
Abbildung 66: Intel Corporation: Umsatzsegmentierung, 2022;
Abbildung 67: Texas Instruments Inc.: Umsatzsegmentierung, 2022;
Abbildung 68: Texas Instruments Inc.: Geografische Umsatzsegmentierung, 2022


Merkmale | Lizenzart | ||||
Datenbuch | Einzelbenutzer |   Mehrere Benutzer | Unternehmen | ||
| E-Zugang | ✓ | ✓ | ✓ | ✓ | |
Benutzerfreigabe | Nur für 1 Benutzer | Nur für 1 Benutzer | Bis zu 7 Benutzer | Unbegrenzter Benutzerzugriff | |
⨉ | ⨉ | ⨉ | ✓ | ||
Kostenlose Anpassung | Keine kostenlose Anpassung | Bis zu 30 Stunden Arbeit | Bis zu 60 Stunden Arbeit | Bis zu 80 Arbeitsstunden | |
Lieferformat |
| ⨉ | ✓ | ✓ | ✓ |
| ✓ | ⨉ | ✓ | ✓ | |
| ⨉ | ⨉ | ⨉ | ✓ | |
Analystenunterstützung | 2 Monate Analystenunterstützung | 4 Monate Analystenunterstützung | 7 Monate Analystenunterstützung | Ein Jahr Analystenbetreuung | |
Kostenloses Bericht-Update im nächsten Aktualisierungszyklus | ⨉ | ⨉ | ⨉ | ✓ | |
Kostenloses Branchen-Update (Innerhalb von 180 Tagen) | ⨉ | ⨉ | ⨉ | ✓ | |
Nutzen | Bis zu 10 % Rabatt nach dem Kauf | Bis zu 20 % Rabatt nach dem Kauf | Bis zu 30 % Rabatt nach dem Kauf | Bis zu 40 % Rabatt nach dem Kauf | |