Markt für digitale Therapien: Nach Komponenten (Hardware, Software und Dienstleistungen), Anwendung (Prävention und Behandlung/Pflege), Vertriebskanal (Business-to-Business (B2B) und Business-to-Consumer (B2C)) und Region – Branchendynamik, Marktgröße und Wachstumsprognose für 2025–2033
- Letzte Aktualisierung: 05. Mai 2025 | | Bericht-ID: AA0322170
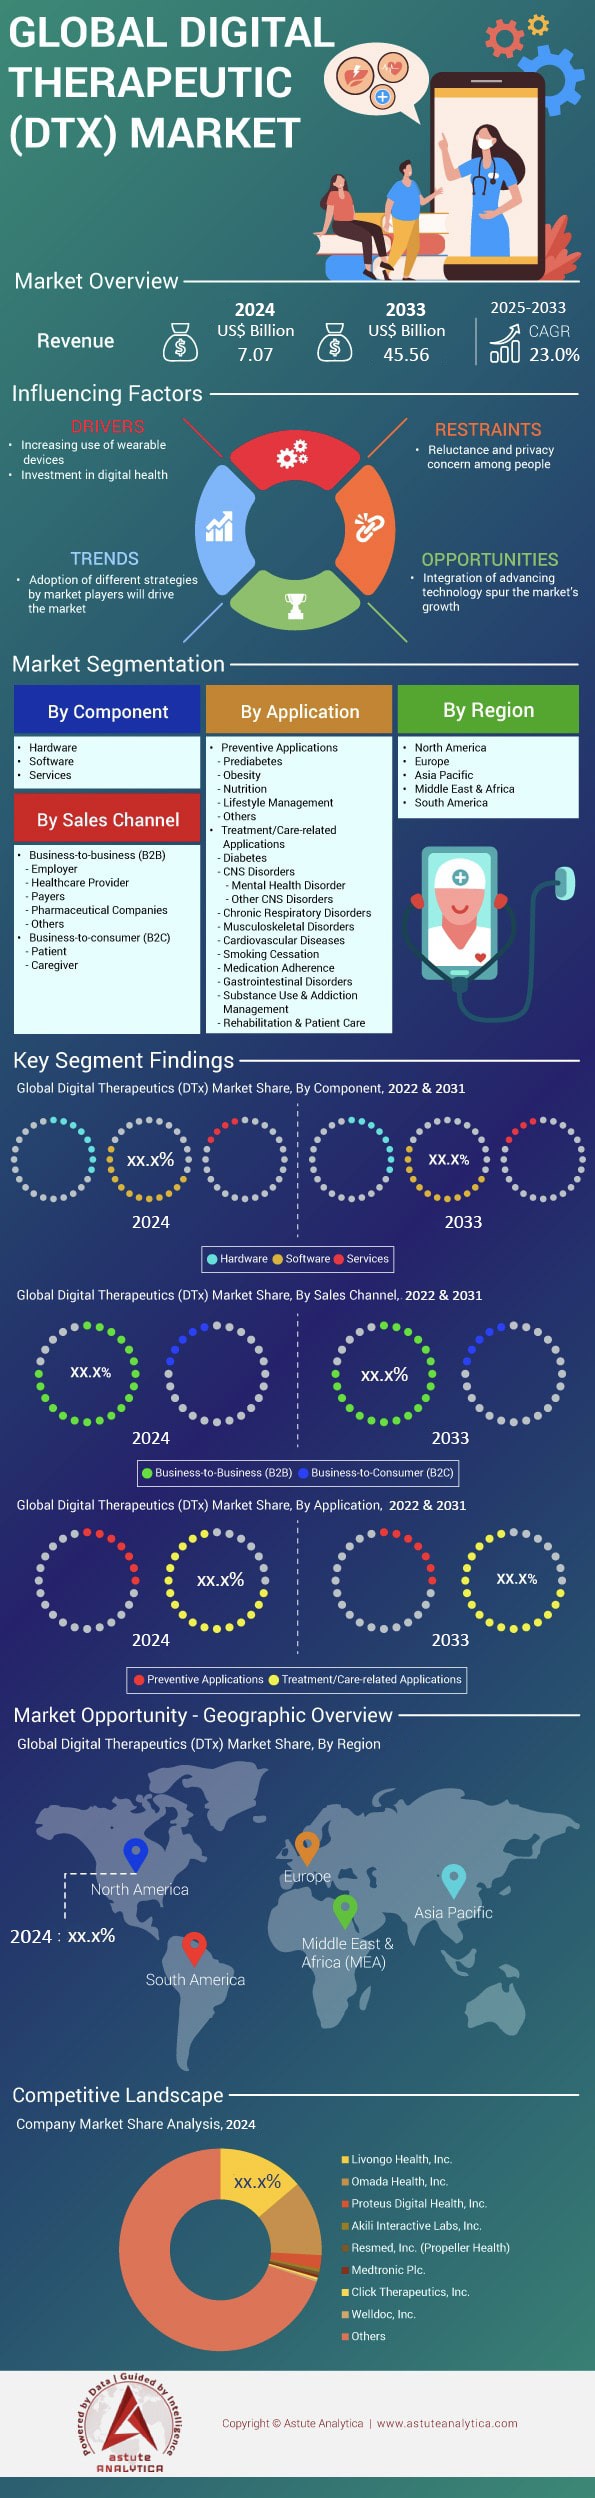
Tabelle 1: Weltweiter Markt für digitale Therapien (DTx) (Mrd. US-Dollar), nach Komponenten, 2020–2033 Tabelle 2: Weltweiter Markt für digitale Therapien (DTx) (Mrd. US-Dollar), nach Anwendung, 2020–2033 Tabelle 3: Weltweiter Markt für digitale Therapien (DTx) (Mrd. US-Dollar), nach Vertriebskanal, 2020–2033 Tabelle 4: Weltweiter Markt für digitale Therapien (DTx) (Mrd. US-Dollar), nach Region, 2020–2033 Tabelle 5: Markt für digitale Therapien (DTx) in Nordamerika (Mrd. US-Dollar), nach Land, 2020–2033 Tabelle 6: Markt für digitale Therapien (DTx) in Nordamerika (Mrd. US-Dollar), nach Komponenten, 2020–2033 Tabelle 7: Markt für digitale Therapien (DTx) in Nordamerika (Mrd. US-Dollar), nach Anwendung, 2020–2033 Tabelle 8: Marktgröße für digitale Therapien (DTx) in Nordamerika (Mrd. US$), nach Vertriebskanal, 2020–2033; Tabelle 9: Marktgröße für digitale Therapien (DTx) in den USA (Mrd. US$), nach Komponente, 2020–2033; Tabelle 10: Marktgröße für digitale Therapien (DTx) in den USA (Mrd. US$), nach Anwendung, 2020–2033; Tabelle 11: Marktgröße für digitale Therapien (DTx) in den USA (Mrd. US$), nach Vertriebskanal, 2020–2033; Tabelle 12: Marktgröße für digitale Therapien (DTx) in Europa (Mrd. US$), nach Land, 2020–2033; Tabelle 13: Marktgröße für digitale Therapien (DTx) in Europa (Mrd. US$), nach Komponente, 2020–2033; Tabelle 14: Marktgröße für digitale Therapien (DTx) in Europa (Mrd. US$), nach … Anwendung, 2020–2033 Tabelle 15: Marktgröße für digitale Therapien (DTx) in Europa (Mrd. US-Dollar), nach Vertriebskanal, 2020–2033 Tabelle 16: Marktgröße für digitale Therapien (DTx) in Großbritannien (Mrd. US-Dollar), nach Komponente, 2020–2033 Tabelle 17: Marktgröße für digitale Therapien (DTx) in Großbritannien (Mrd. US-Dollar), nach Anwendung, 2020–2033 Tabelle 18: Marktgröße für digitale Therapien (DTx) in Großbritannien (Mrd. US-Dollar), nach Vertriebskanal, 2020–2033 Tabelle 19: Marktgröße für digitale Therapien (DTx) im asiatisch-pazifischen Raum (Mrd. US-Dollar), nach Land, 2020–2033 Tabelle 20: Marktgröße für digitale Therapien (DTx) im asiatisch-pazifischen Raum (Mrd. US-Dollar), nach Komponente, 2020–2033 Tabelle 21: Marktgröße für digitale Therapien (DTx) im asiatisch-pazifischen Raum Marktgröße für digitale Therapien (DTx) (Mrd. US$), nach Anwendung, 2020–2033 Tabelle 22: Marktgröße für digitale Therapien (DTx) im asiatisch-pazifischen Raum (Mrd. US$), nach Vertriebskanal, 2020–2033 Tabelle 23: Marktgröße für digitale Therapien (DTx) in Japan (Mrd. US$), nach Komponente, 2020–2033 Tabelle 24: Marktgröße für digitale Therapien (DTx) in Japan (Mrd. US$), nach Anwendung, 2020–2033 Tabelle 25: Marktgröße für digitale Therapien (DTx) in Japan (Mrd. US$), nach Vertriebskanal, 2020–2033 Tabelle 26: Marktgröße für digitale Therapien (DTx) in China (Mrd. US$), nach Komponente, 2020–2033 Tabelle 27: Marktgröße für digitale Therapien ( DTx) in China (Mrd. US$), nach Anwendung, 2020–2033 Tabelle 28: Marktgröße für digitale Therapien (DTx) in China (Mrd. US-Dollar), nach Vertriebskanal, 2020–2033; Tabelle 29: Marktgröße für digitale Therapien (DTx) im Nahen Osten und Afrika (Mrd. US-Dollar), nach Land, 2020–2033; Tabelle 30: Marktgröße für digitale Therapien (DTx) im Nahen Osten und Afrika (Mrd. US-Dollar), nach Komponente, 2020–2033; Tabelle 31: Marktgröße für digitale Therapien (DTx) im Nahen Osten und Afrika (Mrd. US-Dollar), nach Anwendung, 2020–2033; Tabelle 32: Marktgröße für digitale Therapien (DTx) im Nahen Osten und Afrika (Mrd. US-Dollar), nach Vertriebskanal, 2020–2033; Tabelle 33: Marktgröße für digitale Therapien (DTx) in Südamerika (Mrd. US-Dollar), nach Land, 2020–2033; Tabelle 34: Marktgröße für digitale Therapien (DTx) in Südamerika (Mrd. US-Dollar), nach Komponenten, 2020–2033 Tabelle 35: Marktgröße für digitale Therapien (DTx) in Südamerika (Mrd. US-Dollar) nach Anwendung, 2020–2033 Tabelle 36: Marktgröße für digitale Therapien (DTx) in Südamerika (Mrd. US-Dollar) nach Vertriebskanal, 2020–2033 Tabelle 37: Teladoc Health, Inc.: Finanzanalyse Tabelle 38: Medtronic: Finanzanalyse Tabelle 39: ResMed: Finanzanalyse Tabelle 40: Voluntis: Finanzanalyse
Abbildung 1: Zusammenfassung: Weltweiter Markt für digitale Therapien nach Wert, 2024–2033 (Mrd. US-Dollar) Abbildung 2: Zusammenfassung: Weltweiter Markt für digitale Therapien nach jährlichem Wachstum, 2024–2033 (%) Abbildung 3: Bewertung der Auswirkungen von COVID-19 auf den Marktwachstumstrend: Analyse Abbildung 4: Wettbewerbsübersicht: Marktanteilsanalyse nach Unternehmen, basierend auf dem Umsatz (2020) Abbildung 5: Weltweiter Markt für digitale Therapien nach Komponente, CAGR (%), 2024–2033 Abbildung 6: Weltweiter Marktanteil digitaler Therapien (DTx) (%), nach Komponente, 2024 Abbildung 7: Weltweiter Marktanteil digitaler Therapien (DTx) (%), nach Komponente, 2033 Abbildung 8: Weltweiter Markt für digitale Therapien nach Anwendung, CAGR (%), 2024–2033 Abbildung 9: Weltweiter Marktanteil digitaler Therapien (DTx) (%), nach Anwendung, 2024 Abbildung 10: Weltweiter Markt für digitale Therapien (DTx) Marktanteil (%), nach Anwendung, 2033 Abbildung 11: Globaler Markt für digitale Therapien, nach Vertriebskanal, CAGR (%), 2024–2033 Abbildung 12: Globaler Marktanteil für digitale Therapien (DTx) (%), nach Vertriebskanal, 2024 Abbildung 13: Globaler Marktanteil für digitale Therapien (DTx) (%), nach Vertriebskanal, 2033 Abbildung 14: Globaler Markt für digitale Therapien, CAGR des Top-Segments (%), 2024–2033 Abbildung 15: Globaler Marktanteil für digitale Therapien (DTx) (%), nach Region, 2024 Abbildung 16: Globaler Marktanteil für digitale Therapien (DTx) (%), nach Region, 2033 Abbildung 17: Nordamerikanischer Markt für digitale Therapien, CAGR des Top-Segments (%), 2024–2033 Abbildung 18: Nordamerikanischer Marktanteil für digitale Therapien (DTx) (%), nach Land, 2024 Abbildung 19: Nordamerikanischer Markt für digitale Therapien Marktanteile digitaler Therapien (DTx) (%), nach Land, 2033 Abbildung 20: Marktanteile digitaler Therapien (DTx) in Nordamerika (%), nach Komponente, 2024 Abbildung 21: Marktanteile digitaler Therapien (DTx) in Nordamerika (%), nach Komponente, 2033 Abbildung 22: Marktanteile digitaler Therapien (DTx) in Nordamerika (%), nach Anwendung, 2024 Abbildung 23: Marktanteile digitaler Therapien (DTx) in Nordamerika (%), nach Anwendung, 2033 Abbildung 24: Marktanteile digitaler Therapien (DTx) in Nordamerika (%), nach Vertriebskanal, 2024 Abbildung 25: Marktanteile digitaler Therapien (DTx) in Nordamerika (%), nach Vertriebskanal, 2033 Abbildung 26: Jährliche Wachstumsrate (CAGR) des europäischen Marktes für digitale Therapien, Top-Segment, 2024–2033 Abbildung 27: Marktanteile digitaler Therapien (DTx) in Europa (%), nach Land, 2024 Abbildung 28: Jährliche Wachstumsrate (CAGR) des europäischen Marktes für digitale Therapien Marktanteile digitaler Therapien (DTx) in Europa (%), nach Ländern, 2033 Abbildung 29: Marktanteile digitaler Therapien (DTx) in Europa (%), nach Komponenten, 2024 Abbildung 30: Marktanteile digitaler Therapien (DTx) in Europa (%), nach Komponenten, 2033 Abbildung 31: Marktanteile digitaler Therapien (DTx) in Europa (%), nach Anwendung, 2024 Abbildung 32: Marktanteile digitaler Therapien (DTx) in Europa (%), nach Anwendung, 2033 Abbildung 33: Marktanteile digitaler Therapien (DTx) in Europa (%), nach Vertriebskanal, 2024 Abbildung 34: Marktanteile digitaler Therapien (DTx) in Europa (%), nach Vertriebskanal, 2033 Abbildung 35: Markt für digitale Therapien im asiatisch-pazifischen Raum, CAGR des Top-Segments (%), 2024–2033 Abbildung 36: Marktanteile digitaler Therapien (DTx) im asiatisch-pazifischen Raum (%), nach Ländern, 2024 Abbildung 37: Markt für digitale Therapien im asiatisch-pazifischen Raum Marktanteile digitaler Therapien (DTx) (%), nach Land, 2033 Abbildung 38: Marktanteile digitaler Therapien (DTx) im asiatisch-pazifischen Raum (%), nach Komponente, 2024 Abbildung 39: Marktanteile digitaler Therapien (DTx) im asiatisch-pazifischen Raum (%), nach Komponente, 2033 Abbildung 40: Marktanteile digitaler Therapien (DTx) im asiatisch-pazifischen Raum (%), nach Anwendung, 2024 Abbildung 41: Marktanteile digitaler Therapien (DTx) im asiatisch-pazifischen Raum (%), nach Anwendung, 2033 Abbildung 42: Marktanteile digitaler Therapien (DTx) im asiatisch-pazifischen Raum (%), nach Vertriebskanal, 2024 Abbildung 43: Marktanteile digitaler Therapien (DTx) im asiatisch-pazifischen Raum (%), nach Vertriebskanal, 2033 Abbildung 44: CAGR des Top-Segments für digitale Therapien im Nahen Osten und Afrika (MEA), 2024–2033 Abbildung 45: Marktanteile digitaler Therapien (DTx) im Nahen Osten und Afrika (MEA) (%), nach Land, 2024 Abbildung 46: Marktanteil digitaler Therapien (DTx) in der MEA-Region (%), nach Ländern, 2033 Abbildung 47: Marktanteil digitaler Therapien (DTx) in der MEA-Region (%), nach Komponenten, 2024 Abbildung 48: Marktanteil digitaler Therapien (DTx) in der MEA-Region (%), nach Komponenten, 2033 Abbildung 49: Marktanteil digitaler Therapien (DTx) in der MEA-Region (%), nach Anwendung, 2024 Abbildung 50: Marktanteil digitaler Therapien (DTx) in der MEA-Region (%), nach Anwendung, 2033 Abbildung 51: Marktanteil digitaler Therapien (DTx) in der MEA-Region (%), nach Vertriebskanal, 2024 Abbildung 52: Marktanteil digitaler Therapien (DTx) in der MEA-Region (%), nach Vertriebskanal, 2033 Abbildung 53: Markt für digitale Therapien in Südamerika, CAGR des Top-Segments (%), 2024–2033 Abbildung 54: Marktanteil digitaler Therapien (DTx) in Südamerika (%), nach Ländern, 2024 Abbildung 55: Südamerika Marktanteile digitaler Therapien (DTx) (%), nach Land, 2033 Abbildung 56: Marktanteile digitaler Therapien (DTx) in Südamerika (%), nach Komponente, 2024 Abbildung 57: Marktanteile digitaler Therapien (DTx) in Südamerika (%), nach Komponente, 2033 Abbildung 58: Marktanteile digitaler Therapien (DTx) in Südamerika (%), nach Anwendung, 2024 Abbildung 59: Marktanteile digitaler Therapien (DTx) in Südamerika (%), nach Anwendung, 2033 Abbildung 60: Marktanteile digitaler Therapien (DTx) in Südamerika (%), nach Vertriebskanal, 2024 Abbildung 61: Marktanteile digitaler Therapien (DTx) in Südamerika (%), nach Vertriebskanal, 2033 Abbildung 62: Teladoc Health, Inc.: Umsatzsegmentierung, 2024 Abbildung 63: Teladoc Health, Inc.: Geografische Umsatzsegmentierung, 2024 Abbildung 64: Medtronic: Umsatzsegmentierung Abbildung 65: Medtronic: Geografische Umsatzsegmentierung, 2024 Abbildung 66: ResMed: Umsatzsegmentierung nach Geschäftsbereich, 2024 Abbildung 67: ResMed: Geografische Umsatzsegmentierung, 2024 Abbildung 68: Voluntis: Umsatzsegmentierung nach Geschäftsbereich, 2024 Abbildung 69: Voluntis: Geografische Umsatzsegmentierung, 2024


Merkmale | Lizenzart | ||||
Datenbuch | Einzelbenutzer |   Mehrere Benutzer | Unternehmen | ||
| E-Zugang | ✓ | ✓ | ✓ | ✓ | |
Benutzerfreigabe | Nur für 1 Benutzer | Nur für 1 Benutzer | Bis zu 7 Benutzer | Unbegrenzter Benutzerzugriff | |
⨉ | ⨉ | ⨉ | ✓ | ||
Kostenlose Anpassung | Keine kostenlose Anpassung | Bis zu 30 Stunden Arbeit | Bis zu 60 Stunden Arbeit | Bis zu 80 Arbeitsstunden | |
Lieferformat |
| ⨉ | ✓ | ✓ | ✓ |
| ✓ | ⨉ | ✓ | ✓ | |
| ⨉ | ⨉ | ⨉ | ✓ | |
Analystenunterstützung | 2 Monate Analystenunterstützung | 4 Monate Analystenunterstützung | 7 Monate Analystenunterstützung | Ein Jahr Analystenbetreuung | |
Kostenloses Bericht-Update im nächsten Aktualisierungszyklus | ⨉ | ⨉ | ⨉ | ✓ | |
Kostenloses Branchen-Update (Innerhalb von 180 Tagen) | ⨉ | ⨉ | ⨉ | ✓ | |
Nutzen | Bis zu 10 % Rabatt nach dem Kauf | Bis zu 20 % Rabatt nach dem Kauf | Bis zu 30 % Rabatt nach dem Kauf | Bis zu 40 % Rabatt nach dem Kauf | |