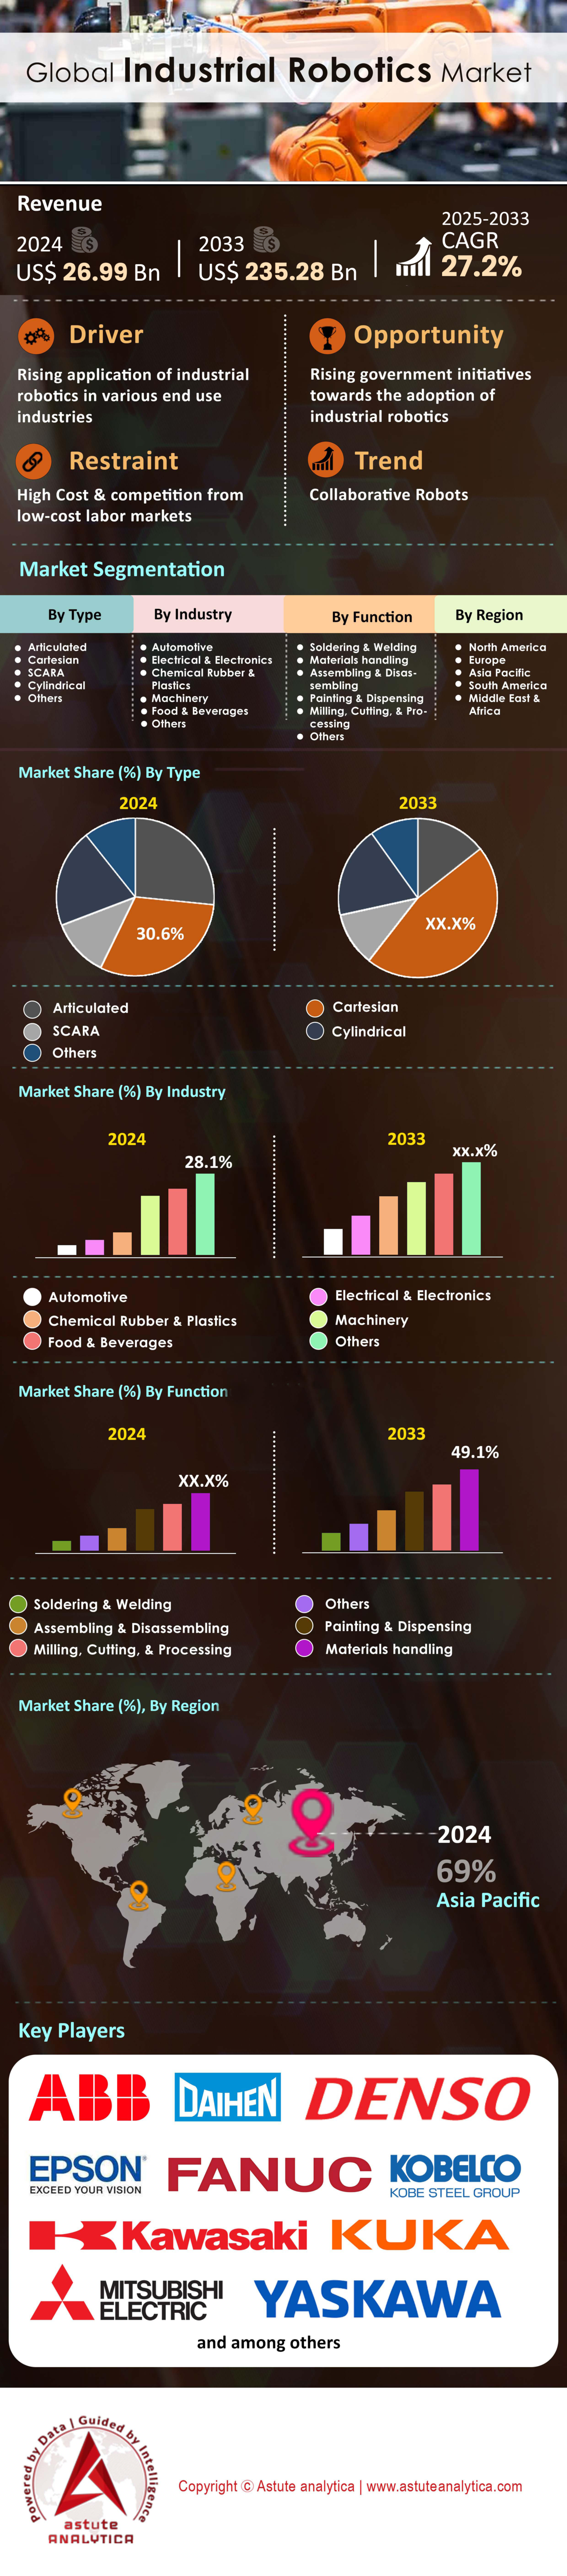
Markt für Industrieroboter: Nach Typ (Gelenkroboter, kartesische Roboter, SCARA-Roboter, Zylinderroboter und Sonstige); Branche (Automobilindustrie, Elektrotechnik & Elektronik, Chemie, Gummi & Kunststoffe, Maschinenbau, Lebensmittel & Getränke und Sonstige); Funktion (Löten & Schweißen, Materialhandhabung, Montage & Demontage, Lackieren & Dosieren, Fräsen, Schneiden & Bearbeiten und Sonstige) – Marktgröße, Branchendynamik, Chancenanalyse und Prognose für 2025–2033
- Letzte Aktualisierung: 05. Mai 2025 | | Bericht-ID: AA0423388
Tabelle 1: Wirkungsanalyse der Marktdynamik
Tabelle 2: Wettbewerbsanalyse und Benchmarking des globalen Marktes für Industrieroboter
Tabelle 3: Marktgröße für Industrieroboter weltweit (Mio. US$), nach Typ, 2020–2033
Tabelle 4: Marktgröße für Industrieroboter weltweit (Tsd. Einheiten), nach Typ, 2020–2033
Tabelle 5: Marktgröße für Industrieroboter weltweit (Mio. US$), nach Branche, 2020–2033
Tabelle 6: Marktgröße für Industrieroboter weltweit (Tsd. Einheiten), nach Branche, 2020–2033
Tabelle 7: Marktgröße für Industrieroboter weltweit (Mio. US$), nach Funktion, 2020–2033
Tabelle 8: Marktgröße für Industrieroboter weltweit (Tsd. Einheiten), nach Funktion, 2020–2033
Tabelle 9: Marktgröße für Industrieroboter weltweit (Mio. US$), nach Region, 2020–2033
Tabelle 10: Marktgröße für Industrieroboter weltweit (Tsd. Einheiten), nach Region
Tabelle 11: Markt für Industrieroboter in Nordamerika: Wirkungsanalyse – Diagramm
Tabelle 12: Marktgröße für Industrieroboter in Nordamerika (Mio. US$), nach Land, 2020–2033
Tabelle 13: Marktgröße für Industrieroboter in Nordamerika (Tsd. Einheiten), nach Land, 2020–2033
14: Marktgröße für Industrieroboter in Nordamerika (Mio. US$), nach Typ, 2020–2033
Tabelle 15: Marktgröße für Industrieroboter in Nordamerika (Tsd. Einheiten), nach Typ, 2020–2033
Tabelle 16: Marktgröße für Industrieroboter in Nordamerika (Mio. US$), nach Branche, 2020–2033
Tabelle 17: Marktgröße für Industrieroboter in Nordamerika (Tsd. Einheiten), nach Branche, 2020–2033
Tabelle 18: Marktgröße für Industrieroboter in Nordamerika (Mio. US$), nach Funktion, 2020–2033
Tabelle 19: Nordamerika Industrie Marktgröße für Industrieroboter in Europa (in Tsd. Einheiten), nach Funktion 2020–2033
Tabelle 20: Markt für Industrieroboter in Europa: Wirkungsanalyse – Diagramm
Tabelle 21: Marktgröße für Industrieroboter in Europa (in Mio. US$), nach Land, 2020–2033
Tabelle 22: Marktgröße für Industrieroboter in Europa (in Tsd. Einheiten), nach Land, 2020–2033
Tabelle 23: Marktgröße für Industrieroboter
in Europa (in Mio. US$), nach Typ, 2020–2033 Tabelle 24: Marktgröße für Industrieroboter in Europa (in Tsd. Einheiten), nach Typ, 2020–2033
Tabelle 25: Marktgröße für Industrieroboter in Europa (in Mio. US$), nach Branche 2020–2033
Tabelle 26: Marktgröße für Industrieroboter in Europa (in Tsd. Einheiten), nach Branche 2020–2033
Tabelle 27: Marktgröße für Industrieroboter in Europa (in Mio. US$), nach Funktion 2020–2033
Tabelle 28: Marktgröße für Industrieroboter in Europa (in Tsd. Einheiten), nach Funktion 2020–2033
Tabelle 29: Markt für Industrieroboter im asiatisch-pazifischen Raum: Wirkungsanalyse – Diagramm
Tabelle 30: Marktgröße für Industrieroboter im asiatisch-
pazifischen Raum (in Mio. US$), nach Land, 2020–2033 Tabelle 31: Marktgröße für Industrieroboter im asiatisch-pazifischen Raum (in Tsd. Einheiten), nach Land, 2020–2033
Tabelle 32: Marktgröße für Industrieroboter im asiatisch-pazifischen Raum (in Mio. US$), nach Typ, 2020–2033
Tabelle 33: Marktgröße für Industrieroboter im asiatisch-pazifischen Raum (in Tsd. Einheiten), nach Typ, 2020–2033
Tabelle 34: Marktgröße für Industrieroboter im asiatisch-pazifischen Raum (in Mio. US$), nach Branche 2020–2033
Tabelle 35: Marktgröße für Industrieroboter im asiatisch-pazifischen Raum (in Tsd. Einheiten), nach Branche 2020–2033
Tabelle 36: Industrieroboter im asiatisch-pazifischen Raum Marktgröße (Mio. US$), nach Funktion 2020–2033
Tabelle 37: Marktgröße für Industrieroboter im asiatisch-pazifischen Raum (Tsd. Einheiten), nach Funktion 2020–2033
Tabelle 38: Markt für Industrieroboter im Nahen Osten und Afrika: Wirkungsanalyse – Diagramm
Tabelle 39: Marktgröße für Industrieroboter im Nahen Osten und Afrika (Mio. US$), nach Land, 2020–2033
Tabelle 40: Marktgröße für Industrieroboter im Nahen Osten und Afrika (Tsd. Einheiten), nach Land, 2020–2033
Tabelle 41: Marktgröße für Industrieroboter im Nahen Osten und Afrika (Mio. US$), nach Typ, 2020–2033
Tabelle 42: Marktgröße für Industrieroboter im Nahen Osten und Afrika (Tsd. Einheiten), nach Typ, 2020–2033
Tabelle 43: Marktgröße für Industrieroboter im Nahen Osten und Afrika (Mio. US$), nach Branche 2020–2033 Tabelle 44: Marktgröße für Industrieroboter
im Nahen Osten und Afrika Marktgröße für Industrieroboter in Afrika (in Tsd. Einheiten), nach Branche 2020–2033
Tabelle 45 Marktgröße für Industrieroboter im Nahen Osten und Afrika (in Mio. US$), nach Funktion 2020–2033
Tabelle 46 Marktgröße für Industrieroboter im Nahen Osten und Afrika (in Tsd. Einheiten), nach Funktion 2020–2033
Tabelle 47 Marktgröße für Industrieroboter in Südamerika: Wirkungsanalyse – Diagramm
Tabelle 48 Marktgröße für Industrieroboter in Südamerika (in Mio. US$), nach Land, 2020–2033
Tabelle 49 Marktgröße für Industrieroboter in Südamerika (in Tsd. Einheiten), nach Land, 2020–2033
Tabelle 50 Marktgröße für Industrieroboter in Südamerika (in Mio. US$), nach Typ, 2020–2033
Tabelle 51 Marktgröße für Industrieroboter in Südamerika (in Tsd. Einheiten), nach Typ, 2020–2033
Tabelle 52 Marktgröße für Industrieroboter in Südamerika (in Mio. US$)
Tabelle 53: Marktgröße für Industrieroboter in Südamerika (in Tsd. Einheiten
Tabelle 54: Marktgröße für Industrieroboter in Südamerika (in Mio. US$) nach Funktion 2020–2033
; Tabelle 55: Marktgröße für Industrieroboter in Südamerika (in Tsd. Einheiten) nach Funktion 2020–2033;
Tabelle 56: ABB Ltd.: Aktuelle Entwicklungen
; Tabelle 57: ABB Ltd.: Produktmerkmale
; Tabelle 58: ABB Ltd.: Finanzanalyse;
Tabelle 59: DAIHEN Corporation: Produktmerkmale
; Tabelle 60: DAIHEN Corporation: Finanzanalyse
; Tabelle 61: DENSO Corporation: Aktuelle Entwicklungen
; Tabelle 62: DENSO Corporation: Produktmerkmale
; Tabelle 63: DENSO Corporation: Finanzanalyse;
Tabelle 64: Epson America, Inc.: Aktuelle Entwicklungen
; Tabelle 65: Epson America, Inc.: Produktmerkmale
; Tabelle 66: Seiko Epson Corporation (Muttergesellschaft): Finanzanalyse
Tabelle:67 Fanuc Corporation: Aktuelle Entwicklungen
Tabelle:68 Fanuc Corporation: Produktmerkmale
Tabelle:69 Tabelle: Fanuc Corporation: Finanzanalyse
Tabelle:70 Kawasaki Heavy Industries Limited: Aktuelle Entwicklungen
Tabelle:71 Kawasaki Heavy Industries Limited: Produktmerkmale
Tabelle:72 Tabelle: Kawasaki Heavy Industries Limited: Finanzanalyse
Tabelle:73 Kobe Steel, Limited: Produktmerkmale
Tabelle:74 Tabelle: Kobe Steel, Limited: Finanzanalyse
Tabelle:75 KUKU AG: Aktuelle Entwicklungen
Tabelle:76 KUKU AG: Produktmerkmale
Tabelle:77 Tabelle: KUKU AG: Finanzanalyse
Tabelle:78 Mitsubishi Electric Corporation: Aktuelle Entwicklungen
Tabelle:79 Mitsubishi Electric Corporation: Produktmerkmale
Tabelle:80 Tabelle: Mitsubishi Electric Corporation: Finanzanalyse
Tabelle:81 Yaskawa Electric Corporation: Aktuelle Entwicklungen
Tabelle:82 Yaskawa Electric Corporation: Produktmerkmale
Tabelle:83 Tabelle: Yaskawa Electric Corporation: Finanzanalyse
Abbildung 1: Globaler Markt für Industrieroboter nach Umsatz (Mio. US$) und Stückzahl (Tsd. Einheiten), 2020–2033.
Abbildung 2: Globaler Markt für Industrieroboter nach jährlichem Wachstum (%), 2020–2033.
Abbildung 3: Globaler Markt für Industrieroboter: Umsatzvergleich (Mio. US$) nach Branche, 2024, 2026, 2033.
Abbildung 4: Globaler Markt für Industrieroboter: Jährliche Installationen von Industrierobotern – China (in Tsd. Einheiten).
Abbildung 5: Globaler Markt für Industrieroboter: Jährliche Installationen von Industrierobotern – Japan (in Tsd. Einheiten).
Abbildung 6: Globaler Markt für Industrieroboter: Jährliche Installationen von Industrierobotern – USA (in Tsd. Einheiten)
. Abbildung 7: Globaler Markt für Industrieroboter: Jährliche Installationen von Industrierobotern – Deutschland (in Tsd. Einheiten).
Abbildung 8: Globaler Markt für Industrieroboter: Jährliche Installationen von Industrierobotern (in Tsd.) – Weltweit (2015–2024).
Abbildung 9: Globaler Markt für Industrieroboter Robotikmarkt: Jährliches durchschnittliches globales reales Monatslohnwachstum, 2016–2021 (in Prozent)
Abbildung 10: Globaler Markt für Industrieroboter: Einführung kollaborativer Roboter, 2019–2024
Abbildung 11: Globaler Markt für Industrieroboter, Auswirkungen von Covid-19 und Erholung, jährlich (%), 2020–2033
Abbildung 12: Globaler Markt für Industrieroboter: Produktpreise (US$)
Abbildung 13: Globaler Markt für Industrieroboter: Marktkonzentration (2024)
Abbildung 14: Globaler Markt für Industrieroboter: Marktanteilsanalyse nach Unternehmen, basierend auf dem Umsatz (2024)
Abbildung 15: Globaler Markt für Industrieroboter, nach Typ, CAGR (%), 2024–2033
Abbildung 16: Globaler Marktanteil für Industrieroboter (%), nach Typ, 2024
Abbildung 17: Globaler Marktanteil für Industrieroboter (%), nach Typ, 2033
Abbildung 18: Globaler Markt für Industrieroboter, nach Branche, CAGR (%), 2024–2033
Abbildung 19: Weltweiter Marktanteil für Industrieroboter (%), nach Branche, 2024;
Abbildung 20: Weltweiter Marktanteil für Industrieroboter (%), nach Branche, 2033;
Abbildung 21: Weltweiter Markt für Industrieroboter nach Funktion, CAGR (%), 2024–2033
; Abbildung 22: Weltweiter Marktanteil für Industrieroboter (%), nach Funktion, 2024;
Abbildung 23: Weltweiter Marktanteil für Industrieroboter (%), nach Funktion, 2033;
Abbildung 24: Weltweiter Markt für Industrieroboter nach Region, CAGR (%), 2024–2033;
Abbildung 25: Weltweiter Marktanteil für Industrieroboter (%), nach Region, 2024;
Abbildung 26: Weltweiter Marktanteil für Industrieroboter (%), nach Region, 2033;
Abbildung 27: Nordamerikanischer Markt für Industrieroboter: Segment mit dem höchsten Anteil (%);
Abbildung 28: Nordamerikanischer Markt für Industrieroboter: Nettopotenzial (in Mio. US-Dollar);
Abbildung 29: Nordamerikanischer Markt für Industrieroboter: Potenzialanalyse nach Typ
Abbildung 30: Markt für Industrieroboter in Nordamerika: Chancenanalyse nach Branche
; Abbildung 31: Markt für Industrieroboter in Nordamerika: Chancenanalyse nach Funktion
; Abbildung 32: Marktanteil (%) nach Land, 2024;
Abbildung 33: Marktanteil (%) nach Land, 2033;
Abbildung 34: Marktanteil (%) nach Typ, 2024
; Abbildung 35: Marktanteil (%) nach Typ, 2033
; Abbildung 36: Marktanteil (%) nach Branche, 2024;
Abbildung 37: Marktanteil (%) nach Branche, 2033;
Abbildung 38: Marktanteil (%) nach Funktion, 2024;
Abbildung 39: Marktanteil (%) nach Funktion, 2033;
Abbildung 40: Markt für Industrieroboter in Europa: Segment mit dem höchsten Marktanteil (%);
Abbildung 41: Marktpotenzial in Europa Zusätzliche Angaben in Mio. US$
Abbildung 42: Europäischer Markt für Industrieroboter: Chancenanalyse nach Typ
Abbildung 43: Europäischer Markt für Industrieroboter: Chancenanalyse nach Branche
Abbildung 44: Europäischer Markt für Industrieroboter: Chancenanalyse nach Funktion
Abbildung 45: Marktanteil (%) nach Land, 2024
Abbildung 46: Marktanteil (%) nach Land, 2033
Abbildung 47: Marktanteil (%) nach Typ, 2024
Abbildung 48: Marktanteil (%) nach Typ, 2033
Abbildung 49: Marktanteil (%) nach Branche, 2024
Abbildung 50: Marktanteil (%) nach Branche, 2033
Abbildung 51: Marktanteil (%) nach Funktion, 2024
Abbildung 52: Marktanteil (%) nach Funktion, 2033
Abbildung 53: Asien-Pazifik-Markt für Industrieroboter: Höchster Anteil (%) Segment
Abbildung:54 Asien-Pazifik-Markt für Industrieroboter: Nettopotenzialzuwachs in Mio. US$
Abbildung:55 Asien-Pazifik-Markt für Industrieroboter: Potenzialanalyse nach Typ
Abbildung:56 Asien-Pazifik-Markt für Industrieroboter: Potenzialanalyse nach Branche
Abbildung:57 Asien-Pazifik-Markt für Industrieroboter: Potenzialanalyse nach Funktion
Abbildung:58 Marktanteil (%) im Bereich Industrieroboter im asiatisch-pazifischen Raum nach Land, 2024
Abbildung:59 Marktanteil (%) im Bereich Industrieroboter im asiatisch-
pazifischen Raum nach Land, 2033 Abbildung:60 Marktanteil (%) im Bereich Industrieroboter im asiatisch-pazifischen Raum nach Typ, 2024
Abbildung:61 Marktanteil (%) im Bereich Industrieroboter im asiatisch-pazifischen Raum nach Typ, 2033
Abbildung:62 Marktanteil (%) im Bereich Industrieroboter im asiatisch-pazifischen Raum nach Branche, 2024
Abbildung:63 Marktanteil (%) im Bereich Industrieroboter im asiatisch-pazifischen Raum nach Branche, 2033
Abbildung:64 Marktanteil (%) im Bereich Industrieroboter im asiatisch-pazifischen Raum nach Funktion
: Marktanteil der Industrieroboter im asiatisch-pazifischen Raum (%), nach Funktion, 2033;
Abbildung 66: Markt für Industrieroboter im Nahen Osten und Afrika: Segment mit dem höchsten Anteil (%);
Abbildung 67: Netto-Potenzialzuwachs in Mio. US$
; Abbildung 68: Potenzialanalyse nach Typ
; Abbildung 69: Potenzialanalyse nach Branche
70: Potenzialanalyse nach Funktion
; Abbildung 71: Marktanteil der Industrieroboter im Nahen Osten und Afrika (%), nach Land, 2024;
Abbildung 72: Marktanteil der Industrieroboter im Nahen Osten und Afrika (%), nach Land, 2033;
Abbildung 73: Marktanteil der Industrieroboter im Nahen Osten und Afrika (%), nach Typ, 2024
; Abbildung 74: Marktanteil der Industrieroboter im Nahen Osten und Afrika (%), nach Typ, 2033;
Abbildung 75: Marktanteil der Industrieroboter im Nahen Osten und Afrika (%), nach Branche, 2024;
Abbildung 76: Marktanteil der Industrieroboter im Nahen Osten und Afrika (%), nach Branche
: Marktanteil der Industrieroboter im Nahen Osten und Afrika (%), nach Funktion, 2024;
Abbildung 78: Marktanteil der Industrieroboter im Nahen Osten und Afrika (%), nach Funktion, 2033;
Abbildung 79: Markt für Industrieroboter in Südamerika: Segment mit dem höchsten Anteil (%)
; Abbildung 80: Netto-Potenzialzuwachs in Mio. US$
; Abbildung 81: Potenzialanalyse nach Typ
; Abbildung 82: Potenzialanalyse nach Branche;
83: Potenzialanalyse nach Funktion
; Abbildung 84: Marktanteil der Industrieroboter in Südamerika (%), nach Land, 2024
; Abbildung 85: Marktanteil der Industrieroboter in Südamerika (%), nach Land, 2033
; Abbildung 86: Marktanteil der Industrieroboter in Südamerika (%), nach Typ, 2024
; Abbildung 87: Marktanteil der Industrieroboter in Südamerika (%), nach Typ, 2033;
Abbildung 88: Marktanteil der Industrieroboter in Südamerika (%), nach Branche, 2024
; Abbildung 89: Marktanteil der Industrieroboter in Südamerika (%), Nach Branche, 2033
Abbildung:90 Marktanteil Südamerika Industrieroboter (%), Nach Funktion, 2024
Abbildung:91 Marktanteil Südamerika Industrieroboter (%), Nach Funktion, 2033
Abbildung:92 ABB Ltd.: Umsatzsegmentierung nach Geschäftsfeld, 2024
Abbildung:93 ABB Ltd.: Umsatzsegmentierung nach geografischem Gebiet, 2024
Abbildung:94 DAIHEN Corporation: Umsatzsegmentierung nach Geschäftsfeld, 2024
Abbildung:95 DAIHEN Corporation: Umsatzsegmentierung nach geografischem Gebiet, 2024 Abbildung
:96 DENSO Corporation: Umsatzsegmentierung nach Geschäftsfeld, 2024
Abbildung:97 DENSO Corporation: Umsatzsegmentierung nach geografischem Gebiet, 2024
Abbildung:98 Epson America, Inc.: Umsatzsegmentierung nach Geschäftsfeld, 2024
Abbildung:99 Epson America, Inc.: Umsatzsegmentierung nach geografischem Gebiet, 2024
Abbildung:100 Fanuc Corporation: Umsatzsegmentierung nach Geschäftsfeld, 2024
Abbildung 101: Fanuc Corporation: Geografische Umsatzsegmentierung, 2024;
Abbildung 102: Kawasaki Heavy Industries Limited: Umsatzsegmentierung nach Geschäftsbereichen, 2024;
Abbildung 103: Kawasaki Heavy Industries Limited: Geografische Umsatzsegmentierung, 2024;
Abbildung 104: Kobe Steel, Limited: Umsatzsegmentierung nach Geschäftsbereichen, 2024;
Abbildung 105: Kobe Steel, Limited: Geografische Umsatzsegmentierung, 2024;
Abbildung 106: KUKU AG: Umsatzsegmentierung nach Geschäftsbereichen, 2024;
Abbildung 107: KUKU AG: Geografische Umsatzsegmentierung, 2024;
Abbildung 108: Mitsubishi Electric Corporation: Umsatzsegmentierung nach Geschäftsbereichen, 2024
; Abbildung 109: Mitsubishi Electric Corporation: Geografische Umsatzsegmentierung, 2024;
Abbildung 110: Yaskawa Electric Corporation: Umsatzsegmentierung nach Geschäftsbereichen, 2024
; Abbildung 111: Yaskawa Electric Corporation: Geografische Umsatzsegmentierung, 2024


Merkmale | Lizenzart | ||||
Datenbuch | Einzelbenutzer |   Mehrere Benutzer | Unternehmen | ||
| E-Zugang | ✓ | ✓ | ✓ | ✓ | |
Benutzerfreigabe | Nur für 1 Benutzer | Nur für 1 Benutzer | Bis zu 7 Benutzer | Unbegrenzter Benutzerzugriff | |
⨉ | ⨉ | ⨉ | ✓ | ||
Kostenlose Anpassung | Keine kostenlose Anpassung | Bis zu 30 Stunden Arbeit | Bis zu 60 Stunden Arbeit | Bis zu 80 Arbeitsstunden | |
Lieferformat |
| ⨉ | ✓ | ✓ | ✓ |
| ✓ | ⨉ | ✓ | ✓ | |
| ⨉ | ⨉ | ⨉ | ✓ | |
Analystenunterstützung | 2 Monate Analystenunterstützung | 4 Monate Analystenunterstützung | 7 Monate Analystenunterstützung | Ein Jahr Analystenbetreuung | |
Kostenloses Bericht-Update im nächsten Aktualisierungszyklus | ⨉ | ⨉ | ⨉ | ✓ | |
Kostenloses Branchen-Update (Innerhalb von 180 Tagen) | ⨉ | ⨉ | ⨉ | ✓ | |
Nutzen | Bis zu 10 % Rabatt nach dem Kauf | Bis zu 20 % Rabatt nach dem Kauf | Bis zu 30 % Rabatt nach dem Kauf | Bis zu 40 % Rabatt nach dem Kauf | |