Markt für medizinische Kompressionsbekleidung in Großbritannien: Nach Produkt (Oberkörperkompressionsbekleidung, Unterkörperkompressionsbekleidung, Antiemboliestrümpfe und Sonstige); Klasse (Klasse 1 (14–17 mmHg), Klasse 2 (18–24 mmHg) und Klasse 3 (25–35 mmHg)); Anwendung (Krampfadern, tiefe Venenthrombose, Wundversorgung und Sonstige); Endnutzer (Krankenhäuser, Kliniken, ambulante Operationszentren und Sonstige) – Branchendynamik, Marktgröße und Wachstumsprognose für 2025–2033
- Letzte Aktualisierung: 04. Februar 2025 | | Bericht-ID: AA0522226
Tabelle 1 Marktdynamik und Trends – Trends: Wirkungsanalyse der Marktdynamik
Tabelle 2 Produktpreisanalyse: Preisanalyse (Durchschnittspreise in US-Dollar)
Tabelle 3 Wettbewerbsübersicht: Kartierung und Benchmarking der Wettbewerber für medizinische Kompressionsbekleidung in Großbritannien
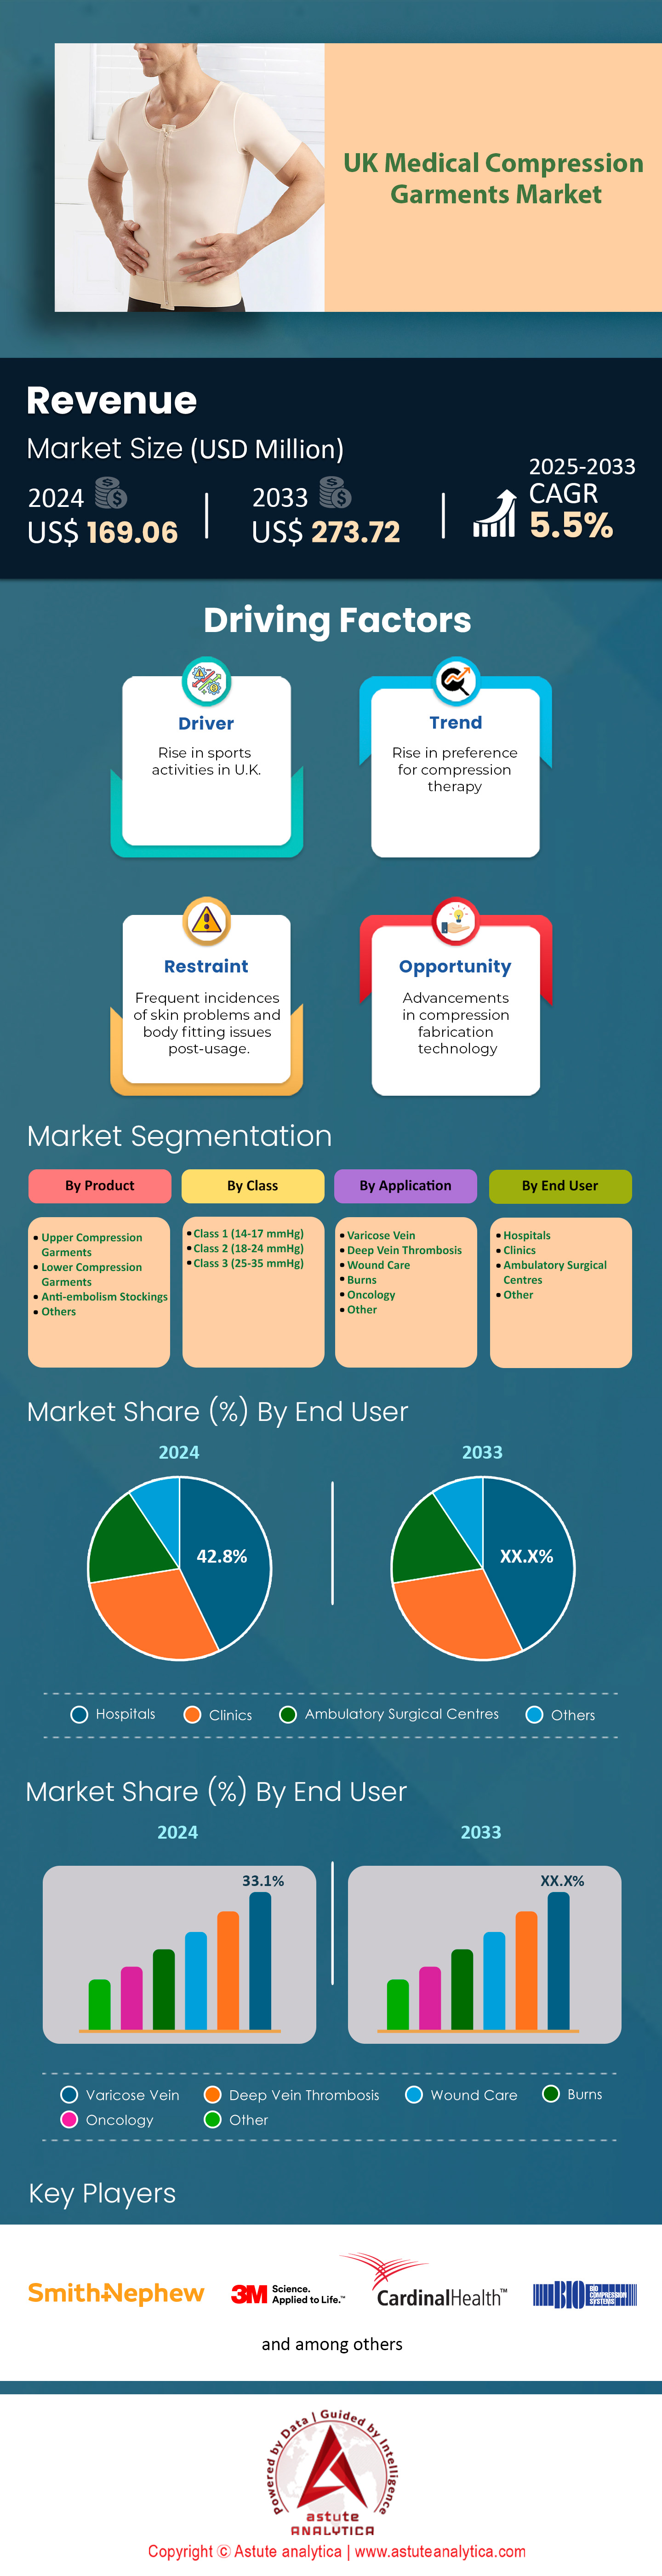
Tabelle 4 Marktgröße für medizinische Kompressionsbekleidung in Großbritannien (Mio. US-Dollar), nach Produkt, 2020–2033
Tabelle 5 Marktgröße für medizinische Kompressionsbekleidung in Großbritannien (Tsd. Einheiten), nach Produkt, 2020–2033
Tabelle 6 Marktgröße für medizinische Kompressionsbekleidung in Großbritannien (Mio. US-Dollar), nach Klasse, 2020–2033
Tabelle 7 Marktgröße für medizinische Kompressionsbekleidung in Großbritannien (Tsd. Einheiten), nach Klasse, 2020–2033
Tabelle 8 Marktgröße für medizinische Kompressionsbekleidung in Großbritannien (Mio. US-Dollar), nach Anwendung, 2020–2033
Tabelle 9 Marktgröße für medizinische Kompressionsbekleidung in Großbritannien (Tsd. Einheiten), nach Anwendung, 2020–2033
Tabelle 10 Medizinische Kompressionsbekleidung in Großbritannien Marktgröße (Mio. US$), nach Endverbraucher, 2020–2033
Tabelle 11 Marktgröße für medizinische Kompressionsbekleidung in Großbritannien (Tsd. Einheiten), nach Endverbraucher, 2020–2033
Tabelle 12 3M Company: Produkte
Tabelle 13 3M Company: Finanzanalyse
Tabelle 14 Bio Compression System: Produkte
Tabelle 15 Cardinal Health, Inc.: Produkte
Tabelle 16 Cardinal Health, Inc.: Finanzanalyse
Tabelle 17 Essity AB (BSN Medical GmbH): Produkte
Tabelle 18 Essity AB (BSN Medical GmbH): Finanzanalyse
Tabelle 19 Eurosurgical Ltd: Produkte
Tabelle 20 Judd Medical: Produkte
Tabelle 21 Juzo: Produkte
Tabelle 22 Lipoelastic: Produkte
Tabelle 23 Medasun Medical: Produkte
Tabelle 24 Medi GmbH & Co. KG: Produkte
Tabelle 25 Sigvaris, Inc.: Produkte
Tabelle 26 Smith & Nephew Plc.: Produkte
Tabelle 27 Smith & Nephew Plc.: Finanzanalyse
Tabelle 28 Weitere bedeutende Akteure
Abbildung 1: Marktumsatzprognosen (Mio. US$), 2017–2033.
Abbildung 2: Marktvolumenprognosen (Tsd. Einheiten), 2017–2033.
Abbildung 3: Zusammenfassung: Das Segment der Kompressionsbekleidung für den Oberkörper dominiert den Markt für medizinische Kompressionsbekleidung.
Abbildung 4: Zusammenfassung: Marktanteile medizinischer Kompressionsbekleidung in Großbritannien 2024 und 2033.
Abbildung 5: Marktdynamik und Trends – Treiber: Notfallaufnahmen und -behandlungen in britischen Notaufnahmen im März 2017–2022.
Abbildung 6: Marktdynamik und Trends – Treiber: Mindestens zwei Teilnahmen in den letzten 28 Tagen (ab 16 Jahren) an ausgewählten Aktivitätsgruppen, 2017–2024 (in Millionen).
Abbildung 7: Auswirkungen und Erholung von COVID-19: Markt für medizinische Kompressionsbekleidung in Großbritannien, Auswirkungen und Erholung von COVID-19, 2017–2033 (in %).
Abbildung 8: Wettbewerbsanalyse Dashboard: Marktanteilsanalyse nach Unternehmen, basierend auf dem Umsatz (2020)
Abbildung 9 Markt für medizinische Kompressionsbekleidung in Großbritannien, nach Produkt, CAGR (%), 2024–2033
Abbildung 10 Marktanteil für medizinische Kompressionsbekleidung in Großbritannien (%), nach Produkt, 2024
Abbildung 11 Marktanteil für medizinische Kompressionsbekleidung in Großbritannien (%), nach Produkt, 2033
Abbildung 12 Markt für medizinische Kompressionsbekleidung in Großbritannien, nach Klasse, CAGR (%), 2024–2033
Abbildung 13 Marktanteil für medizinische Kompressionsbekleidung in Großbritannien (%), nach Klasse, 2024
Abbildung 14 Marktanteil für medizinische Kompressionsbekleidung in Großbritannien (%), nach Klasse, 2033
Abbildung 15 Markt für medizinische Kompressionsbekleidung in Großbritannien, nach Anwendung, CAGR (%), 2024–2033
Abbildung 16 Marktanteil für medizinische Kompressionsbekleidung in Großbritannien (%), nach Anwendung, 2024
Abbildung 17 Marktanteil für medizinische Kompressionsbekleidung in Großbritannien (%), nach Anwendung, 2033
Abbildung 18 Markt für medizinische Kompressionsbekleidung in Großbritannien Nach Endnutzer, CAGR (%), 2024–2033
Abbildung 19 Marktanteil (%) des britischen Marktes für medizinische Kompressionsbekleidung nach Endnutzer, 2024
Abbildung 20 Marktanteil (%) des britischen Marktes für medizinische Kompressionsbekleidung nach Endnutzer, 2033
Abbildung 21 3M Company: Umsatzsegmentierung nach Geschäftsfeld, 2024
Abbildung 22 3M Company: Umsatzsegmentierung nach Region, 2024
Abbildung 23 Cardinal Health, Inc.: Umsatzsegmentierung nach Geschäftsfeld, 2024
Abbildung 24 Cardinal Health, Inc.: Umsatzsegmentierung nach Region, 2024
Abbildung 25 Essity AB (BSN medical GmbH): Umsatzsegmentierung nach Geschäftsfeld, 2024
Abbildung 26 Essity AB (BSN medical GmbH): Umsatzsegmentierung nach Region, 2024
Abbildung 27 Smith and Nephew Plc.: Umsatzsegmentierung nach Geschäftsfeld, 2024
Abbildung 28 Smith and Nephew Plc.: Umsatzsegmentierung nach Region, 2024


Merkmale | Lizenzart | ||||
Datenbuch | Einzelbenutzer |   Mehrere Benutzer | Unternehmen | ||
| E-Zugang | ✓ | ✓ | ✓ | ✓ | |
Benutzerfreigabe | Nur für 1 Benutzer | Nur für 1 Benutzer | Bis zu 7 Benutzer | Unbegrenzter Benutzerzugriff | |
⨉ | ⨉ | ⨉ | ✓ | ||
Kostenlose Anpassung | Keine kostenlose Anpassung | Bis zu 30 Stunden Arbeit | Bis zu 60 Stunden Arbeit | Bis zu 80 Arbeitsstunden | |
Lieferformat |
| ⨉ | ✓ | ✓ | ✓ |
| ✓ | ⨉ | ✓ | ✓ | |
| ⨉ | ⨉ | ⨉ | ✓ | |
Analystenunterstützung | 2 Monate Analystenunterstützung | 4 Monate Analystenunterstützung | 7 Monate Analystenunterstützung | Ein Jahr Analystenbetreuung | |
Kostenloses Bericht-Update im nächsten Aktualisierungszyklus | ⨉ | ⨉ | ⨉ | ✓ | |
Kostenloses Branchen-Update (Innerhalb von 180 Tagen) | ⨉ | ⨉ | ⨉ | ✓ | |
Nutzen | Bis zu 10 % Rabatt nach dem Kauf | Bis zu 20 % Rabatt nach dem Kauf | Bis zu 30 % Rabatt nach dem Kauf | Bis zu 40 % Rabatt nach dem Kauf | |