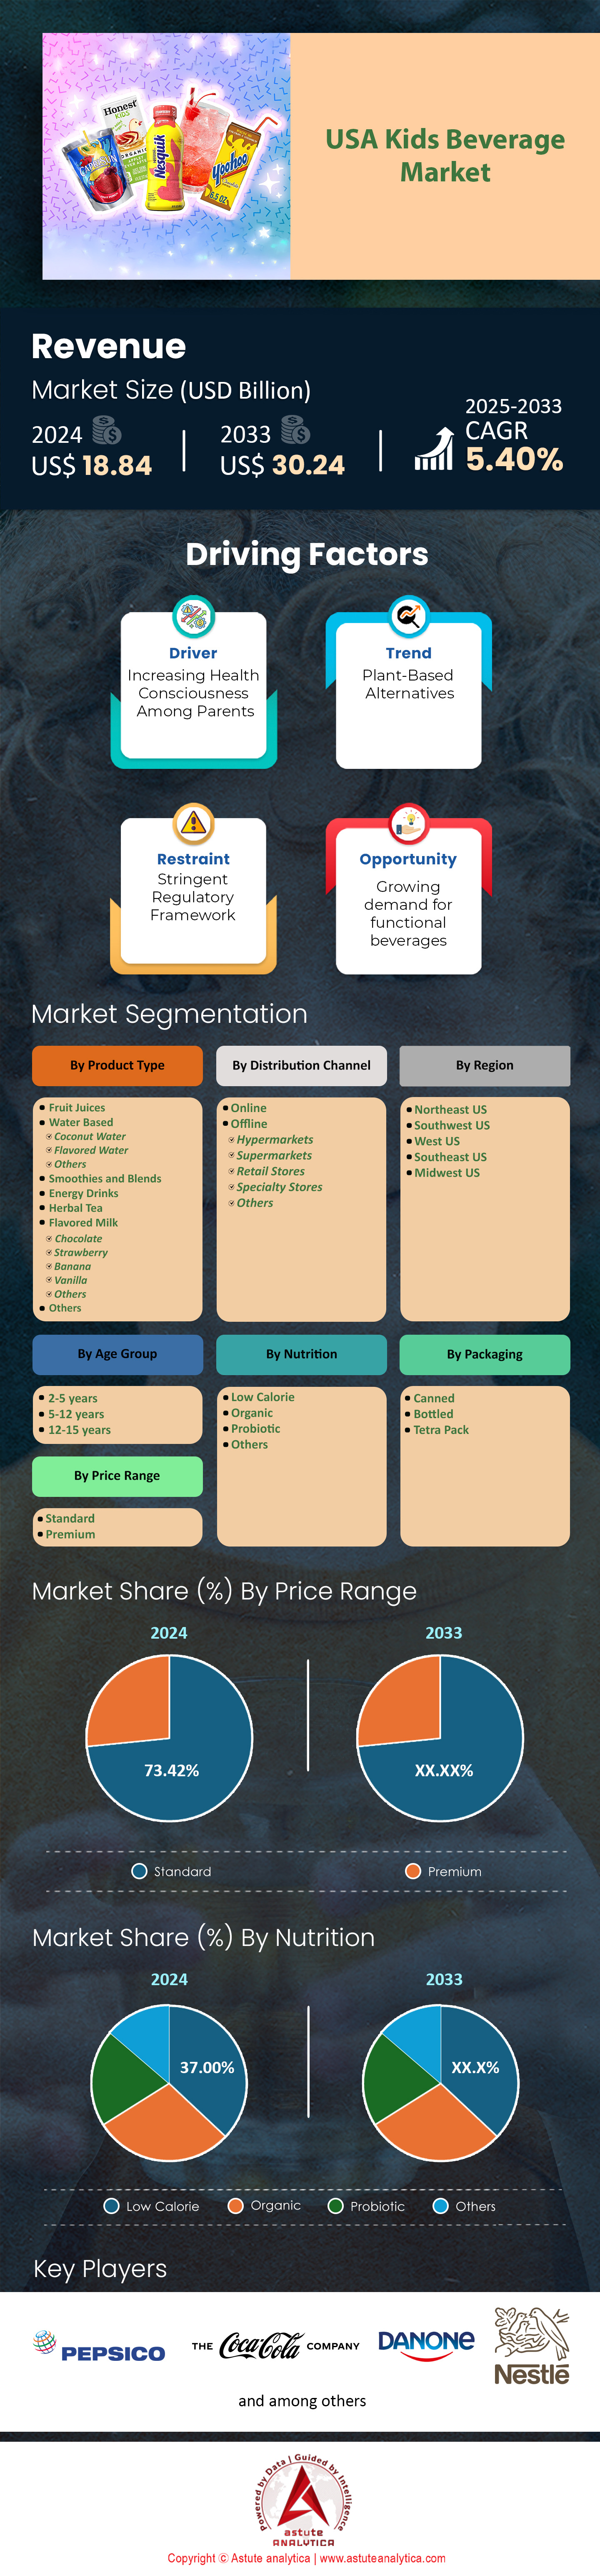
US-amerikanischer Markt für Kindergetränke: Nach Produkttyp (Fruchtsäfte, Wassergetränke, Smoothies und Mixgetränke, Energy-Drinks, Kräutertees, aromatisierte Milch, Sonstige); Nährwert (kalorienarm, Bio, probiotisch, Sonstige); Altersgruppe (2–5 Jahre, 5–12 Jahre, 12–15 Jahre); Verpackung (Dosen, Flaschen, Tetrapacks); Preisspanne (Standard, Premium); Vertriebskanal (Online, Offline); Region – Marktprognose und -analyse für 2025–2033
- Letzte Aktualisierung: 04. Mai 2025 | | Bericht-ID: AA0623458
Tabelle 1: Branchenausblick: Empfehlungen für einen gesunden Getränkekonsum (5–18 Jahre) Tabelle 2: Branchenausblick: Anteil der Kinder im Alter von 1–5 Jahren, die in der Vorwoche zuckergesüßte Getränke konsumiert haben, nach soziodemografischen Merkmalen – USA, 2021 Tabelle 3: Hemmnisse: Strenger regulatorischer Rahmen Tabelle 4: Marktdynamik und -trends: Wirkungsanalyse der Marktdynamik Tabelle 5: Produktpreisanalyse: Preisanalyse nach Produkttyp (in US$ pro Einheit) Tabelle 6: Marktgröße für Kindergetränke in den USA (Mrd. US$), nach Produkttyp, 2020–2033 Tabelle 7: Marktgröße für Kindergetränke in den USA (Mrd. US$), nach Nährwert, 2020–2033 Tabelle 8: Marktgröße für Kindergetränke in den USA (Mrd. US$), nach Altersgruppe, 2020–2033 Tabelle 9: Marktgröße für Kindergetränke in den USA (Mrd. US$), nach Verpackung, 2020–2033 Tabelle 10: Marktgröße für Kindergetränke in den USA (Mrd. US$), nach Preissegment, 2020–2033. Tabelle 11: Marktgröße für Kindergetränke in den USA (Mrd. US$), nach Vertriebskanal, 2020–2033. Tabelle 12: Marktgröße für Kindergetränke in den USA (Mrd. US$), nach Region, 2020–2033. Tabelle 13: Marktgröße für Kindergetränke im Nordosten der USA (Mrd. US$), nach Produkttyp, 2020–2033. Tabelle 14: Marktgröße für Kindergetränke im Nordosten der USA (Mrd. US$), nach Nährwert, 2020–2033. Tabelle 15: Marktgröße für Kindergetränke im Nordosten der USA (Mrd. US$), nach Altersgruppe, 2020–2033. Tabelle 16: Marktgröße für Kindergetränke im Nordosten der USA (Mrd. US$), nach Verpackung, 2020–2033 . Tabelle 17: Marktgröße für Kindergetränke im Nordosten der USA (Mrd. US$),), nach Vertriebskanal, 2020–2033; nach Verpackungsart, 2020–2033. Tabelle 18: Marktgröße für Kindergetränke im Nordosten der USA (Mrd. US$ Tabelle 19: Marktgröße für Kindergetränke im Südwesten der USA (Mrd. US$), nach Produkttyp, 2020–2033 ; Tabelle 20: Marktgröße für Kindergetränke im Südwesten der USA (Mrd. US$), nach Nährwert, 2020–2033; Tabelle 21: Marktgröße für Kindergetränke im Südwesten der USA (Mrd. US$), nach Altersgruppe, 2020–2033; Tabelle 22: Marktgröße für Kindergetränke im Südwesten der USA (Mrd. US$), nach Verpackung, 2020–2033; Tabelle 23: Marktgröße für Kindergetränke im Südwesten der USA (Mrd. US$), nach Preisspanne, 2020–2033; Tabelle 24: Marktgröße für Kindergetränke im Südwesten der USA (Mrd. US$), nach VertriebskanalTabelle Tabelle 25: Marktgröße für Kindergetränke im Westen der USA (Mrd. US$), nach Produkttyp, 2020–2033; 26: Marktgröße für Kindergetränke im Westen der USA (Mrd. US$), nach Nährwert, 2020–2033; Tabelle 27: Marktgröße für Kindergetränke im Westen der USA (Mrd. US$), nach Altersgruppe, 2020–2033; Tabelle 28: Marktgröße für Kindergetränke im Westen der USA (Mrd. US$), nach Verpackung, 2020–2033 ; Tabelle 29: Marktgröße für Kindergetränke im Westen der USA (Mrd. US$), nach Preisspanne, 2020–2033 ; Tabelle 30: Marktgröße für Kindergetränke im Westen der USA (Mrd. US$), nach Vertriebskanal, 2020–2033; Tabelle 31: Marktgröße für Kindergetränke im Südosten der USA (Mrd. US$), nach Produkttyp, 2020–2033 ; Tabelle 32:Marktgröße für Kindergetränke (Mrd. US$), nach Nährwert, 2020–2033 Marktgröße für Kindergetränke im Südosten der USA (Mrd. US$), nach Produkttyp, 2020–2033 Tabelle: 33 Marktgröße für Kindergetränke im Südosten der USA (Mrd. US$), nach Altersgruppe, 2020–2033 Tabelle: 34 Marktgröße für Kindergetränke im Südosten der USA (Mrd. US$), nach Verpackung, 2020–2033 Tabelle: 35 Marktgröße für Kindergetränke im Südosten der USA (Mrd. US$), nach Preisspanne, 2020–2033 Tabelle: 36 Marktgröße für Kindergetränke im Südosten der USA (Mrd. US$), nach Vertriebskanal, 2020–2033 Tabelle: 37 Marktgröße für Kindergetränke im Mittleren Westen der USA (Mrd. US$), nach Produkttyp, 2020–2033 Tabelle: 38 Marktgröße für Kindergetränke im Mittleren Westen der USA (Mrd. US$), nach Nährwert, 2020–2033 Tabelle: 39 Marktgröße für Kindergetränke im Mittleren Westen der USA (Mrd. US$), nach Alter Gruppe, 2020–2033 Tabelle: 40 Marktgröße für Kindergetränke im Mittleren Westen der USA (Mrd. US$), nach Verpackung, 2020–2033 Tabelle: 41 Marktgröße für Kindergetränke im Mittleren Westen der USA (Mrd. US$), nach Preisspanne, 2020–2033 Tabelle: 42 Marktgröße für Kindergetränke im Mittleren Westen der USA (Mrd. US$), nach Vertriebskanal, 2020–2033 Tabelle: 43 Atkins Nutritionals Inc.: Produkte Tabelle: 44 Britvic PLC: Aktuelle Entwicklungen Tabelle: 45 Britvic PLC: Produkte Tabelle: 46 Britvic PLC: Finanzanalyse Tabelle: 47 Campbell Soup Company: Produkte Tabelle: 48 Campbell Soup Company: Finanzanalyse Tabelle: 49 Danone SA: Produkte Tabelle: 50 Danone SA: Finanzanalyse Tabelle: 51 Groupe Lactalis: Produkte Tabelle: 52 Groupe Lactalis: Finanzanalyse Tabelle: 53 Honest Tea :54 Honest Tea: Produkttabelle Aktuelle Entwicklungen : 55 Kellogg Company: Tabelle der aktuellen Entwicklungen: 56 Kellogg Company: Produkttabelle : 57 Kellogg Company: Tabelle der Finanzanalyse : 58 Keurig Dr Pepper Inc.: Tabelle der aktuellen Entwicklungen: 59 Keurig Dr Pepper Inc.: Produkttabelle : 60 Keurig Dr Pepper Inc.: Tabelle der Finanzanalyse : 61 Kiddiwinks: Tabelle der aktuellen Entwicklungen: 62 Kiddiwinks: Produkttabelle : 63 Kraft Heinz Company: Tabelle der aktuellen Entwicklungen : 64 Kraft Heinz Company: Produkttabelle : 65 Kraft Heinz Company: Tabelle der Finanzanalyse : 66 Lifeway Foods Inc.: Tabelle der aktuellen Entwicklungen : 67 Lifeway Foods Inc.: Produkttabelle : 68 Lifeway Foods Inc.: Tabelle der Finanzanalyse : 69 Mondelez International Inc.: Tabelle der aktuellen Entwicklungen: 70 Mondelez International Inc.: Produkttabelle : 71 Mondelez International Inc.: Tabelle der Finanzanalyse : 72 Nestlé SA: Aktuelle Entwicklungen Tabelle 73: Nestlé SA: Angebote Tabelle 74: Nestlé SA: Finanzanalyse Tabelle 75: PepsiCo, Inc.: Aktuelle Entwicklungen Tabelle 76: PepsiCo, Inc.: Angebote Tabelle 77: PepsiCo, Inc.: Finanzanalyse Tabelle 78: Vitaco Health (NZ) Ltd.: Angebote Tabelle 79: Welch's: Angebote Tabelle 80: Weitere bedeutende Marktteilnehmer
Abbildung 1: Zusammenfassung: Marktgröße und Prognose für Kindergetränke in den USA, 2020–2033 (Mrd. US$) Abbildung 2: Branchenausblick: Exportziele für Frucht- und Nusssäfte in die USA, 2023 (Mrd. US$) Abbildung 3: Branchenausblick: Importeure von Frucht- und Nusssäften in die USA, 2023 (Mrd. US$) Abbildung 4: Branchenausblick: Getränkekonsum von Kindern 2017–2020 Abbildung 5: Analyse des Konsumverhaltens: Präferenzen nach Produkttyp Abbildung 6: Analyse des Konsumverhaltens: Präferenzen nach Altersgruppe Abbildung 7: Analyse des Konsumverhaltens: Präferenzen nach Preisklasse Abbildung 8: Analyse des Konsumverhaltens: Präferenzen nach Vertriebskanal Abbildung 9: Analyse des Konsumverhaltens: Präferenzen nach Verpackung Abbildung 10: Treiber: Hohe Adipositasraten bei Jugendlichen in sieben Bundesstaaten, 2022–2023 Abbildung 11: Trends: Durchschnittliche wöchentliche Ausgabenanteile für Milchprodukte, 2022 Abbildung 12: Auswirkungen von COVID-19 und Erholung: Kindergetränkemarkt in den USA Markt, Auswirkungen von Covid-19 & Erholung, 2020–2033 (jährlich in %) Abbildung 13 Wettbewerbsübersicht: Marktanteilsanalyse nach Unternehmen, basierend auf dem Umsatz (2024) Abbildung 14 US-amerikanischer Markt für Kindergetränke nach Produkttyp, CAGR (%), 2024–2033 Abbildung 15 US-amerikanischer Marktanteil für Kindergetränke nach Produkttyp, 2024 Abbildung 16 US-amerikanischer Marktanteil für Kindergetränke nach Produkttyp, 2033 Abbildung 17 US-amerikanischer Markt für Kindergetränke nach Nährwert, CAGR (%), 2024–2033 Abbildung 18 US-amerikanischer Marktanteil für Kindergetränke nach Nährwert, 2024 Abbildung 19 US-amerikanischer Marktanteil für Kindergetränke nach Nährwert, 2033 Abbildung 20 US-amerikanischer Markt für Kindergetränke nach Altersgruppe, CAGR (%), 2024–2033 Abbildung 21 US-amerikanischer Markt für Kindergetränke Marktanteil (%), nach Altersgruppe, 2024 Abbildung: 22 Marktanteil (%) des US-amerikanischen Kindergetränkemarktes, nach Altersgruppe, 2033 Abbildung: 23 Marktanteil (%) des US-amerikanischen Kindergetränkemarktes, nach Verpackung, CAGR (%), 2024–2033 Abbildung: 24 Marktanteil (%) des US- amerikanischen Kindergetränkemarktes, nach Verpackung, 2024 Abbildung: 25 Marktanteil (%) des US-amerikanischen Kindergetränkemarktes, nach Verpackung, 2033 Abbildung: 26 Markt für Kindergetränkemarkt, nach Preisspanne, CAGR (%), 2024–2033 Abbildung: 27 Marktanteil (%) des US-amerikanischen Kindergetränkemarktes, nach Preisspanne, 2024 Abbildung: 28 Marktanteil (%) des US-amerikanischen Kindergetränkemarktes, nach Preisspanne, 2033 Abbildung: 29 Markt für Kindergetränkemarkt, nach Vertriebskanal, CAGR (%), 2024–2033 Abbildung: 30 Marktanteil (%) des US-amerikanischen Kindergetränkemarktes, nach Vertriebskanal31 Abbildung : Marktanteil von Kindergetränken in den USA (%), nach Vertriebskanal, 2033; Abbildung 32: Markt für Kindergetränke in den USA, nach Region, CAGR (%), 2024–2033; Abbildung 33: Marktanteil von Kindergetränken in den USA (%), nach Region, 2024; Abbildung 34: Marktanteil von Kindergetränken in den USA (%), nach Region, 2033; Abbildung 35: Nordosten der USA: Segment mit dem höchsten Anteil (%); Abbildung 36: Nordosten der USA: Nettopotenzialzuwachs in Mrd. US$ ; Abbildung 37: Nordosten der USA: Wirkungsanalyse – Diagramm ; Abbildung 38: Nordosten der USA: Potenzialanalyse nach Produkttyp ; Abbildung 39: Nordosten der USA: Potenzialanalyse nach Nährwert ; Abbildung 40: Nordosten der USA: Potenzialanalyse nach Altersgruppe ; Abbildung 41: Nordosten der USA: Potenzialanalyse nach Verpackung ; Abbildung43 Nordosten der USA: Chancenanalyse nach Vertriebskanal 42: Nordosten der USA: Potenzialanalyse nach Preissegment Abbildung: 44 Marktanteil (%) von Kindergetränken im Nordosten der USA nach Produkttyp, 2024 Abbildung: 45 Marktanteil (%) von Kindergetränken im Nordosten der USA nach Produkttyp, 2033 Abbildung: 46 Marktanteil (%) von Kindergetränken im Nordosten der USA nach Nährwert, 2024 Abbildung: 47 Marktanteil (%) von Kindergetränken im Nordosten der USA nach Nährwert, 2033 Abbildung: 48 Marktanteil (%) von Kindergetränken im Nordosten der USA nach Altersgruppe, 2024 Abbildung: 49 Marktanteil (%) von Kindergetränken im Nordosten der USA nach Altersgruppe, 2033 Abbildung: 50 Marktanteil (%) von Kindergetränken im Nordosten der USA nach Verpackung, 2024 Abbildung: 51 Marktanteil (%) von Kindergetränken im Nordosten der USA nach Verpackung, 2033 Abbildung: 52 Marktanteil (%) von Kindergetränken im Nordosten der USA nach Preissegment, 2024 Abbildung 53: Marktanteil von Kindergetränken im Nordosten der USA (%), nach Preissegment, 2033; Abbildung 54: Marktanteil von Kindergetränken im Nordosten der USA (%), nach Vertriebskanal, 2024; Abbildung 55: Marktanteil von Kindergetränken im Nordosten der USA (%), nach Vertriebskanal, 2033 ; Abbildung 56: Südwesten der USA: Segment mit dem höchsten Marktanteil (%) ; Abbildung 57: Südwesten der USA: Nettopotenzialzuwachs in Mrd. US-Dollar; Abbildung 58: Südwesten der USA: Wirkungsanalyse – Diagramm ; Abbildung 59: Südwesten der USA: Potenzialanalyse nach Produkttyp ; Abbildung 60: Südwesten der USA: Potenzialanalyse nach Nährwert ; Abbildung 61: Südwesten der USA: Potenzialanalyse nach Altersgruppe ; Abbildung 62: Südwesten der USA: Potenzialanalyse nach Verpackung ; Abbildung 63: Südwesten der USA: Potenzialanalyse nach Preissegment ; Abbildung 64: Südwesten der USA: Potenzialanalyse nach Vertriebskanal ; Abbildung 65: Kindergetränke im Südwesten der USA Marktanteil (%), nach Produkttyp, 2024 Abbildung: 66 Marktanteil (%) für Kindergetränke im Südwesten der USA, nach Produkttyp, 2033 Abbildung: 67 Marktanteil (%) für Kindergetränke im Südwesten der USA, nach Nährwert, 2024 Abbildung: 68 Marktanteil (%) für Kindergetränke im Südwesten der USA, nach Nährwert, 2033 Abbildung: 69 Marktanteil (%) für Kindergetränke im Südwesten der USA, nach Altersgruppe, 2024 Abbildung: 70 Marktanteil (%) für Kindergetränke im Südwesten der USA, nach Altersgruppe, 2033 Abbildung: 71 Marktanteil (%) für Kindergetränke im Südwesten der USA, nach Verpackung, 2024 Abbildung: 72 Marktanteil (%) für Kindergetränke im Südwesten der USA, nach Verpackung, 2033 Abbildung: 73 Marktanteil (%) für Kindergetränke im Südwesten der USA, nach Preissegment, 2024 Abbildung: 74 Marktanteil (%) für Kindergetränke im Südwesten der USA, nach Preissegment, 2033 Abbildung: 75 Marktanteil von Kindergetränken im Südwesten der USA (%), nach Vertriebskanal, 2024 Abbildung: 76 Marktanteil von Kindergetränken im Südwesten der USA (%), nach Vertriebskanal, 2033 Abbildung: 77 Westliche USA: Segment mit dem höchsten Anteil (%) Abbildung: 78 Westliche USA: Netto-Potenzialzuwachs in Mrd. US$ Abbildung: 79 Westliche USA: Wirkungsanalyse – Diagramm Abbildung: 80 Westliche USA: Potenzialanalyse nach Produkttyp Abbildung: 81 Westliche USA: Potenzialanalyse nach Nährwert Abbildung: 82 Westliche USA: Potenzialanalyse nach Altersgruppe Abbildung: 83 Westliche USA: Potenzialanalyse nach Verpackung Abbildung: 84 Westliche USA: Potenzialanalyse nach Preisspanne Abbildung: 85 Westliche USA: Potenzialanalyse nach Vertriebskanal Abbildung: 86 Marktanteil von Kindergetränken im Westen der USA (%), nach Produkttyp, 2024 Abbildung: 87 Marktanteil von Kindergetränken im Westen der USA (%), nach Produkttyp 2033 Abbildung: 88 Marktanteil von Kindergetränken im Westen der USA (%), nach Nährwert, 2024 Abbildung: 89 Marktanteil von Kindergetränken im Westen der USA (%), nach Nährwert, 2033 Abbildung: 90 Marktanteil von Kindergetränken im Westen der USA (%), nach Altersgruppe, 2024 Abbildung: 91 Marktanteil von Kindergetränken im Westen der USA (%), nach Altersgruppe, 2033 Abbildung: 92 Marktanteil von Kindergetränken im Westen der USA (%), nach Verpackung, 2024 Abbildung: 93 Marktanteil von Kindergetränken im Westen der USA (%), nach Verpackung, 2033 Abbildung: 94 Marktanteil von Kindergetränken im Westen der USA (%), nach Preisspanne, 2024 Abbildung: 95 Marktanteil von Kindergetränken im Westen der USA (%), nach Preisspanne, 2033 Abbildung: 96 Marktanteil von Kindergetränken im Westen der USA (%), nach Vertriebskanal, 2024 Abbildung: 97 Marktanteil von Kindergetränken im Westen der USA (%), nach Vertriebskanal 2033 Abbildung: 98 Südosten der USA: Höchster Marktanteil (%) Abbildung : 99 Südosten der USA: Netto-Marktpotenzial in Mrd. US$ Abbildung: 100 Südosten der USA: Wirkungsanalyse – Diagramm Abbildung: 101 Südosten der USA: Marktpotenzialanalyse nach Produkttyp Abbildung: 102 Südosten der USA: Marktpotenzialanalyse nach Nährwertangaben Abbildung: 103 Südosten der USA: Marktpotenzialanalyse nach Altersgruppe Abbildung: 104 Südosten der USA: Marktpotenzialanalyse nach Verpackung Abbildung: 105 Südosten der USA: Marktpotenzialanalyse nach Preisspanne Abbildung: 106 Südosten der USA: Marktpotenzialanalyse nach Vertriebskanal Abbildung: 107 Marktanteil von Kindergetränken im Südosten der USA (%) nach Produkttyp, 2024 Abbildung: 108 Marktanteil von Kindergetränken im Südosten der USA (%) nach Produkttyp, 2033 Abbildung: 109 Marktanteil von Kindergetränken im Südosten der USA (%) nach Nährwertangaben, 2024 Abbildung: 110 Südosten der USA Kinder Marktanteile von Getränken (%), nach Nährwert, 2033 Abbildung: 111 Marktanteile von Kindergetränken im Südosten der USA (%), nach Altersgruppe, 2024 Abbildung: 112 Marktanteile von Kindergetränken im Südosten der USA (%), nach Altersgruppe, 2033 Abbildung: 113 Marktanteile von Kindergetränken im Südosten der USA (%), nach Verpackung, 2024 Abbildung: 114 Marktanteile von Kindergetränken im Südosten der USA (%), nach Verpackung, 2033 Abbildung: 115 Marktanteile von Kindergetränken im Südosten der USA (%), nach Preisspanne, 2024 Abbildung: 116 Marktanteile von Kindergetränken im Südosten der USA (%), nach Preisspanne, 2033 Abbildung: 117 Marktanteile von Kindergetränken im Südosten der USA (%), nach Vertriebskanal, 2024 Abbildung: 118 Marktanteile von Kindergetränken im Südosten der USA (%), nach Vertriebskanal, 2033 Abbildung: 119 Mittlerer Westen der USA: Segment mit dem höchsten Marktanteil (%) Abbildung : 120 Mittlerer Westen USA: Netto-Marktpotenzial (in Mrd. US$) Abbildung: 121 Mittlerer Westen der USA: Wirkungsanalyse – Diagramm Abbildung: 122 Mittlerer Westen der USA: Potenzialanalyse nach Produkttyp Abbildung: 123 Mittlerer Westen der USA: Potenzialanalyse nach Nährwertangaben Abbildung: 124 Mittlerer Westen der USA: Potenzialanalyse nach Altersgruppe Abbildung: 125 Mittlerer Westen der USA: Potenzialanalyse nach Verpackung Abbildung: 126 Mittlerer Westen der USA: Potenzialanalyse nach Preisspanne Abbildung: 127 Mittlerer Westen der USA: Potenzialanalyse nach Vertriebskanal Abbildung: 128 Marktanteil (%) von Kindergetränken im Mittleren Westen der USA nach Produkttyp, 2024 Abbildung: 129 Marktanteil (%) von Kindergetränken im Mittleren Westen der USA nach Produkttyp, 2033 Abbildung: 130 Marktanteil (%) von Kindergetränken im Mittleren Westen der USA nach Nährwertangaben, 2024 Abbildung: 131 Marktanteil (%) von Kindergetränken im Mittleren Westen der USA nach Nährwertangaben132 Abbildung : Marktanteil von Kindergetränken im Mittleren Westen der USA (%), nach Altersgruppe, 2024; Abbildung 133: Marktanteil von Kindergetränken im Mittleren Westen der USA (%), nach Altersgruppe, 2033; Abbildung 134: Marktanteil von Kindergetränken im Mittleren Westen der USA (%), nach Verpackung, 2024 ; Abbildung 135: Marktanteil von Kindergetränken im Mittleren Westen der USA (%), nach Verpackung, 2033; Abbildung 136: Marktanteil von Kindergetränken im Mittleren Westen der USA (%), nach Preisspanne, 2024; Abbildung 137: Marktanteil von Kindergetränken im Mittleren Westen der USA (%), nach Preisspanne, 2033; Abbildung 138: Marktanteil von Kindergetränken im Mittleren Westen der USA (%), nach Vertriebskanal, 2024; Abbildung 139: Marktanteil von Kindergetränken im Mittleren Westen der USA (%), nach Vertriebskanal, 2033; Abbildung 140: Britvic PLC: Umsatzsegmentierung, 2024 ; Abbildung 141 Britvic PLC: Geografische Umsatzsegmentierung, 2024 Abbildung: 142 Campbell Soup Company: Umsatzsegmentierung, 2024 Abbildung: 143 Danone SA: Geografische Umsatzsegmentierung, 2024 Abbildung: 144 Groupe Lactalis: Umsatzsegmentierung, 2023 Abbildung: 145 Groupe Lactalis: Geografische Umsatzsegmentierung, 2023 Abbildung: 146 Kellogg Company: Umsatzsegmentierung, 2024 Abbildung: 147 Kellogg Company: Geografische Umsatzsegmentierung, 2024 Abbildung: 148 Keurig Dr Pepper Inc.: Umsatzsegmentierung, 2024 Abbildung: 149 Keurig Dr Pepper Inc.: Geografische Umsatzsegmentierung, 2024 Abbildung: 150 Kraft Heinz Company: Umsatzsegmentierung, 2024 Abbildung: 151 Kraft Heinz Company: Geografische Umsatzsegmentierung, 2024 Abbildung: 152 Lifeway Foods Inc.: Umsatzsegmentierung nach Geschäftsfeld, 2024 Abbildung: 153 Mondelez International Inc.: Umsatzsegmentierung nach Geschäftsfeld, 2024 Abbildung: 154 Mondelez International Inc.: Umsatzsegmentierung nach geografischem Gebiet, 2024 Abbildung: 155 Nestlé SA: Umsatzsegmentierung nach Geschäftsfeld, 2024 Abbildung: 156 Nestlé SA: Umsatzsegmentierung nach geografischem Gebiet, 2024 Abbildung: 157 PepsiCo, Inc.: Umsatzsegmentierung nach Geschäftsfeld, 2024 Abbildung: 158 PepsiCo, Inc.: Umsatzsegmentierung nach geografischem Gebiet, 2024


Merkmale | Lizenzart | ||||
Datenbuch | Einzelbenutzer |   Mehrere Benutzer | Unternehmen | ||
| E-Zugang | ✓ | ✓ | ✓ | ✓ | |
Benutzerfreigabe | Nur für 1 Benutzer | Nur für 1 Benutzer | Bis zu 7 Benutzer | Unbegrenzter Benutzerzugriff | |
⨉ | ⨉ | ⨉ | ✓ | ||
Kostenlose Anpassung | Keine kostenlose Anpassung | Bis zu 30 Stunden Arbeit | Bis zu 60 Stunden Arbeit | Bis zu 80 Arbeitsstunden | |
Lieferformat |
| ⨉ | ✓ | ✓ | ✓ |
| ✓ | ⨉ | ✓ | ✓ | |
| ⨉ | ⨉ | ⨉ | ✓ | |
Analystenunterstützung | 2 Monate Analystenunterstützung | 4 Monate Analystenunterstützung | 7 Monate Analystenunterstützung | Ein Jahr Analystenbetreuung | |
Kostenloses Bericht-Update im nächsten Aktualisierungszyklus | ⨉ | ⨉ | ⨉ | ✓ | |
Kostenloses Branchen-Update (Innerhalb von 180 Tagen) | ⨉ | ⨉ | ⨉ | ✓ | |
Nutzen | Bis zu 10 % Rabatt nach dem Kauf | Bis zu 20 % Rabatt nach dem Kauf | Bis zu 30 % Rabatt nach dem Kauf | Bis zu 40 % Rabatt nach dem Kauf | |