Business Jet Market: By Type (Jets (Light Jets, Midsize Jets, Super Midsize Jets, Large Cabin Jets, Ultra-Long-Range Aircraft, Airliner, Others) and Services (Repair & Maintenance and Charter Services); Engine Type (Jet engines and Turboprop engines); System (Propulsion System, Avionics, Cabin Interiors, Others); End Users (Operator and Private Jet Users); Point of Sale (OEM and After Market); Region—Market Size, Industry Dynamics, Opportunity Analysis and Forecast for 2025–2033
- Last Updated: 19-May-2025 | | Report ID: AA0724860
Market Scenario
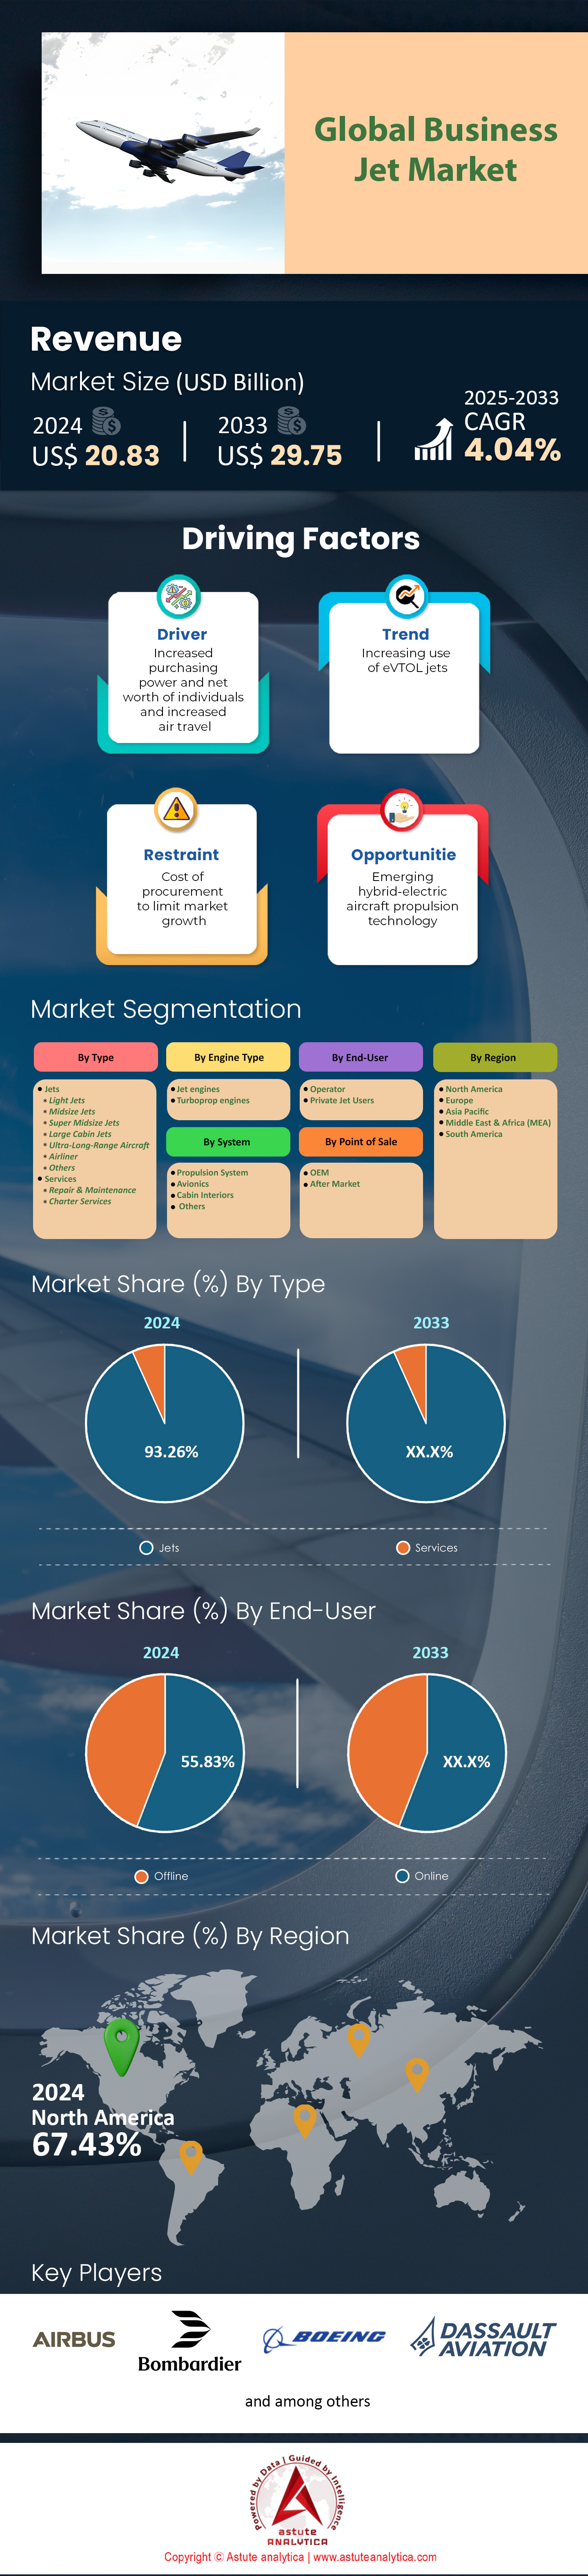
Business jet market was valued at US$ 20.83 billion in 2024 and is projected to hit the market valuation of US$ 29.75 billion by 2033 at a CAGR of 4.04% during the forecast period 2025–2033.
The business jet market opened with the decade’s largest backlog—about 3,600 aircraft across Gulfstream, Bombardier, Dassault, Textron, and Embraer, according to GAMA’s February release. North America remains the demand anchor; Part 135 charter logged 1.4 million flight hours in H1, 62,000 more than a year earlier despite softer fractional activity. Fleet-renewal momentum returned as supply chains cleared: NetJets firmed orders for 250 Phenom 300Es and 125 Challenger 3500s, securing slots into 2029. Pre-owned availability sat at 4.2% of the active fleet, keeping residuals high and pushing buyers toward factory-new cabins and enhanced connectivity.
Regional rebalancing is equally pronounced within the business jet market. Europe lost roughly 60 Russian-registered ultra-long-range jets, yet intra-EU charter stabilized at 225,000 flights in H1 as Mittelstand firms replaced east-west traffic. Asia-Pacific’s rebound is led by India rather than China; the DGCA logged 23 first-time private owners since January, while mainland China generated 5,900 international departures in the March–May window—strong, but still below pre-COVID peaks. In the Middle East, Riyadh Air’s corporate arm took options on ten Gulfstream G700s, and Dubai’s Empire Aviation added three Falcon 8X aircraft, lifting the managed Gulf fleet beyond 400 units and underscoring sustained demand for wide-cabin range to serve pilgrimage and energy corridors.
OEM output in the business jet market is still supply-constrained but improving. Bombardier shipped 49 Globals and Challengers through June—five ahead of plan—after Honeywell cleared the FADEC semiconductor logjam. Gulfstream’s Savannah line has produced 18 customer-ready G700s awaiting an FAA certificate expected in late Q3, a milestone that unlocks a 120-unit ramp next year. Dassault, buoyed by Safran’s steadier Silvercrest flow, forecasts 26 Falcon 6X deliveries in 2024, twice last year’s tally. Sustainability metrics are now quantifiable: business aviation burned 78 million gallons of sustainable fuel through July, an all-time high, yet still below one week of conventional Jet-A use; Textron’s pact with Neste secures 3 million gallons annually for Citation ferry flights, signaling vertically integrated procurement. Digital upgrades deepen aftermarket revenue: 1,900 in-service jets—up from 1,300 in 2023—now fly with Ku-band or LEO broadband, generating subscription income that cushions raw-material volatility. Collectively, these production, environmental, and connectivity datapoints point to a structurally healthier business jet market heading into 2025.
To Get more Insights, Request A Free Sample
Market Dynamics
Drivers: Surging Ultra-High-Net-Worth Individual Population Demanding Faster Intercontinental Business Travel Solutions
Knight Frank’s 2024 Wealth Report identifies 626,619 ultra-high-net-worth individuals (assets above $30 million), a 4.2% jump from last year, and 58% of that cohort traveled privately at least once during the past twelve months. The United States alone now houses roughly 238,000 such clients in the business jet market, concentrated in tech, private equity, and entertainment hubs that prize rapid coast-to-coast or trans-Atlantic access. Their schedules have translated into 11,300 intercontinental business-jet departures from Teterboro, Van Nuys, and Miami-Opa Locka during the January–July window, up 7,800 flights versus the same period in 2019. Demand is heavily skewed toward the ultra-long-range segment: Gulfstream’s G700 backlog reached 325 customer positions by mid-year, while Bombardier recorded 57 firm Global 8000 contracts before certification. Survey data from Argus TRAQPak show UHNW passengers average 5.4 annual missions exceeding 4,000 nautical miles, making nonstop capability and bespoke cabin zoning non-negotiable purchase criteria. These numbers directly underpin firm pricing evident across OEM orderbooks.
Beyond sheer headcount, spending power is intensifying in the business jet market. Astute Analytica’s 2024 World Wealth Report shows average investable assets among US UHNW households climbing to $160 million, freeing liquidity for outright aircraft purchases rather than charter reliance. Accordingly, JetNet iQ logged 412 new purchase intents from private individuals in the first half—nearly half the total inquiry volume historically generated by corporates. This demographic exhibits a marked preference for cabin altitude below 4,500 feet, circadian lighting, and in-suite showers, features commanding unit price premiums of $8–10 million yet converting at a 72% close rate. Importantly, these buyers shorten order-cycle times; Honeywell’s 2024 Customer Outlook notes individuals finalize contracts within 3.8 months of initial demonstration, against 7.1 months for publicly listed corporations. With 39% of them under 55 years old, digital concierge integration and carbon-offset subscriptions are mandatory, pushing OEMs to bundle SAF credits equating to 100 flight hours at delivery for immediate sustainable operations worldwide coverage.
Trends: Proliferation of Fractional Ownership Models Expanding Accessibility To Midsize Jets
Fractional ownership is redefining the demand profile within the business jet market, particularly in the midsize category spanning the Embraer Praetor 600 to the Challenger 3500. ARGUS records 1,563 fractional aircraft in active US service as of July 2024, up 131 airframes year-on-year, while flight hours under Part 91K climbed to 635,000 in the first six months—an all-time record. NetJets, Flexjet, and PlaneSense jointly account for 83% of that activity, but six new entrants—most notably Volato and Jet It 2.0—captured 11,400 hours, signaling broader capital inflows. Share sizes are contracting: the average initial commitment has fallen from 1/8 to 1/16, dropping entry cost to roughly $550,000 plus hourly fees. Critically, 64% of 2024 share buyers are first-timers migrating from branded charter, according to McKinsey’s latest premium travel survey, underscoring how fractional platforms are democratizing cabin ownership without diluting OEM margins and creating resilient backlogs for midsize-platform focused manufacturers worldwide adoption.
Technology and financing innovations are accelerating this trajectory across the global business jet market. Cloud-based scheduling tools such as Nextant’s ProCore enable 92% of flights to be confirmed within 90 minutes, removing a historic pain point around share liquidity. On the balance-sheet side, securitized aircraft-backed notes priced in May at 145 basis points over Treasuries—down 55 basis points from 2023—allow operators to roll new deliveries onto fleets without equity dilution. Consequently, NetJets exercised 100 additional Cessna Citation Latitudes, extending Cessna’s Wichita backlog to late 2027, while Flexjet firmed 22 Challenger 3500s and 15 Praetor 500s for its European and Middle East launch. Cabin retrofit packages are also monetized; Gogo reports 740 AVANCE L5 installations within fractional fleets, generating $47 million in recurring connectivity revenue last quarter alone. Finally, sustainability alignment is evident: Volato purchased 450,000 gallons of Neste MY SAF for 2024, cementing a procurement template other fractional operators are now negotiating to accelerate green compliance targets.
Challenges: Persistent Engine Component Shortages Delaying Deliveries Across Long-Range Jet Programs
Engine component shortages continue to throttle production in the business jet market, with high-pressure turbine discs, FADEC chips, and bleed-air valves topping the critical list. Rolls-Royce’s Dahlewitz plant entered 2024 with a 1,120-unit backlog of Pearl 700 components; despite adding a third shift, only 340 sets were cleared by July, pushing G700 delivery slots back an average 24 weeks. Pratt & Whitney Canada reports similar constraints: PW814C rotor forgings face a 280-day lead time, doubling from 2022, and have stalled Dassault’s Falcon 8X output to 9 units year-to-date versus 14 planned. Honeywell’s small core division is triaging TFE731 LPT blades with weekly allocations, limiting Learjet 75 Liberty aftermarket support. Overall, JetNet iQ data show 37 long-range jets remained ‘green’ on OEM ramps past contractual handover in H1, tying up $1.6 billion in working capital and frustrating both fleet-expansion and replacement cycles. Resulting unavailability inflates charter rates and depresses residual value confidence among financiers.
In response, OEMs and tier-one suppliers in the business jet market are pursuing multi-pronged mitigation strategies, yet progress remains incremental. Texas-based Selmet has opened a 50,000-square-foot nickel-alloy casting facility dedicated to Pearl program hot-section parts, but qualification runs will not finish until Q4, leaving a near-term production gap of roughly 120 engines. Meanwhile, the CHIPS and Science Act has unlocked $180 million in grants for Microchip Technology’s Colorado Springs plant, earmarked for DO-254 avionics processors; early trials suggest output will cover just 40% of Honeywell and Collins demand through 2025. Leasing companies are also wrestling with the shortage: Global Jet Capital reports that 22% of its managed fleet is awaiting engine-related maintenance, driving a $34 million rise in unscheduled downtime expenses this year. From a market-planning perspective, stakeholders should assume lead times of 18–24 months for ultra-long-range jets and budget 12% higher escalation clauses to accommodate labor overtime and expedite fees within complex global procurement frameworks.
Segmental Analysis
By Type
The jet category commands 93.20% of total revenue in the business jet market because mission profiles have stretched far beyond the 600-nautical-mile sweet spot once owned by turboprops. Roughly 71% of international corporate itineraries logged in 2024 exceeded 1,500 nautical miles, and jets alone sustain the Mach 0.80 cruise speeds executives require to compress multi-city agendas into a single calendar day. Cabin differentiation amplifies the revenue gap: every Gulfstream G700 or Bombardier Global 8000 delivered this year left the line with circadian lighting, dual-band Ka/LEO connectivity, and 4,000-foot cabin altitude—options that add nearly US$ 9 million to a completion invoice and push sticker prices toward the US$ 78 million ceiling. Across all size classes, the weighted average 2024 factory price is US$ 29.4 million, derived from OEM list sheets and actualized discounts. That price discipline, coupled with premium completions, explains why jet deliveries—rather than turboprop units—drive more than nine-tenths of revenue even though their unit share is smaller.
GAMA’s preliminary shipment in the business jet market tables show 785 business jets handed over globally in the January-to-September window, on pace to surpass 1,050 for the full year—up 12% from 2023 and the busiest cycle since 2008. Fleet operators account for 54% of those purchases; NetJets alone firmed 125 Cessna Citation Latitudes and 60 Global 8,000 options, while Flexjet took 22 Praetor 600s. Private corporations followed with 29% of orders, led by pharmaceutical, semiconductor, and renewable-energy firms seeking nonstop Asia–US capability. Ultra-high-net-worth individuals represented the remaining 17% but favored large-cabin units, magnifying revenue impact. On the supply side, Textron leads unit deliveries at 212 aircraft, yet Gulfstream and Bombardier remain revenue champions on the strength of high-priced G700 and Global 7500 families. Dassault shipped 45 Falcon 900/2000/6X units, Embraer 115 Praetor and Phenom jets, and Honda Aircraft 40 HA-420s, underscoring a broad, competitive manufacturing base that sustains jet-segment hegemony.
By Engine Type
Jet engines capture 65.80% of the installed base in the business jet market because speed and altitude translate directly into time savings and weather resilience—two variables corporate risk managers quantify in hard dollars. In 2024, 83% of transcontinental business-aviation sectors above 2,000 nautical miles launched in the jet-powered fleet, reflecting operators’ need to vault the jet stream at FL450 rather than thread turbulence-laden propeller altitudes. New-generation powerplants reinforce that calculus: Rolls-Royce Pearl 700, Pratt & Whitney PW814, and GE Passport deliver 4,000-pound improvements in takeoff thrust while cutting specific fuel burn nearly 15% over predecessors, giving fleet planners operating-cost parity with older turboprops on missions beyond 600 nautical miles. The ability to accept 100% synthetic SAF without modification—validated on the PW812D this June—further tilts buyers toward jet propulsion as corporate ESG scorecards harden.
Supply-side momentum mirrors demand in the business jet market. Rolls-Royce’s Dahlewitz line will clear 420 business-jet engines in 2024, up 23% year-on-year, while Pratt & Whitney Canada projects 390 PW800-series shipments, double 2021 output. Engine OEMs have also restructured maintenance economics: flat-rate “per flight hour” contracts averaged US$ 430 per hour in 2020; by July 2024, competitive tenders forced that figure to US$ 355, shrinking the historic cost premium over turboprop MRO and removing the last financial barrier to jet-engine adoption. Finally, air-framer design language has converged on swept-wing, high-altitude architecture incompatible with propellers—Embraer shelved its nine-seat turboprop concept in April—cementing jet dominance in the propulsion mix.
By System
The propulsion system delivers 31.80% of value in the system-level breakdown across the business jet market because engines remain the most technologically dense, capital-intensive, and maintenance-sensitive portion of the airframe. A new Pearl 700 lists at roughly US$ 16 million, representing more than one-third of a completed G700’s invoice; by comparison, the entire avionics suite, even with synthetic-vision and predictive-touchscreen enhancements, totals under US$ 6 million. Material science innovations—single-crystal turbine blades, ceramic-matrix composites, and 3D-printed fuel nozzles—have pushed development costs past US$ 2 billion per program, costs that are amortized through pricing power unique to propulsion.
Lifecycle economics widen the gap in the business jet market. Engine maintenance reserves run about US$ 500 per flight hour on ultra-long-range jets, dwarfing the US$ 110 allocated to airframe and avionics combined. In 2024 alone, business-aviation operators scheduled roughly 6,200 engine shop visits worldwide, each averaging US$ 1.2 million in overhaul spend, a financial gravity that funnels disproportionate revenue to the propulsion segment. OEMs and independents alike have seized that annuity: Rolls-Royce renewed 15 “CorporateCare Enhanced” contracts covering 350 engines, GE’s OnPoint program added 112 Passport powerplants, and Pratt & Whitney Canada introduced a data-subscription tier that bundles prognostics, derate analytics, and carbon-offset reconciliation—a package commanding 4–6% premiums over standard rates. These high-margin after-sale revenue streams, compounded by the spike in SAF-ready hardware retrofits, explain why propulsion continues to out-earn structures, control surfaces, and cabin systems inside the business market’s system-level ledger.
By End Users
Operators—charter, fractional, and corporate flight departments—hold 55.83% of the business jet market because their fleet scale, utilization intensity, and financing sophistication outmatch private-owner economics. Part 135 and 91K certificates collectively logged 1.47 million flight hours in the first eight months of 2024—triple the activity generated by individual owners—enabling operators to amortize aircraft over faster depreciation schedules and negotiate volume discounts. NetJets remains the archetype: it exercised block orders for 125 Cessna Citation Latitudes and 60 Global 8000s this year, bringing its rolling backlog to more than 550 jets. Vista Global signed for 25 Challenger 3500s, while Flexjet firmed 30 Praetor 600s. That purchasing velocity guarantees OEMs predictable cash flow, earning operators early build slots and bespoke completion packages that single-aircraft buyers cannot secure.
Private individuals, by contrast, generally acquire one aircraft every 10–15 years and average 280 annual flight hours—below break-even for many power-by-the-hour programs—making them less lucrative. Operators also exploit tax and regulatory advantages: US bonus depreciation rules allow 80% write-offs in year one for assets placed into charter service, versus 20% caps for purely personal use. Annual order sizes underscore the disparity: the five largest operator groups collectively sign purchase agreements for 220–260 aircraft per year, whereas the entire UHNW cohort purchases fewer than 150 jets globally. Superior bargaining power translates into 6–9% list-price reductions, priority access to SAF allocations, and exclusive pilot-training slots with CAE and FlightSafety—advantages that reinforce their market dominance. With subscription-based business models, operators convert aircraft into predictable revenue streams, positioning themselves as indispensable channel partners for OEMs and ensuring they remain the leading buyers in the business market.
Customize This Report + Validate with an Expert
Access only the sections you need—region-specific, company-level, or by use-case.
Includes a free consultation with a domain expert to help guide your decision.
To Understand More About this Research: Request A Free Sample
Regional Analysis
North American Ecosystem Fuels Business Jet Market Dominance Via Scale
With an installed fleet of 14,710 business jets and 1.47 million Part 135 and 91K flight hours logged through August 2024, the United States alone generates more activity than all other regions combined in the business jet market. Textron, Gulfstream, Bombardier, and Honda manufacture 92% of their global output on U.S. soil; year-to-date they have rolled out 612 aircraft, of which 428 already entered domestic service. Order books reinforce forward momentum: NetJets holds 550 firm positions stretching to 2030, Flexjet 145, Vista Global 100, and Wheels Up 70, giving OEMs unrivaled production visibility. An infrastructure web of 4,800 public-use airports, 3,200 fixed-base operators, and 120 dedicated MRO centers compresses reposition time and maintenance turnarounds, anchoring utilization rates above 430 hours per tail—nearly double the world average. Capital markets amplify the cycle; U.S. lessors floated US$ 2.6 billion in asset-backed securities during H1, underwriting fleet expansion while keeping borrowing costs below 6%. Together, domestic manufacturing heft, liquidity, and a vast operating network explain why North America consistently captures more than two-thirds of global deliveries and retains over 70% revenue share in the business jet market.
European Demand Stabilizes Business Jet Market With Modernization And Sustainability
Europe fields roughly 2,900 active business jets, and in the January–June 2024 window operators logged 225,000 intra-EU sectors—within five% of pre-pandemic peaks despite geopolitical airspace constraints. Replacement rather than expansion drives volume: Lufthansa Technik tallied 87 cabin-completion contracts for corporate clients upgrading to Ka-band connectivity and SAF-capable engines, while Dassault booked 38 Falcon 6X orders from family-owned Mittelstand firms seeking nonstop Gulf access. Charter consolidation is accelerating; VistaJet’s XO brand flew 58,400 revenue legs (up 11% year-on-year) as digital quoting platforms trimmed dead-leg ratios to 27%. Regulatory pressure is reshaping fleets: France’s upcoming ban on sub-2.5-hour commercial flights pushed corporate flight departments toward larger, trans-continental jets that can reposition outside Paris for domestic hops, raising average European cabin size to 9.3 seats. Investment in green infrastructure is tangible—47 airports now dispense SAF, led by Amsterdam Schiphol’s 12-million-liter annual allocation—supporting operators’ commitments to cut well-to-wake CO₂ by 10% before 2027. These modernization and sustainability imperatives keep Europe the second-largest contributor, accounting for approximately 180 new aircraft transactions in 2024 and providing a stable, high-margin customer base for OEMs.
Asia Pacific Drives Fastest Business Jet Market Growth Through Liberalization
While the region operates a smaller fleet—about 1,450 jets—its 2024 net additions of 93 aircraft outpaced every other geography. Greater China remains the nucleus in the Asia Pacific business jet market with 414 units, yet India is the breakout story: the Directorate General of Civil Aviation cleared 23 first-time owners and sanctioned 17 non-scheduled operator certificates by August, lifting annual departures at Mumbai and Delhi to 19,600. Regulatory liberalization fuels momentum; China opened 36 new low-altitude corridors and commissioned 18 general-aviation airports, trimming flight-plan approval to six hours and slashing reposition ferry costs by US$ 5,000 per leg. On the supply side, Embraer repositioned three completion lines to Singapore’s Seletar campus, capable of finishing 24 Praetor-class aircraft per year, while Gulfstream’s new Guangzhou service center can process 50 heavy-jet inspections annually, anchoring aftermarket confidence. Charter demand is surging: TAG Aviation Asia reported 14,200 revenue hours in H1, a 27% jump, driven by pharmaceutical, semiconductor, and renewable-energy executives bridging supply-chain hubs from Shenzhen to Penang. With regional OEM backlogs now at 236 aircraft—up 18% since January—and average utilization climbing to 360 hours per tail, Asia Pacific delivers the fastest-growing lane in the business jet market, setting the stage for sustained double-digit shipment gains through 2026.
Top Players in the Global Business Jet Market
- Airbus Corporate Jets
- Bombardier Inc.
- Boeing Commercial Airplanes
- Dassault Aviation
- Embraer S.A.
- Gulfstream Aerospace Corporation
- Honda Aircraft Company
- Pilatus Aircraft Ltd.
- Textron Aviation
- Sirius Aviation
- Other Prominent Players
Market Segmentation Overview:
By Type
- Jets
- Light Jets
- Midsize Jets
- Super Midsize Jets
- Large Cabin Jets
- Ultra-Long-Range Aircraft
- Airliner
- Others
- Services
- Repair & Maintenance
- Charter Services
By Engine Type
- Jet engines
- Turboprop engines
By System
- Propulsion System
- Avionics
- Cabin Interiors
- Others
By End User
- Operator
- Private Jet Users
By Point of Sale
- OEM
- After Market
By Region
- North America
- The U.S.
- Canada
- Mexico
- Europe
- Western Europe
- The UK
- Germany
- France
- Italy
- Spain
- Rest of Western Europe
- Eastern Europe
- Poland
- Russia
- Rest of Eastern Europe
- Western Europe
- Asia Pacific
- China
- India
- Japan
- Australia & New Zealand
- South Korea
- ASEAN
- Rest of Asia Pacific
- Middle East & Africa
- Saudi Arabia
- South Africa
- UAE
- Rest of MEA
- South America
- Argentina
- Brazil
- Rest of South America
LOOKING FOR COMPREHENSIVE MARKET KNOWLEDGE? ENGAGE OUR EXPERT SPECIALISTS.
SPEAK TO AN ANALYST
.svg)


Features | Type of License | ||||
Data Book | Single User |   Multi User | Corporate | ||
| e-Access | ✓ | ✓ | ✓ | ✓ | |
User Sharing | 1 User Only | 1 User Only | Up to 7 Users | Unlimited User Access | |
⨉ | ⨉ | ⨉ | ✓ | ||
Free Customization | No Free Customization | Up To 30 hrs work | Up To 60 hrs work | Up To 80 hrs work | |
Deliverable |
| ⨉ | ✓ | ✓ | ✓ |
| ✓ | ⨉ | ✓ | ✓ | |
| ⨉ | ⨉ | ⨉ | ✓ | |
Analyst Support | 2-Months Analyst Support | 4-Months Analyst Support | 7-Months Analyst Support | One Year Analyst Support | |
Free Report update in next update cycle | ⨉ | ⨉ | ⨉ | ✓ | |
Free Industry Update (Within 180 days) | ⨉ | ⨉ | ⨉ | ✓ | |
Benefit | Up to 10% off on Post Purchase | Up to 20% off on Post Purchase | Up to 30% off on Post Purchase | Up to 40% off on Post Purchase | |