Table 1.Electric Vehicle Market Outlook (Mn Units), by Region, 2020-2033
Table 2.Electric Vehicle Market Outlook (Mn Units), by Region, 2031-2050
Table 3.Electric Vehicle Market Outlook (Mn Units), by Vehicle Type, 2020-2033
Table 4.Electric Vehicle Market Outlook (Mn Units), by Vehicle Type, 2031-2050
Table 5.Global Battery as a Service Market Size (US$ Mn), by Product Type, 2020-2033
Table 6.Global Battery as a Service Market Size (US$ Mn), by Service Type, 2020-2033
Table 7.Global Battery as a Service Market Size (US$ Mn), by Vehicle Type, 2020-2033
Table 8.North America Battery as a Service Market Size (US$ Mn), by Product Type, 2020-2033
Table 9.North America Battery as a Service Market Size (US$ Mn), by Service Type, 2020-2033
Table 10.North America Battery as a Service Market Size (US$ Mn), by Vehicle Type, 2020-2033
Table 11.North America Battery as a Service Market Size (US$ Mn), by Country, 2020-2033
Table 12.Europe Battery as a Service Market Size (US$ Mn), by Product Type, 2020-2033
Table 13.Europe Battery as a Service Market Size (US$ Mn), by Service Type, 2020-2033
Table 14.Europe Battery as a Service Market Size (US$ Mn), by Vehicle Type, 2020-2033
Table 15.Europe Battery as a Service Market Size (US$ Mn), by Country, 2020-2033
Table 16.Asia Pacific Battery as a Service Market Size (US$ Mn), by Product Type, 2020-2033
Table 17.Asia Pacific Battery as a Service Market Size (US$ Mn), by Service Type, 2020-2033
Table 18.Asia Pacific Battery as a Service Market Size (US$ Mn), by Vehicle Type, 2020-2033
Table 19.Asia Pacific Battery as a Service Market Size (US$ Mn), by Country, 2020-2033
Table 20.Middle East & Africa Battery as a Service Market Size (US$ Mn), by Product Type, 2020-2033
Table 21.Middle East & Africa Battery as a Service Market Size (US$ Mn), by Service Type, 2020-2033
Table 22.Middle East & Africa Battery as a Service Market Size (US$ Mn), by Vehicle Type, 2020-2033
Table 23.Middle East & Africa Battery as a Service Market Size (US$ Mn), by Country, 2020-2033
Table 24.South America Battery as a Service Market Size (US$ Mn), by Product Type, 2020-2033
Table 25.South America Battery as a Service Market Size (US$ Mn), by Service Type, 2020-2033
Table 26.South America Battery as a Service Market Size (US$ Mn), by Vehicle Type, 2020-2033
Table 27.South America Battery as a Service Market Size (US$ Mn), by Country, 2020-2033
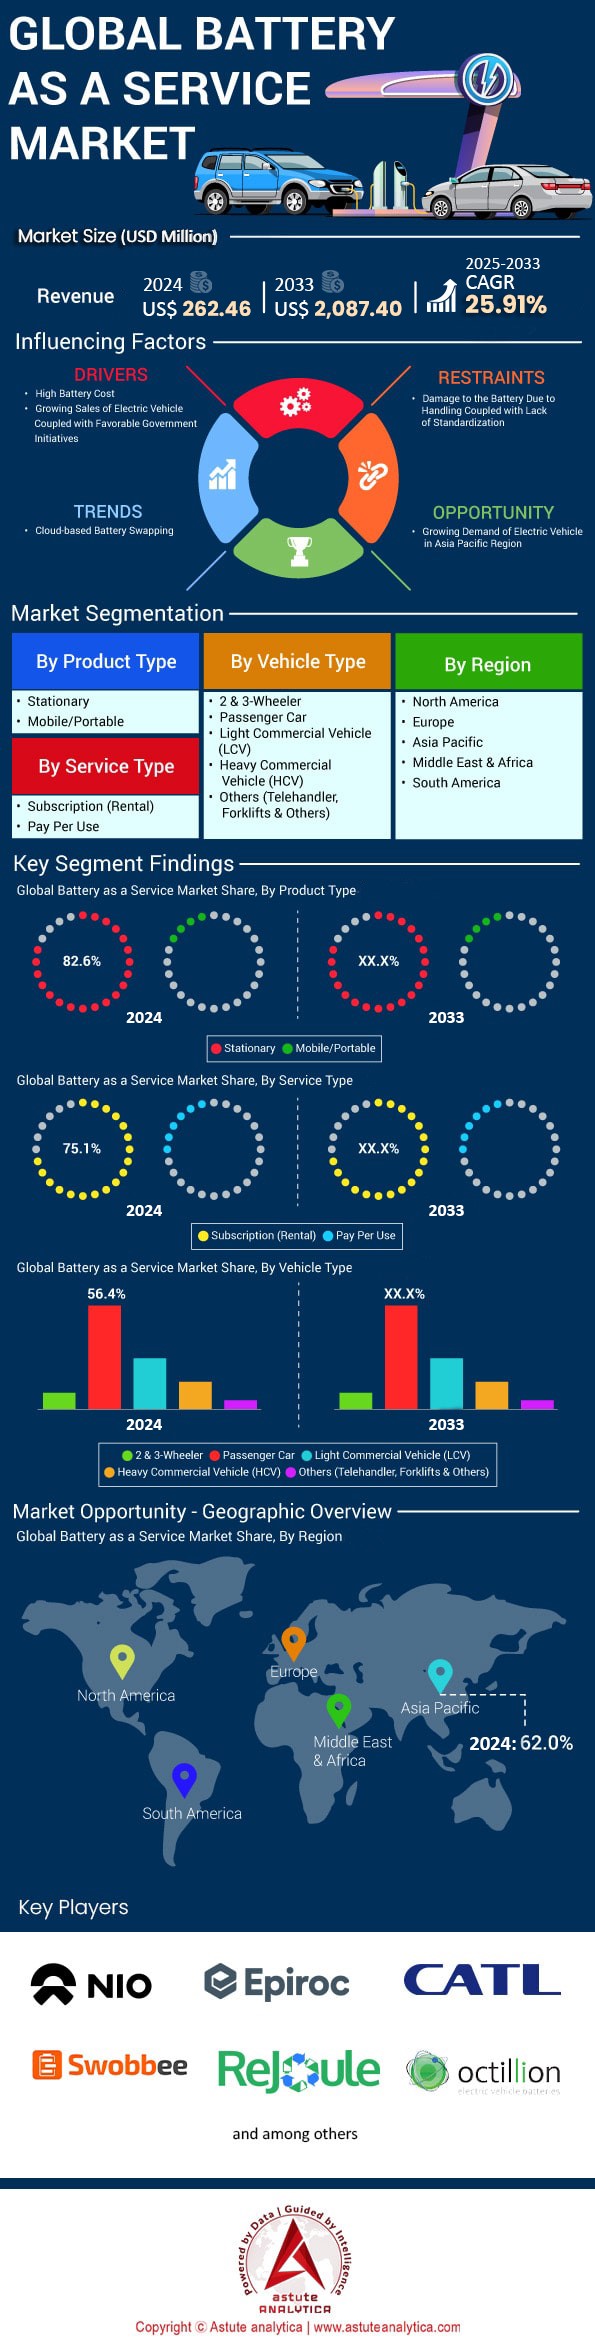
Figure 1:Global Battery as a Service Market Size, By Value, 2020-2033 (US$ Billion)
Figure 2:Global Battery as a Service Market Size, By YoY Growth, 2024-2033 (%)
Figure 3:Market Share Analysis
Figure 4:Global Market Revenue Estimates and Forecast (US$ Mn), 2020-2033
Figure 5:Global Battery-as-a-service Market, By Product Type, CAGR (%), 2024-2033
Figure 6:Global Battery as a Service Market Share (%), by Product Type, 2024
Figure 7:Global Battery as a Service Market Share (%), by Product Type, 2033
Figure 8:Global Battery-as-a-Service Market, By Service Type, CAGR (%), 2024-2033
Figure 9:Global Battery as a Service Market Share (%), by Service Type, 2024
Figure 10:Global Battery as a Service Market Share (%), by Service Type, 2033
Figure 11:Global Battery-as-a-Service Market, By Vehicle Type, CAGR (%), 2024-2033
Figure 12:Global Battery as a Service Market Share (%), by Vehicle Type, 2024
Figure 13:Global Battery as a Service Market Share (%), by Vehicle Type, 2033
Figure 14:North America Market Revenue Estimates and Forecast (US$ Mn), 2020-2033
Figure 15:North America Battery as a Service Market Share (%), by Product Type, 2024
Figure 16:North America Battery as a Service Market Share (%), by Product Type, 2033
Figure 17:North America Battery as a Service Market Share (%), by Service Type, 2024
Figure 18:North America Battery as a Service Market Share (%), by Service Type, 2033
Figure 19:North America Battery as a Service Market Share (%), by Vehicle Type, 2024
Figure 20:North America Battery as a Service Market Share (%), by Vehicle Type, 2033
Figure 21:North America Battery as a Service Market Share (%), by Country, 2024
Figure 22:North America Battery as a Service Market Share (%), by Country, 2033
Figure 23:Europe Market Revenue Estimates and Forecast (US$ Mn), 2020-2033
Figure 24:Europe Battery as a Service Market Share (%), by Product Type, 2024
Figure 25:Europe Battery as a Service Market Share (%), by Product Type, 2033
Figure 26:Europe Battery as a Service Market Share (%), by Service Type, 2024
Figure 27:Europe Battery as a Service Market Share (%), by Service Type, 2033
Figure 28:Europe Battery as a Service Market Share (%), by Vehicle Type, 2024
Figure 29:Europe Battery as a Service Market Share (%), by Vehicle Type, 2033
Figure 30:Europe Battery as a Service Market Share (%), by Country, 2024
Figure 31:Europe Battery as a Service Market Share (%), by Country, 2033
Figure 32:Asia Pacific Market Revenue Estimates and Forecast (US$ Mn), 2020-2033
Figure 33:Asia Pacific Battery as a Service Market Share (%), by Product Type, 2024
Figure 34:Asia Pacific Battery as a Service Market Share (%), by Product Type, 2033
Figure 35:Asia Pacific Battery as a Service Market Share (%), by Service Type, 2024
Figure 36:Asia Pacific Battery as a Service Market Share (%), by Service Type, 2033
Figure 37:Asia Pacific Battery as a Service Market Share (%), by Vehicle Type, 2024
Figure 38:Asia Pacific Battery as a Service Market Share (%), by Vehicle Type, 2033
Figure 39:Asia Pacific Battery as a Service Market Share (%), by Country, 2024
Figure 40:Asia Pacific Battery as a Service Market Share (%), by Country, 2033
Figure 41:Middle East & Africa Market Revenue Estimates and Forecast (US$ Mn), 2020-2033
Figure 42:Middle East & Africa Battery as a Service Market Share (%), by Product Type, 2024
Figure 43:Middle East & Africa Battery as a Service Market Share (%), by Product Type, 2033
Figure 44:Middle East & Africa Battery as a Service Market Share (%), by Service Type, 2024
Figure 45:Middle East & Africa Battery as a Service Market Share (%), by Service Type, 2033
Figure 46:Middle East & Africa Battery as a Service Market Share (%), by Vehicle Type, 2024
Figure 47:Middle East & Africa Battery as a Service Market Share (%), by Vehicle Type, 2033
Figure 48:Middle East & Africa Battery as a Service Market Share (%), by Country, 2024
Figure 49:Middle East & Africa Battery as a Service Market Share (%), by Country, 2033
Figure 50:South America Market Revenue Estimates and Forecast (US$ Mn), 2020-2033
Figure 51:South America Battery as a Service Market Share (%), by Product Type, 2024
Figure 52:South America Battery as a Service Market Share (%), by Product Type, 2033
Figure 53:South America Battery as a Service Market Share (%), by Service Type, 2024
Figure 54:South America Battery as a Service Market Share (%), by Service Type, 2033
Figure 55:South America Battery as a Service Market Share (%), by Vehicle Type, 2024
Figure 56:South America Battery as a Service Market Share (%), by Vehicle Type, 2033
Figure 57:South America Battery as a Service Market Share (%), by Country, 2024
Figure 58:South America Battery as a Service Market Share (%), by Country, 2033


Features | Type of License | ||||
Data Book | Single User |   Multi User | Corporate | ||
| e-Access | ✓ | ✓ | ✓ | ✓ | |
User Sharing | 1 User Only | 1 User Only | Up to 7 Users | Unlimited User Access | |
⨉ | ⨉ | ⨉ | ✓ | ||
Free Customization | No Free Customization | Up To 30 hrs work | Up To 60 hrs work | Up To 80 hrs work | |
Deliverable |
| ⨉ | ✓ | ✓ | ✓ |
| ✓ | ⨉ | ✓ | ✓ | |
| ⨉ | ⨉ | ⨉ | ✓ | |
Analyst Support | 2-Months Analyst Support | 4-Months Analyst Support | 7-Months Analyst Support | One Year Analyst Support | |
Free Report update in next update cycle | ⨉ | ⨉ | ⨉ | ✓ | |
Free Industry Update (Within 180 days) | ⨉ | ⨉ | ⨉ | ✓ | |
Benefit | Up to 10% off on Post Purchase | Up to 20% off on Post Purchase | Up to 30% off on Post Purchase | Up to 40% off on Post Purchase | |