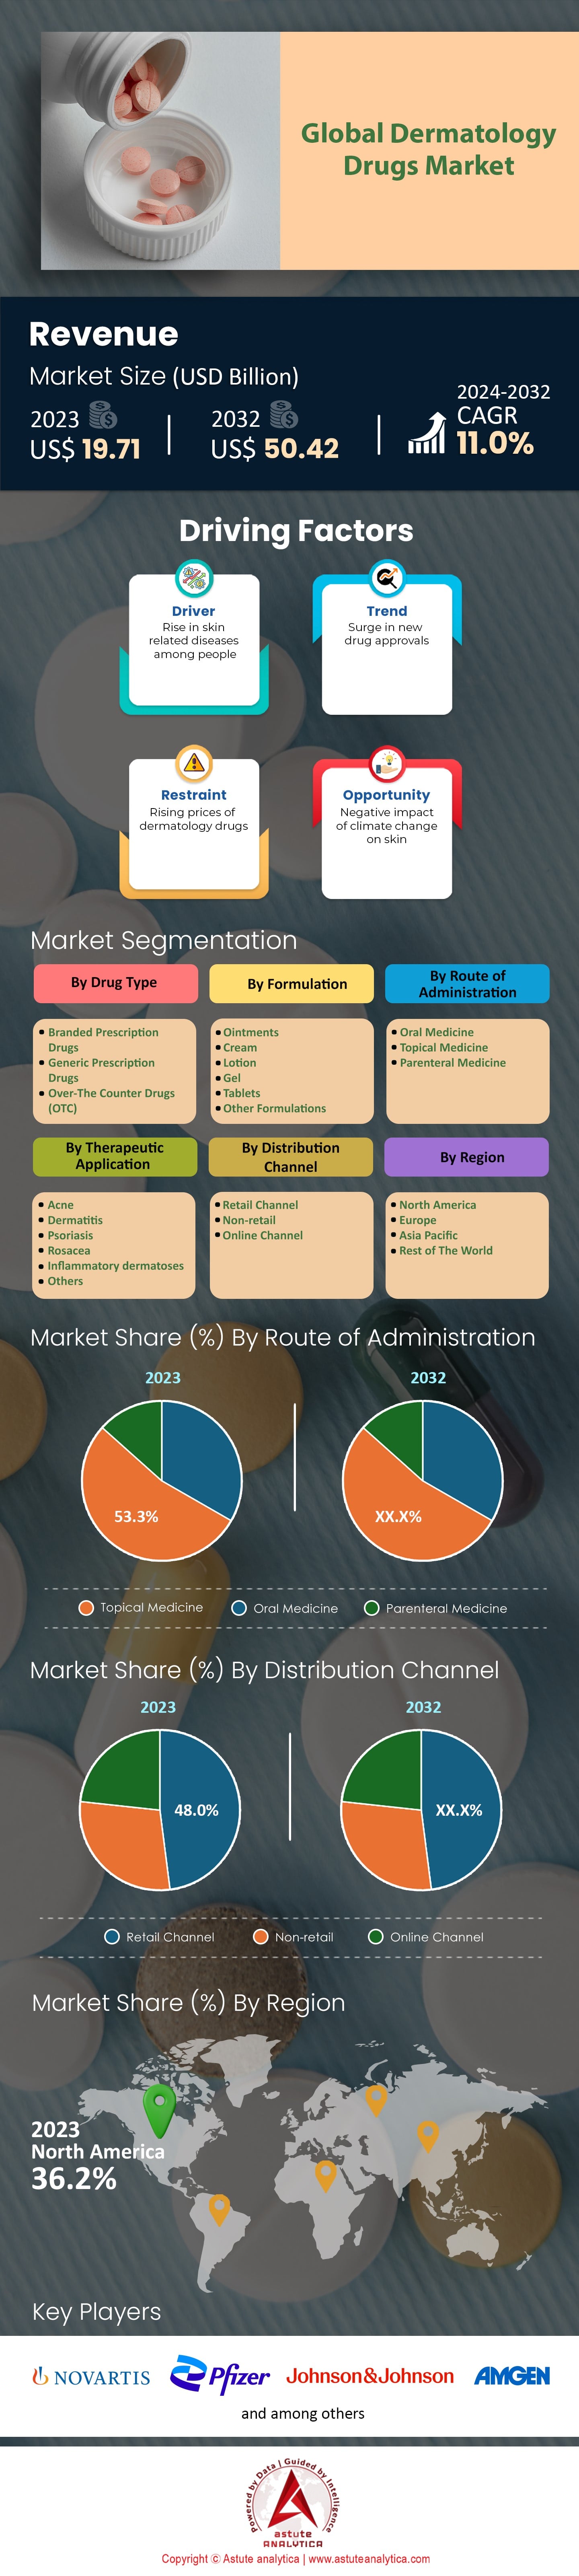
Global Dermatology Drugs Market: By Drug Type (Branded Prescription Drugs, Generic Prescription Drugs, Over-The Counter Drugs (OTC)); By Formulation (Ointments, Cream, Lotion, Gel, Tablets, Other Formulations); By Rout of Administration (Oral Medicines, Topical Medicines, Parenteral Medicines); By Therapeutic Application (Acne, Dermatitis, Psoriasis, Rosacea, Inflammatory dermatoses, Others); By Distribution Channel (Retail Channel, Non-retail, Online Channel) ; Region—Market Size, Industry Dynamics, Opportunity Analysis and Forecast for 2024–2032
- Last Updated: 05-Oct-2024 | | Report ID: AA1222333
Table 1:Market Dynamics and Trend: Net Price of Treatment
Table 2:Market Dynamics and Trend: Dermatologists per 100,000 People, 2023
Table 3:Market Dynamics and Trend: Melanoma of skin cases and Psoriasis cases
Table 4:Market Dynamics and Trend: Pfizer Pipeline and Novartis pipeline
Table 5:Competitor Mapping & Benchmarking
Table 6:Global Dermatology Drugs Market Size (US$ Bn), By Drug Type, 2019-2032
Table 7:Global Dermatology Drugs Market Size (MT), By Drug Type, 2019-2032
Table 8:Global Dermatology Drugs Market Size (US$ Bn), By Formulation, 2019-2032
Table 9:Global Dermatology Drugs Market Size (MT), By Formulation, 2019-2032
Table 10:Global Dermatology Drugs Market Size (US$ Bn), By Route of Administration, 2019-2032
Table 11:Global Dermatology Drugs Market Size (MT), By Route of Administration, 2019-2032
Table 12:Global Dermatology Drugs Market Size (US$ Bn), By Therapeutic Application, 2019-2032
Table 13:Global Dermatology Drugs Market Size (MT), By Therapeutic Application, 2019-2032
Table 14:Global Dermatology Drugs Market Size (US$ Bn), By Distribution Channel, 2019-2032
Table 15:Global Dermatology Drugs Market Size (MT), By Distribution Channel, 2019-2032
Table 16:Global Dermatology Drugs Market Size (US$ Bn), By Region, 2019-2032
Table 17:Global Dermatology Drugs Market Size (MT), By Region, 2019-2032
Table 18:North America Dermatology Drugs Market Size (US$ Bn), By Country, 2019-2032
Table 19:North America Dermatology Drugs Market Size (MT), By Country, 2019-2032
Table 20:North America Dermatology Drugs Market Size (US$ Bn), By Drug Type, 2019-2032
Table 21:North America Dermatology Drugs Market Size (MT), By Drug Type, 2019-2032
Table 22:North America Dermatology Drugs Market Size (US$ Bn), By Formulation, 2019-2032
Table 23:North America Dermatology Drugs Market Size (MT), By Formulation, 2019-2032
Table 24:North America Dermatology Drugs Market Size (US$ Bn), By Route of Administration, 2019-2032
Table 25:North America Dermatology Drugs Market Size (MT), By Route of Administration, 2019-2032
Table 26:North America Dermatology Drugs Market Size (US$ Bn), By Therapeutic Application, 2019-2032
Table 27:North America Dermatology Drugs Market Size (MT), By Therapeutic Application, 2019-2032
Table 28:North America Dermatology Drugs Market Size (US$ Bn), By Distribution Channel, 2019-2032
Table 29:North America Dermatology Drugs Market Size (MT), By Distribution Channel, 2019-2032
Table 30:Europe Dermatology Drugs Market Size (US$ Bn), By Country, 2019-2032
Table 31:Europe Dermatology Drugs Market Size (MT), By Country, 2019-2032
Table 32:Europe Dermatology Drugs Market Size (US$ Bn), By Drug Type, 2019-2032
Table 33:Europe Dermatology Drugs Market Size (MT), By Drug Type, 2019-2032
Table 34:Europe Dermatology Drugs Market Size (US$ Bn), By Formulation, 2019-2032
Table 35:Europe Dermatology Drugs Market Size (MT), By Formulation, 2019-2032
Table 36:Europe Dermatology Drugs Market Size (US$ Bn), By Route of Administration, 2019-2032
Table 37:Europe Dermatology Drugs Market Size (MT), By Route of Administration, 2019-2032
Table 38:Europe Dermatology Drugs Market Size (US$ Bn), By Therapeutic Application, 2019-2032
Table 39:Europe Dermatology Drugs Market Size (MT), By Therapeutic Application, 2019-2032
Table 40:Europe Dermatology Drugs Market Size (US$ Bn), By Distribution Channel, 2019-2032
Table 41:Europe Dermatology Drugs Market Size (MT), By Distribution Channel, 2019-2032
Table 42:Asia Pacific Dermatology Drugs Market Size (US$ Bn), By Country, 2019-2032
Table 43:Asia Pacific Dermatology Drugs Market Size (MT), By Country, 2019-2032
Table 44:Asia Pacific Dermatology Drugs Market Size (US$ Bn), By Drug Type, 2019-2032
Table 45:Asia Pacific Dermatology Drugs Market Size (MT), By Drug Type, 2019-2032
Table 46:Asia Pacific Dermatology Drugs Market Size (US$ Bn), By Formulation, 2019-2032
Table 47:Asia Pacific Dermatology Drugs Market Size (MT), By Formulation, 2019-2032
Table 48:Asia Pacific Dermatology Drugs Market Size (US$ Bn), By Route of Administration, 2019-2032
Table 49:Asia Pacific Dermatology Drugs Market Size (MT), By Route of Administration, 2019-2032
Table 50:Asia Pacific Dermatology Drugs Market Size (US$ Bn), By Therapeutic Application, 2019-2032
Table 51:Asia Pacific Dermatology Drugs Market Size (MT), By Therapeutic Application, 2019-2032
Table 52:Asia Pacific Dermatology Drugs Market Size (US$ Bn), By Distribution Channel, 2019-2032
Table 53:Asia Pacific Dermatology Drugs Market Size (MT), By Distribution Channel, 2019-2032
Table 54:Rest of World Dermatology Drugs Market Size (US$ Bn), By Country, 2019-2032
Table 55:Rest of World Dermatology Drugs Market Size (MT), By Country, 2019-2032
Table 56:Rest of World Dermatology Drugs Market Size (US$ Bn), By Drug Type, 2019-2032
Table 57:Rest of World Dermatology Drugs Market Size (MT), By Drug Type, 2019-2032
Table 58:Rest of World Dermatology Drugs Market Size (US$ Bn), By Formulation, 2019-2032
Table 59:Rest of World Dermatology Drugs Market Size (MT), By Formulation, 2019-2032
Table 60:Rest of World Dermatology Drugs Market Size (US$ Bn), By Route of Administration, 2019-2032
Table 61:Rest of World Dermatology Drugs Market Size (MT), By Route of Administration, 2019-2032
Table 62:Rest of World Dermatology Drugs Market Size (US$ Bn), By Therapeutic Application, 2019-2032
Table 63:Rest of World Dermatology Drugs Market Size (MT), By Therapeutic Application, 2019-2032
Table 64:Rest of World Dermatology Drugs Market Size (US$ Bn), By Distribution Channel, 2019-2032
Table 65:Rest of World Dermatology Drugs Market Size (MT), By Distribution Channel, 2019-2032
Table 66:The US Dermatology Drugs Market Size (US$ Bn), By Drug Type, 2019-2032
Table 67:The US Dermatology Drugs Market Size (MT), By Drug Type, 2019-2032
Table 68:The US Dermatology Drugs Market Size (US$ Bn), By Formulation, 2019-2032
Table 69:The US Dermatology Drugs Market Size (MT), By Formulation, 2019-2032
Table 70:The US Dermatology Drugs Market Size (US$ Bn), By Route of Administration, 2019-2032
Table 71:The US Dermatology Drugs Market Size (MT), By Route of Administration, 2019-2032
Table 72:The US Dermatology Drugs Market Size (US$ Bn), By Therapeutic Application, 2019-2032
Table 73:The US Dermatology Drugs Market Size (MT), By Therapeutic Application, 2019-2032
Table 74:The US Dermatology Drugs Market Size (US$ Bn), By Distribution Channel, 2019-2032
Table 75:The US Dermatology Drugs Market Size (MT), By Distribution Channel, 2019-2032
Table 76:Western Europe Dermatology Drugs Market Size (US$ Bn), By Country, 2019-2032
Table 77:Western Europe Dermatology Drugs Market Size (MT), By Country, 2019-2032
Table 78:Western Europe Dermatology Drugs Market Size (US$ Bn), By Drug Type, 2019-2032
Table 79:Western Europe Dermatology Drugs Market Size (MT), By Drug Type, 2019-2032
Table 80:Western Europe Dermatology Drugs Market Size (US$ Bn), By Formulation, 2019-2032
Table 81:Western Europe Dermatology Drugs Market Size (MT), By Formulation, 2019-2032
Table 82:Western Europe Dermatology Drugs Market Size (US$ Bn), By Route of Administration, 2019-2032
Table 83:Western Europe Dermatology Drugs Market Size (MT), By Route of Administration, 2019-2032
Table 84:Western Europe Dermatology Drugs Market Size (US$ Bn), By Therapeutic Application, 2019-2032
Table 85:Western Europe Dermatology Drugs Market Size (MT), By Therapeutic Application, 2019-2032
Table 86:Western Europe Dermatology Drugs Market Size (US$ Bn), By Distribution Channel, 2019-2032
Table 87:Western Europe Dermatology Drugs Market Size (MT), By Distribution Channel, 2019-2032
Table 88:China Dermatology Drugs Market Size (US$ Bn), By Drug Type, 2019-2032
Table 89:China Dermatology Drugs Market Size (MT), By Drug Type, 2019-2032
Table 90:China Dermatology Drugs Market Size (US$ Bn), By Formulation, 2019-2032
Table 91:China Dermatology Drugs Market Size (MT), By Formulation, 2019-2032
Table 92:China Dermatology Drugs Market Size (US$ Bn), By Route of Administration, 2019-2032
Table 93:China Dermatology Drugs Market Size (MT), By Route of Administration, 2019-2032
Table 94:China Dermatology Drugs Market Size (US$ Bn), By Therapeutic Application, 2019-2032
Table 95:China Dermatology Drugs Market Size (MT), By Therapeutic Application, 2019-2032
Table 96:China Dermatology Drugs Market Size (US$ Bn), By Distribution Channel, 2019-2032
Table 97:China Dermatology Drugs Market Size (MT), By Distribution Channel, 2019-2032
Table 98:ASEAN Dermatology Drugs Market Size (US$ Bn), By Country, 2019-2032
Table 99:ASEAN Dermatology Drugs Market Size (US$ Bn), By Country, 2019-2032
Table 100:ASEAN Dermatology Drugs Market Size (US$ Bn), By Drug Type, 2019-2032
Table 101:ASEAN Dermatology Drugs Market Size (MT), By Drug Type, 2019-2032
Table 102:ASEAN Dermatology Drugs Market Size (US$ Bn), By Formulation, 2019-2032
Table 103:ASEAN Dermatology Drugs Market Size (MT), By Formulation, 2019-2032
Table 104:ASEAN Dermatology Drugs Market Size (US$ Bn), By Route of Administration, 2019-2032
Table 105:ASEAN Dermatology Drugs Market Size (MT), By Route of Administration, 2019-2032
Table 106:ASEAN Dermatology Drugs Market Size (US$ Bn), By Therapeutic Application, 2019-2032
Table 107:ASEAN Dermatology Drugs Market Size (MT), By Therapeutic Application, 2019-2032
Table 108:ASEAN Dermatology Drugs Market Size (US$ Bn), By Distribution Channel, 2019-2032
Table 109:ASEAN Dermatology Drugs Market Size (MT), By Distribution Channel, 2019-2032
Figure1:Executive Summary: Global Dermatology Drugs Market, 2019-2032 | Revenue (US$ Bn), Volume (MT)
Figure2:Global Dermatology Drugs Market, Y-o-Y (%), 2019-2032
Figure3:Global Dermatology Drugs Market Size (US$ Bn), Covid-19 Impact & Recovery, 2018-2030
Figure4:Competitive Dashboard: Market Share Analysis, By Company, Based on Revenue (2021)
Figure5:Global Dermatology Drugs Market, By Drug Type, CAGR (%), 2023-2032
Figure6:Global Dermatology Drugs Market Share (%) By Drug Type, 2019-2032
Figure7:Global Dermatology Drugs Market, By Formulation, CAGR (%), 2023-2032
Figure8:Global Dermatology Drugs Market Share (%) By Formulation, 2019-2032
Figure9:Global Dermatology Drugs Market, By Route of Administration, CAGR (%), 2023-2032
Figure10:Global Dermatology Drugs Market Share (%) By Route of Administration, 2019-2032
Figure11:Global Dermatology Drugs Market, By Therapeutic Application, CAGR (%), 2023-2032
Figure12:Global Dermatology Drugs Market Share (%) By Therapeutic Application, 2019-2032
Figure13:Global Dermatology Drugs Market, By Distribution Channel, CAGR (%), 2023-2032
Figure14:Global Dermatology Drugs Market Share (%) By Distribution Channel, 2019-2032
Figure15:Global Dermatology Drugs Market, By Region, CAGR (%), 2023-2032
Figure16:Global Dermatology Drugs Market Share (%) By Region, 2019-2032
Figure17:North America Dermatology Drugs Market, segment growth share, in US$ Bn
Figure18:North America Dermatology Drugs Market Share (%) By Country, 2019-2032
Figure19:North America Dermatology Drugs Market Share (%) By Drug Type, 2019-2032
Figure20:North America Dermatology Drugs Market Share (%) By Formulation, 2019-2032
Figure21:North America Dermatology Drugs Market Share (%) By Route of Administration, 2019-2032
Figure22:North America Dermatology Drugs Market Share (%) By Therapeutic Application, 2019-2032
Figure23:North America Dermatology Drugs Market Share (%) By Distribution Channel, 2019-2032
Figure24:Europe Dermatology Drugs Market, segment growth share, in US$ Bn
Figure25:Europe Dermatology Drugs Market Share (%) By Country, 2019-2032
Figure26:Europe Dermatology Drugs Market Share (%) By Drug Type, 2019-2032
Figure27:Europe Dermatology Drugs Market Share (%) By Formulation, 2019-2032
Figure28:Europe Dermatology Drugs Market Share (%) By Route of Administration, 2019-2032
Figure29:Europe Dermatology Drugs Market Share (%) By Therapeutic Application, 2019-2032
Figure30:Europe Dermatology Drugs Market Share (%) By Distribution Channel, 2019-2032
Figure31:Asia Pacific Dermatology Drugs Market, segment growth share, in US$ Bn
Figure32:Asia Pacific Dermatology Drugs Market Share (%) By Country, 2019-2032
Figure33:Asia Pacific Dermatology Drugs Market Share (%) By Drug Type, 2019-2032
Figure34:Asia Pacific Dermatology Drugs Market Share (%) By Formulation, 2019-2032
Figure35:Asia Pacific Dermatology Drugs Market Share (%) By Route of Administration, 2019-2032
Figure36:Asia Pacific Dermatology Drugs Market Share (%) By Therapeutic Application, 2019-2032
Figure37:Asia Pacific Dermatology Drugs Market Share (%) By Distribution Channel, 2019-2032
Figure38:Rest of World Dermatology Drugs Market, segment growth share, in US$ Bn
Figure39:Rest of World Dermatology Drugs Market Share (%) By Country, 2019-2032
Figure40:Rest of World Dermatology Drugs Market Share (%) By Drug Type, 2019-2032
Figure41:Rest of World Dermatology Drugs Market Share (%) By Formulation, 2019-2032
Figure42:Rest of World Dermatology Drugs Market Share (%) By Route of Administration, 2019-2032
Figure43:Rest of World Dermatology Drugs Market Share (%) By Therapeutic Application, 2019-2032
Figure44:Rest of World Dermatology Drugs Market Share (%) By Distribution Channel, 2019-2032
Figure45:The US Dermatology Drugs Market, segment growth share, in US$ Bn
Figure46:The US Dermatology Drugs Market Share (%) By Drug Type, 2019-2032
Figure47:The US Dermatology Drugs Market Share (%) By Formulation, 2019-2032
Figure48:The US Dermatology Drugs Market Share (%) By Route of Administration, 2019-2032
Figure49:The US Dermatology Drugs Market Share (%) By Therapeutic Application, 2019-2032
Figure50:The US Dermatology Drugs Market Share (%) By Distribution Channel, 2019-2032
Figure51:Western Europe Dermatology Drugs Market, segment growth share, in US$ Bn
Figure52:Western Europe Dermatology Drugs Market Share (%) By Country
Figure53:Western Europe Dermatology Drugs Market Share (%) By Drug Type, 2019-2032
Figure54:Western Europe Dermatology Drugs Market Share (%) By Formulation, 2019-2032
Figure55:Western Europe Dermatology Drugs Market Share (%) By Route of Administration, 2019-2032
Figure56:Western Europe Dermatology Drugs Market Share (%) By Therapeutic Application, 2019-2032
Figure57:Western Europe Dermatology Drugs Market Share (%) By Distribution Channel, 2019-2032
Figure58:China Dermatology Drugs Market, segment growth share, in US$ Bn
Figure59:China Dermatology Drugs Market Share (%) By Drug Type, 2019-2032
Figure60:China Dermatology Drugs Market Share (%) By Formulation, 2019-2032
Figure61:China Dermatology Drugs Market Share (%) By Route of Administration, 2019-2032
Figure62:China Dermatology Drugs Market Share (%) By Therapeutic Application, 2019-2032
Figure63:China Dermatology Drugs Market Share (%) By Distribution Channel, 2019-2032
Figure64:ASEAN Dermatology Drugs Market, segment growth share, in US$ Bn
Figure65:ASEAN Dermatology Drugs Market Share (%) By Country, 2019-2032
Figure66:ASEAN Dermatology Drugs Market Share (%) By Drug Type, 2019-2032
Figure67:ASEAN Dermatology Drugs Market Share (%) By Formulation, 2019-2032
Figure68:ASEAN Dermatology Drugs Market Share (%) By Route of Administration, 2019-2032
Figure69:ASEAN Dermatology Drugs Market Share (%) By Therapeutic Application, 2019-2032
Figure70:ASEAN Dermatology Drugs Market Share (%) By Distribution Channel, 2019-2032


Features | Type of License | ||||
Data Book | Single User |   Multi User | Corporate | ||
| e-Access | ✓ | ✓ | ✓ | ✓ | |
User Sharing | 1 User Only | 1 User Only | Up to 7 Users | Unlimited User Access | |
⨉ | ⨉ | ⨉ | ✓ | ||
Free Customization | No Free Customization | Up To 30 hrs work | Up To 60 hrs work | Up To 80 hrs work | |
Deliverable |
| ⨉ | ✓ | ✓ | ✓ |
| ✓ | ⨉ | ✓ | ✓ | |
| ⨉ | ⨉ | ⨉ | ✓ | |
Analyst Support | 2-Months Analyst Support | 4-Months Analyst Support | 7-Months Analyst Support | One Year Analyst Support | |
Free Report update in next update cycle | ⨉ | ⨉ | ⨉ | ✓ | |
Free Industry Update (Within 180 days) | ⨉ | ⨉ | ⨉ | ✓ | |
Benefit | Up to 10% off on Post Purchase | Up to 20% off on Post Purchase | Up to 30% off on Post Purchase | Up to 40% off on Post Purchase | |