Table:1 PESTLE Impact Analysis: Political Factors
Table:2 PESTLE Impact Analysis: Economic Factors
Table:3 PESTLE Impact Analysis: Social Factors
Table:4 PESTLE Impact Analysis: Technological Factors
Table:5 PESTLE Impact Analysis: Legal Factors
Table:6 PESTLE Impact Analysis: Environmental Factors
Table:7 Market Dynamics And Trends: Impact Analysis of Market Dynamics
Table:8 Japan Smart Building Market Size (US$ Bn), By Component, 2020-2033
Table:9 Japan Smart Building Market Size (US$ Bn), By Solution, 2020-2033
Table:10 Japan Smart Building Market Size (US$ Bn), By Technology, 2020-2033
Table:11 Japan Smart Building Market Size (US$ Bn), By Building Type, 2020-2033
Table:12 ABB Ltd.: Recent Developments
Table:13 ABB Ltd.: Products
Table:14 ABB Ltd. : Financial Analysis
Table:15 Robert Bosch GmbH: Recent Developments
Table:16 Robert Bosch GmbH: Products
Table:17 Robert Bosch GmbH: Financial Analysis
Table:18 Cisco Systems, Inc.: Offerings
Table:19 Cisco Systems, Inc.: Financial Analysis
Table:20 Emerson Electric Co.: Products
Table:21 Emerson Electric Co.: Financial Analysis
Table:22 Hitachi, Ltd.: Recent Developments
Table:23 Hitachi, Ltd.: Products
Table:24 Hitachi, Ltd. : Financial Analysis
Table:25 Honeywell International Inc.: Recent Developments
Table:26 Honeywell International Inc.: Offerings
Table:27 Honeywell International Inc.: Financial Analysis
Table:28 Intel Corporation: Offerings
Table:29 Intel Corporation.: Financial Analysis
Table:30 Johnson Controls: Offerings
Table:31 Johnson Controls.: Financial Analysis
Table:32 LG Electronics: Offerings
Table:33 LG Electronics: Financial Analysis
Table:34 Schneider Electric SE: Offering
Table:35 Schneider Electric SE.: Financial Analysis
Table:36 Siemens AG: Offering
Table:37 Siemens AG. : Financial Analysis
Table:38 Legrand: Product
Table:39 Legrand.: Financial Analysis
Table:40 Telit Cinterion: Product
Table:41 Other Prominent Players
Table:42 Annexure: Secondary Sources
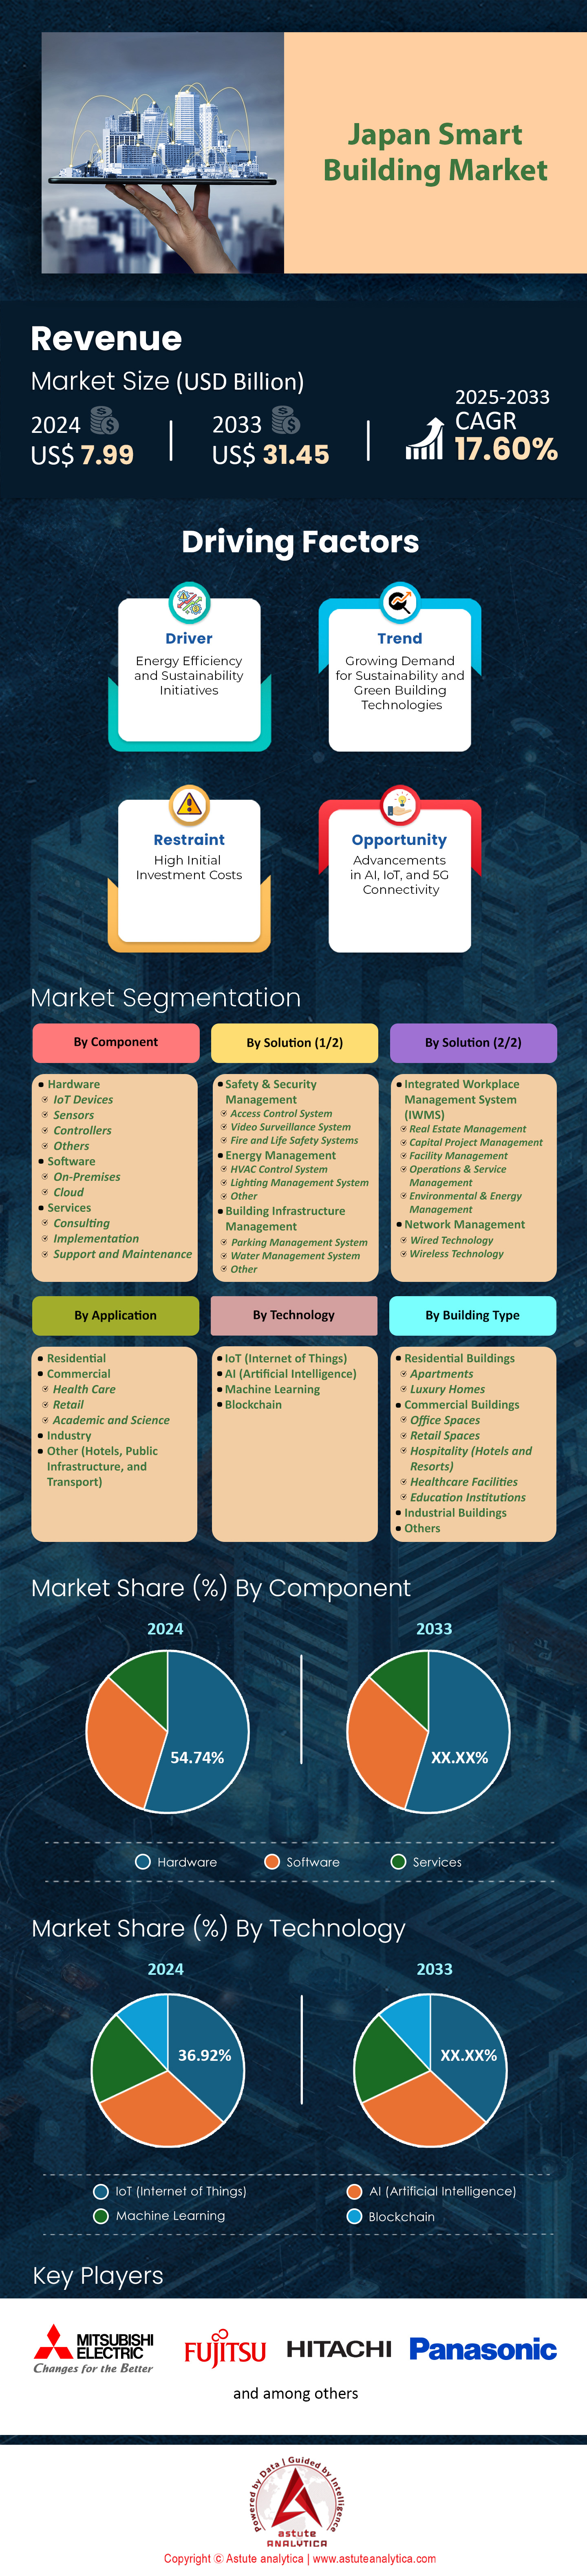
Figure: 1 Executive Summary: Japan Smart Building Market Size and Forecast, 2020-2033 (US$ Bn)
Figure: 2 Industry Outlook: Total final energy consumption (TJ), Japan, 2022
Figure: 3 Industry Outlook: Total Energy Supply Per Unit Of GDP (PPP), Japan
Figure: 4 Driver: Japan Total Energy Consumption – Yearly (In KTOE)
Figure: 5 Driver: Japan Disposable Personal Income – Monthly (In US$ 000’)
Figure: 6 Opportunities: Technology Mix in Japan
Figure: 7 Trend: Green Building Percentages by City, As of March 2024
Figure: 8 Competitive Dashboard: Market Share Analysis by Company, Based on Revenue (2024)
Figure: 9 Japan Smart Building Market, By Component, CAGR (%), 2024-2033
Figure: 10 Japan Smart Building Market Share (%), By Component, 2024
Figure: 11 Japan Smart Building Market Share (%), By Component, 2033
Figure: 12 Japan Smart Building Market, By Solution, CAGR (%), 2024-2033
Figure: 13 Japan Smart Building Market Share (%), By Solution, 2024
Figure: 14 Japan Smart Building Market Share (%), By Solution, 2033
Figure: 15 Japan Smart Building Market, By Technology, CAGR (%), 2024-2033
Figure: 16 Japan Smart Building Market Share (%), By Technology, 2024
Figure: 17 Japan Smart Building Market Share (%), By Technology, 2033
Figure: 18 Japan Smart Building Market, By Building Type, CAGR (%), 2024-2033
Figure: 19 Japan Smart Building Market Share (%), By Building Type, 2024
Figure: 20 Japan Smart Building Market Share (%), By Building Type, 2033
Figure: 21 ABB Ltd.: Business Area Segmentation, 2024
Figure: 22 ABB Ltd.: Geographical Revenue Segmentation, 2024
Figure: 23 Robert Bosch GmbH: Business Revenue Segmentation, 2024
Figure: 24 Robert Bosch GmbH: Geographical Revenue Segmentation, 2024
Figure: 25 Cisco Systems, Inc.: Business Revenue Segmentation, 2024
Figure: 26 Cisco Systems, Inc.: Geographical Revenue Segmentation, 2024
Figure: 27 Emerson Electric Co.: Business Area Segmentation, 2024
Figure: 28 Emerson Electric Co.: Geographical Revenue Segmentation, 2024
Figure: 29 Hitachi, Ltd.: Business Revenue Segmentation, 2024
Figure: 30 Hitachi, Ltd.: Geographical Revenue Segmentation, 2024
Figure: 31 Honeywell International Inc.: Business Revenue Segmentation, 2024
Figure: 32 Honeywell International Inc.: Geographical Revenue Segmentation, 2024
Figure: 33 Intel Corporation: Business Revenue Segmentation, 2024
Figure: 34 Intel Corporation: Geographical Revenue Segmentation, 2024
Figure: 35 Johnson Controls: Business Revenue Segmentation, 2024
Figure: 36 Johnson Controls: Geographical Revenue Segmentation, 2024
Figure: 37 LG Electronics: Business Revenue Segmentation, 2024
Figure: 38 Schneider Electric SE: Business Revenue Segmentation, 2024
Figure: 39 Schneider Electric SE: Geographical Revenue Segmentation, 2024
Figure: 40 Siemens AG: Business Revenue Segmentation, 2024
Figure: 41 Siemens AG: Geographical Revenue Segmentation, 2024
Figure: 42 Legrand: Geographical Revenue Segmentation, 2024
Figure: 43 Annexure: GDP, Current Prices (Billions of U.S. dollars)
Figure: 44 Annexure: GDP Per Capita, Current Prices (U.S. Dollars Per Capita)
Figure: 45 Annexure: Population By Age Group, (In Thousands)
Figure: 46 Annexure: Internet Users, As A Percentage Of Their Age Group
Figure: 47 Annexure: Annual R&D Investment in Science and Technology in Japan (in US$)
Figure: 48 Annexure: R&D Expenditures By Industry, 2021
Figure: 49 Annexure: Trends in Japan's Technology Exports and Imports by Business Enterprises (in US$)
Figure: 50 Annexure: Software spending, % GDP


Features | Type of License | ||||
Data Book | Single User |   Multi User | Corporate | ||
| e-Access | ✓ | ✓ | ✓ | ✓ | |
User Sharing | 1 User Only | 1 User Only | Up to 7 Users | Unlimited User Access | |
⨉ | ⨉ | ⨉ | ✓ | ||
Free Customization | No Free Customization | Up To 30 hrs work | Up To 60 hrs work | Up To 80 hrs work | |
Deliverable |
| ⨉ | ✓ | ✓ | ✓ |
| ✓ | ⨉ | ✓ | ✓ | |
| ⨉ | ⨉ | ⨉ | ✓ | |
Analyst Support | 2-Months Analyst Support | 4-Months Analyst Support | 7-Months Analyst Support | One Year Analyst Support | |
Free Report update in next update cycle | ⨉ | ⨉ | ⨉ | ✓ | |
Free Industry Update (Within 180 days) | ⨉ | ⨉ | ⨉ | ✓ | |
Benefit | Up to 10% off on Post Purchase | Up to 20% off on Post Purchase | Up to 30% off on Post Purchase | Up to 40% off on Post Purchase | |