Table 1.Global Predictive Maintenance Market Size (US$ Bn), By Component, 2020-2033
Table 2.Global Predictive Maintenance Market Size (US$ Bn), By Deployment Mode, 2020-2033
Table 3.Global Predictive Maintenance Market Size (US$ Bn), By Technology, 2020-2033
Table 4.Global Predictive Maintenance Market Size (US$ Bn), By Organization Size, 2020-2033
Table 5.Global Predictive Maintenance Market Size (US$ Bn), By Industry, 2020-2033
Table 6.Global Predictive Maintenance Market Size (US$ Bn), By Region, 2020-2033
Table 7.North America Predictive Maintenance Market Size (US$ Bn), By Country, 2020-2033
Table 8.North America Predictive Maintenance Market Size (US$ Bn), By Component, 2020-2033
Table 9.North America Predictive Maintenance Market Size (US$ Bn), By Deployment Mode, 2020-2033
Table 10.North America Predictive Maintenance Market Size (US$ Bn), By Technology, 2020-2033
Table 11.North America Predictive Maintenance Market Size (US$ Bn), By Organization Size, 2020-2033
Table 12.North America Predictive Maintenance Market Size (US$ Bn), By Industry, 2020-2033
Table 13.Europe Predictive Maintenance Market Size (US$ Bn), By Country, 2020-2033
Table 14.Europe Predictive Maintenance Market Size (US$ Bn), By Component, 2020-2033
Table 15.Europe Predictive Maintenance Market Size (US$ Bn), By Deployment Mode, 2020-2033
Table 16.Europe Predictive Maintenance Market Size (US$ Bn), By Technology, 2020-2033
Table 17.Europe Predictive Maintenance Market Size (US$ Bn), By Organization Size, 2020-2033
Table 18.Europe Predictive Maintenance Market Size (US$ Bn), By Industry, 2020-2033
Table 19.Asia Pacific Predictive Maintenance Market Size (US$ Bn), By Country, 2020-2033
Table 20.Asia Pacific Predictive Maintenance Market Size (US$ Bn), By Component, 2020-2033
Table 21.Asia Pacific Predictive Maintenance Market Size (US$ Bn), By Deployment Mode, 2020-2033
Table 22.Asia Pacific Predictive Maintenance Market Size (US$ Bn), By Technology, 2020-2033
Table 23.Asia Pacific Predictive Maintenance Market Size (US$ Bn), By Organization Size, 2020-2033
Table 24.Asia Pacific Predictive Maintenance Market Size (US$ Bn), By Industry, 2020-2033
Table 25.Middle East & Africa Predictive Maintenance Market Size (US$ Bn), By Country, 2020-2033
Table 26.Middle East & Africa Predictive Maintenance Market Size (US$ Bn), By Component, 2020-2033
Table 27.Middle East & Africa Predictive Maintenance Market Size (US$ Bn), By Deployment Mode, 2020-2033
Table 28.Middle East & Africa Predictive Maintenance Market Size (US$ Bn), By Technology, 2020-2033
Table 29.Middle East & Africa Predictive Maintenance Market Size (US$ Bn), By Organization Size, 2020-2033
Table 30.Middle East & Africa Predictive Maintenance Market Size (US$ Bn), By Industry, 2020-2033
Table 31.South America Predictive Maintenance Market Size (US$ Bn), By Country, 2020-2033
Table 32.South America Predictive Maintenance Market Size (US$ Bn), By Component, 2020-2033
Table 33.South America Predictive Maintenance Market Size (US$ Bn), By Deployment Mode, 2020-2033
Table 34.South America Predictive Maintenance Market Size (US$ Bn), By Technology, 2020-2033
Table 35.South America Predictive Maintenance Market Size (US$ Bn), By Organization Size, 2020-2033
Table 36.South America Predictive Maintenance Market Size (US$ Bn), By Industry, 2020-2033
Table 37.Altair Engineering Inc.: Financial Analysis
Table 38.Google: Financial Analysis
Table 39.General Electric: Financial Analysis
Table 40.Micro Focus: Financial Analysis
Table 41.PTC: Financial Analysis
Table 42.Hitachi: Financial Analysis
Table 43.IBM Corporation: Financial Analysis
Table 44.Microsoft Corporation: Financial Analysis
Table 45.Oracle Corporation: Financial Analysis
Table 46.Schneider Electric: Financial Analysis
Table 47.Siemens AG: Financial Analysis
Table 48.SAP SE: Financial Analysis
Table 49.Software AG: Financial Analysis
Table 50.Splunk: Financial Analysis
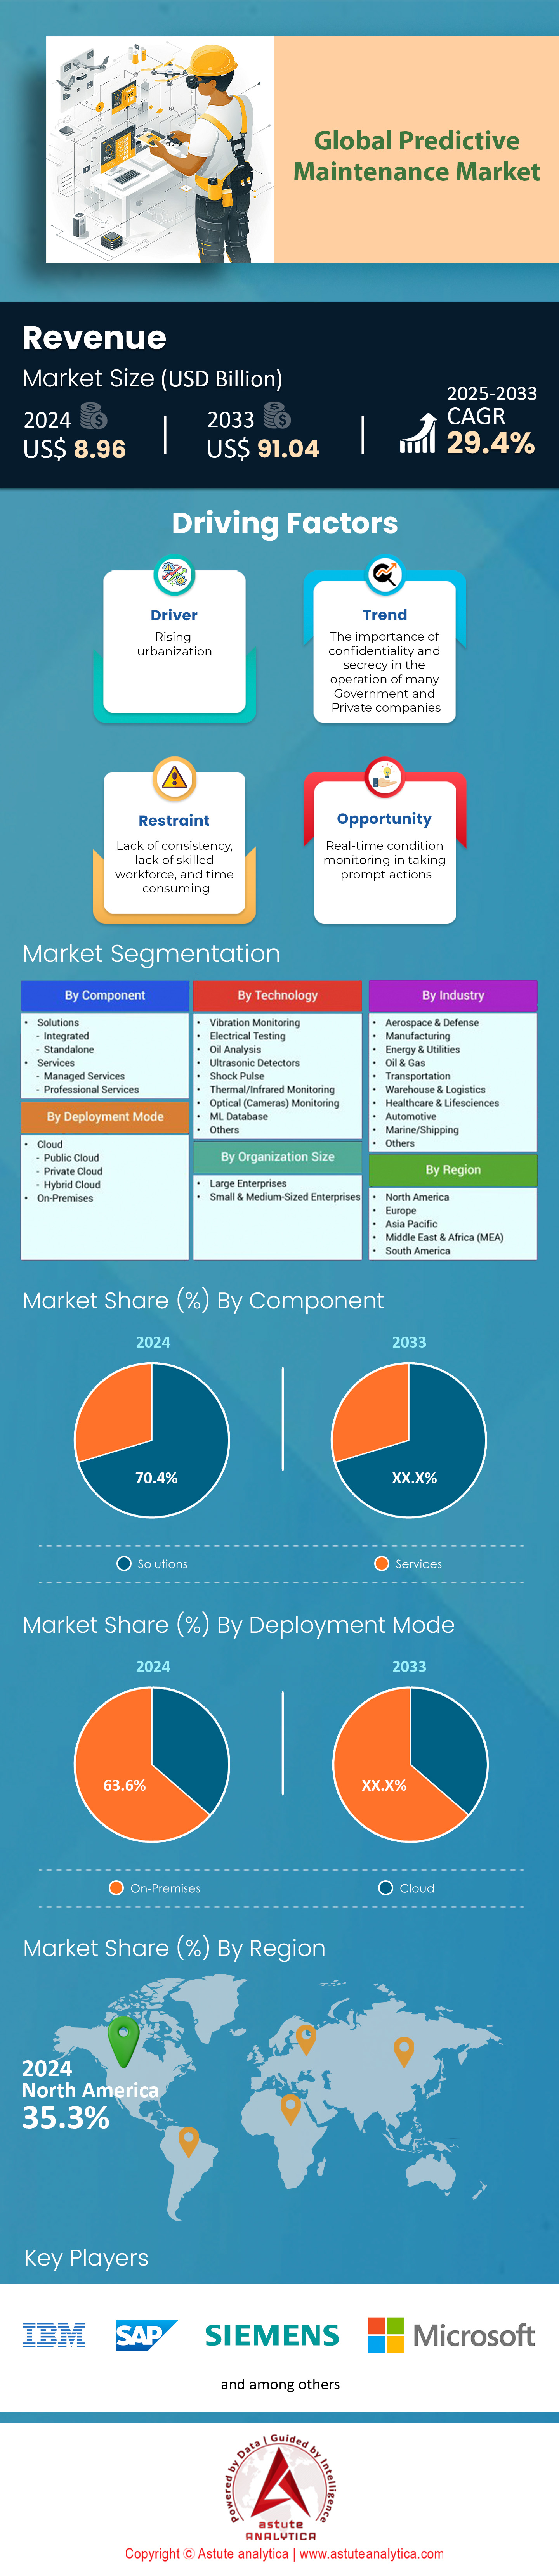
Figure 1:Executive Summary: Global Predictive Maintenance Market, by Revenue (2020-2033), US$ Bn
Figure 2:INDUSTRY OUTLOOK- Preferred Segment, By Deployment Mode
Figure 3:Predictive Maintenance Market, By Revenue (US$ Bn), 2020-2033
Figure 4:Revenue Comparison (In US$ Bn) 2019, 2024 and 2033, By Organization Size
Figure 5:Global Predictive Maintenance Market Size (US$ Bn), Covid-19 Impact & Recovery, 2020-2033
Figure 6:Pricing Analysis, by Subscription Plan (in US$) for various category of plans
Figure 7:Market Share Analysis, By Company, Based on Revenue (2024)
Figure 8:Global Predictive Maintenance Market, By Component, CAGR (%), 2020-2033
Figure 9:Global Predictive Maintenance Market Share (%), By Component, 2024
Figure 10:Global Predictive Maintenance Market Share (%), By Component, 2033
Figure 11:Global Predictive Maintenance Market, By Deployment Mode, CAGR (%), 2020-2033
Figure 12:Global Predictive Maintenance Market Share (%), By Deployment Mode, 2024
Figure 13:Global Predictive Maintenance Market Share (%), By Deployment Mode, 2033
Figure 14:Global Predictive Maintenance Market, By Technology, CAGR (%), 2020-2033
Figure 15:Global Predictive Maintenance Market Share (%), By Technology, 2024
Figure 16:Global Predictive Maintenance Market Share (%), By Technology, 2033
Figure 17:Global Predictive Maintenance Market, By Organization Size, CAGR (%), 2020-2033
Figure 18:Global Predictive Maintenance Market Share (%), By Organization Size, 2024
Figure 19:Global Predictive Maintenance Market Share (%), By Organization Size, 2033
Figure 20:Global Predictive Maintenance Market, By Industry, CAGR (%), 2020-2033
Figure 21:Global Predictive Maintenance Market Share (%), By Industry, 2024
Figure 22:Global Predictive Maintenance Market Share (%), By Industry, 2033
Figure 23:Global Predictive Maintenance Market, By Region, CAGR (%), 2020-2033
Figure 24:Global Predictive Maintenance Market Share (%), By Country, 2024
Figure 25:Global Predictive Maintenance Market Share (%), By Country, 2033
Figure 26:North America Predictive Maintenance Market: Highest CAGR (%) Segment
Figure 27:North America Predictive Maintenance Market: Net Opportunity Addition in US$ Bn
Figure 28:North America Predictive Maintenance Market Share (%), by Country, 2024
Figure 29:North America Predictive Maintenance Market Share (%), by Country, 2033
Figure 30:North America Predictive Maintenance Market Share (%), By Component, 2024
Figure 31:North America Predictive Maintenance Market Share (%), By Component, 2033
Figure 32:North America Predictive Maintenance Market Share (%), By Deployment Mode, 2024
Figure 33:North America Predictive Maintenance Market Share (%), By Deployment Mode, 2033
Figure 34:North America Predictive Maintenance Market Share (%), By Technology, 2024
Figure 35:North America Predictive Maintenance Market Share (%), By Technology, 2033
Figure 36:North America Predictive Maintenance Market Share (%), By Organization Size, 2024
Figure 37:North America Predictive Maintenance Market Share (%), By Organization Size, 2033
Figure 38:North America Predictive Maintenance Market Share (%), By Industry, 2024
Figure 39:North America Predictive Maintenance Market Share (%), By Industry, 2033
Figure 40:Europe Predictive Maintenance Market: Highest CAGR (%) Segment
Figure 41:Europe Predictive Maintenance Market: Net Opportunity Addition in US$ Bn
Figure 42:Europe Predictive Maintenance Market Share (%), by Country, 2024
Figure 43:Europe Predictive Maintenance Market Share (%), by Country, 2033
Figure 44:Europe Predictive Maintenance Market Share (%), By Component, 2024
Figure 45:Europe Predictive Maintenance Market Share (%), By Component, 2033
Figure 46:Europe Predictive Maintenance Market Share (%), By Deployment Mode, 2024
Figure 47:Europe Predictive Maintenance Market Share (%), By Deployment Mode, 2033
Figure 48:Europe Predictive Maintenance Market Share (%), By Technology, 2024
Figure 49:Europe Predictive Maintenance Market Share (%), By Technology, 2033
Figure 50:Europe Predictive Maintenance Market Share (%), By Organization Size, 2024
Figure 51:Europe Predictive Maintenance Market Share (%), By Organization Size, 2033
Figure 52:Europe Predictive Maintenance Market Share (%), By Industry, 2024
Figure 53:Europe Predictive Maintenance Market Share (%), By Industry, 2033
Figure 54:Asia Pacific Predictive Maintenance Market: Highest CAGR (%) Segment
Figure 55:Asia Pacific Predictive Maintenance Market: Net Opportunity Addition in US$ Bn
Figure 56:Asia Pacific Predictive Maintenance Market Share (%), by Country, 2024
Figure 57:Asia Pacific Predictive Maintenance Market Share (%), by Country, 2033
Figure 58:Asia Pacific Predictive Maintenance Market Share (%), By Component, 2024
Figure 59:Asia Pacific Predictive Maintenance Market Share (%), By Component, 2033
Figure 60:Asia Pacific Predictive Maintenance Market Share (%), By Deployment Mode, 2024
Figure 61:Asia Pacific Predictive Maintenance Market Share (%), By Deployment Mode, 2033
Figure 62:Asia Pacific Predictive Maintenance Market Share (%), By Technology, 2024
Figure 63:Asia Pacific Predictive Maintenance Market Share (%), By Technology, 2033
Figure 64:Asia Pacific Predictive Maintenance Market Share (%), By Organization Size, 2024
Figure 65:Asia Pacific Predictive Maintenance Market Share (%), By Organization Size, 2033
Figure 66:Asia Pacific Predictive Maintenance Market Share (%), By Industry, 2024
Figure 67:Asia Pacific Predictive Maintenance Market Share (%), By Industry, 2033
Figure 68:Middle East & Africa Predictive Maintenance Market: Highest CAGR (%) Segment
Figure 69:Middle East & Africa Predictive Maintenance Market: Net Opportunity Addition in US$ Bn
Figure 70:Middle East & Africa Predictive Maintenance Market Share (%), by Country, 2024
Figure 71:Middle East & Africa Predictive Maintenance Market Share (%), by Country, 2033
Figure 72:Middle East & Africa Predictive Maintenance Market Share (%), By Component, 2024
Figure 73:Middle East & Africa Predictive Maintenance Market Share (%), By Component, 2033
Figure 74:Middle East & Africa Predictive Maintenance Market Share (%), By Deployment Mode, 2024
Figure 75:Middle East & Africa Predictive Maintenance Market Share (%), By Deployment Mode, 2033
Figure 76:Middle East & Africa Predictive Maintenance Market Share (%), By Technology, 2024
Figure 77:Middle East & Africa Predictive Maintenance Market Share (%), By Technology, 2033
Figure 78:Middle East & Africa Predictive Maintenance Market Share (%), By Organization Size, 2024
Figure 79:Middle East & Africa Predictive Maintenance Market Share (%), By Organization Size, 2033
Figure 80:Middle East & Africa Predictive Maintenance Market Share (%), By Industry, 2024
Figure 81:Middle East & Africa Predictive Maintenance Market Share (%), By Industry, 2033
Figure 82:South America Predictive Maintenance Market: Highest CAGR (%) Segment
Figure 83:South America Predictive Maintenance Market: Net Opportunity Addition in US$ Bn
Figure 84:South America Predictive Maintenance Market Share (%), by Country, 2024
Figure 85:South America Predictive Maintenance Market Share (%), by Country, 2033
Figure 86:South America Predictive Maintenance Market Share (%), By Component, 2024
Figure 87:South America Predictive Maintenance Market Share (%), By Component, 2033
Figure 88:South America Predictive Maintenance Market Share (%), By Deployment Mode, 2024
Figure 89:South America Predictive Maintenance Market Share (%), By Deployment Mode, 2033
Figure 90:South America Predictive Maintenance Market Share (%), By Technology, 2024
Figure 91:South America Predictive Maintenance Market Share (%), By Technology, 2033
Figure 92:South America Predictive Maintenance Market Share (%), By Organization Size, 2024
Figure 93:South America Predictive Maintenance Market Share (%), By Organization Size, 2033
Figure 94:South America Predictive Maintenance Market Share (%), By Industry, 2024
Figure 95:South America Predictive Maintenance Market Share (%), By Industry, 2033
Figure 96:Altair Engineering Inc.: Business Revenue Segmentation, 2024
Figure 97:Altair Engineering Inc.: Geographical Revenue Segmentation, 2024
Figure 98:Google: Business Revenue Segmentation, 2024
Figure 99:Google: Geographical Revenue Segmentation, 2024
Figure 100:General Electric: Business Revenue Segmentation, 2024
Figure 101:General Electric: Geographical Revenue Segmentation, 2024
Figure 102:Micro Focus: Business Revenue Segmentation, 2024
Figure 103:Micro Focus: Geographical Revenue Segmentation, 2024
Figure 104:PTC: Geographical Revenue Segmentation, 2024
Figure 105:Hitachi: Business Revenue Segmentation, 2024
Figure 106:Hitachi: Geographical Revenue Segmentation, 2024
Figure 107:IBM Corporation: Business Revenue Segmentation, 2024
Figure 108:IBM Corporation: Geographical Revenue Segmentation, 2024
Figure 109:Microsoft Corporation: Business Revenue Segmentation, 2024
Figure 110:Microsoft Corporation: Geographical Revenue Segmentation, 2024
Figure 111:Oracle Corporation: Business Revenue Segmentation, 2024
Figure 112:Oracle Corporation: Geographical Revenue Segmentation, 2024
Figure 113:Schneider Electric: Business Revenue Segmentation, 2024
Figure 114:Schneider Electric: Geographical Revenue Segmentation, 2024
Figure 115:Siemens AG: Business Revenue Segmentation, 2024
Figure 116:Siemens AG: Geographical Revenue Segmentation, 2024
Figure 117:SAP SE: Business Revenue Segmentation, 2024
Figure 118:SAP SE: Geographical Revenue Segmentation, 2024
Figure 119:Software AG: Business Revenue Segmentation, 2024
Figure 120:Software AG: Geographical Revenue Segmentation, 2024
Figure 121:Splunk: Geographical Revenue Segmentation, 2024


Features | Type of License | ||||
Data Book | Single User |   Multi User | Corporate | ||
| e-Access | ✓ | ✓ | ✓ | ✓ | |
User Sharing | 1 User Only | 1 User Only | Up to 7 Users | Unlimited User Access | |
⨉ | ⨉ | ⨉ | ✓ | ||
Free Customization | No Free Customization | Up To 30 hrs work | Up To 60 hrs work | Up To 80 hrs work | |
Deliverable |
| ⨉ | ✓ | ✓ | ✓ |
| ✓ | ⨉ | ✓ | ✓ | |
| ⨉ | ⨉ | ⨉ | ✓ | |
Analyst Support | 2-Months Analyst Support | 4-Months Analyst Support | 7-Months Analyst Support | One Year Analyst Support | |
Free Report update in next update cycle | ⨉ | ⨉ | ⨉ | ✓ | |
Free Industry Update (Within 180 days) | ⨉ | ⨉ | ⨉ | ✓ | |
Benefit | Up to 10% off on Post Purchase | Up to 20% off on Post Purchase | Up to 30% off on Post Purchase | Up to 40% off on Post Purchase | |