Table 1.Global Smart Beds Market Size (US$ Mn), By Product Type, 2019-2032
Table 2.Global Smart Beds Market Size (US$ Mn), By End User, 2019-2032
Table 3.Global Smart Beds Market Size (US$ Mn), By Distribution Channel, 2019-2032
Table 4.Global Smart Beds Market Size (US$ Mn), By Region, 2019-2032
Table 5.North America Smart Beds Market Size (US$ Mn), By Product Type, 2019-2032
Table 6.North America Smart Beds Market Size (US$ Mn), By End User, 2019-2032
Table 7.North America Smart Beds Market Size (US$ Mn), By Distribution Channel, 2019-2032
Table 8.North America Smart Beds Market Size (US$ Mn), By Country, 2019-2032
Table 9.Europe Smart Beds Market Size (US$ Mn), By Product Type, 2019-2032
Table 10.Europe Smart Beds Market Size (US$ Mn), By End User, 2019-2032
Table 11.Europe Smart Beds Market Size (US$ Mn), By Distribution Channel, 2019-2032
Table 12.Europe Smart Beds Market Size (US$ Mn), By Country, 2019-2032
Table 13.Asia Pacific Smart Beds Market Size (US$ Mn), By Product Type, 2019-2032
Table 14.Asia Pacific Smart Beds Market Size (US$ Mn), By End User, 2019-2032
Table 15.Asia Pacific Smart Beds Market Size (US$ Mn), By Distribution Channel, 2019-2032
Table 16.Asia Pacific Smart Beds Market Size (US$ Mn), By Country, 2019-2032
Table 17.Middle East & Africa Smart Beds Market Size (US$ Mn), By Product Type, 2019-2032
Table 18.Middle East & Africa Smart Beds Market Size (US$ Mn), By End User, 2019-2032
Table 19.Middle East & Africa Smart Beds Market Size (US$ Mn), By Distribution Channel, 2019-2032
Table 20.Middle East & Africa Smart Beds Market Size (US$ Mn), By Country, 2019-2032
Table 21.South America Smart Beds Market Size (US$ Mn), By Product Type, 2019-2032
Table 22.South America Smart Beds Market Size (US$ Mn), By End User, 2019-2032
Table 23.South America Smart Beds Market Size (US$ Mn), By Distribution Channel, 2019-2032
Table 24.South America Smart Beds Market Size (US$ Mn), By Country, 2019-2032
Table 25.Paramount Bed Co. Ltd. Financial Analysis
Table 26.Stryker Corporation Financial Analysis
Table 27.Sleep Number Financial Analysis
Table 28.Invacare Corporation Financial Analysis
Table 29.Hill-Rom Holdings, Inc. Financial Analysis
Table 30.Arjohuntleigh AB Financial Analysis
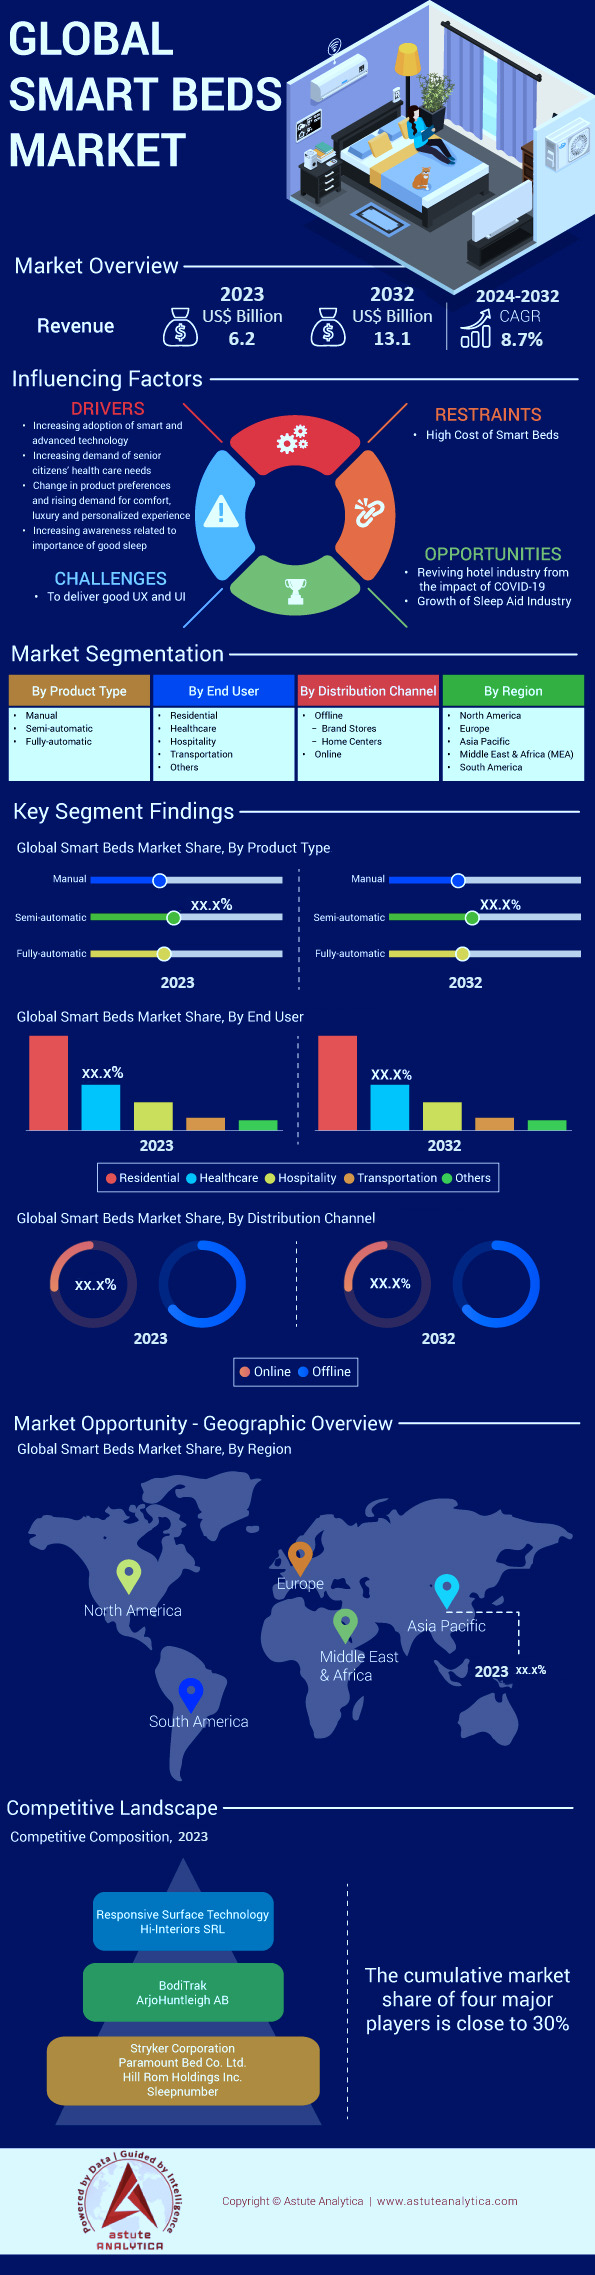
Figure 1:Executive Summary: Smart Bed Market Size, By Value (US$ Bn)
Figure 2:Global Smart Bed Market Outlook, 2018-2032 (US$ Bn)
Figure 3:Technology Adoption Curve
Figure 4:Estimated Adoption Rate of Smart Technology by Consumers
Figure 5:Ageing population across OECD and non-OECD member countries in 1980, 2023 & 2060
Figure 6:Daily living observations of the senior citizens
Figure 7:Mattress Replacement Cycle
Figure 8:Covid-19 Impact Analysis
Figure 9:Pricing Analysis, By Component
Figure 10:Pricing Analysis, by Product Type (Average Prices in US$), 2023 Price Trend
Figure 11:Global Smart Beds Market, By Product Type, CAGR (%), 2023-2032
Figure 12:Global Smart Beds Market Share (%), by Product Type, 2023
Figure 13:Global Smart Beds Market Share (%), by Product Type, 2032
Figure 14:Global Smart Beds Market, By End User, CAGR (%), 2023-2032
Figure 15:Global Smart Beds Market Share (%), by End User, 2023
Figure 16:Global Smart Beds Market Share (%), by End User, 2032
Figure 17:Global Smart Beds Market, By Distribution Channel, CAGR (%), 2023-2032
Figure 18:Global Smart Beds Market Share (%), by Distribution Channel, 2023
Figure 19:Global Smart Beds Market Share (%), by Distribution Channel, 2032
Figure 20:Global Smart Beds Market, By Region, CAGR (%), 2023-2032
Figure 21:Global Smart Beds Market Share (%), by Region, 2023
Figure 22:Global Smart Beds Market Share (%), by Region, 2032
Figure 23:North America Smart Bed Market: Highest Share (%) Segment
Figure 24:North America Smart Bed Market: North America Smart Beds Market Share (%), by Product Type, 2023
Figure 25:North America Smart Bed Market: North America Smart Beds Market Share (%), by Product Type, 2032
Figure 26:North America Smart Beds Market Share (%), by End User, 2023
Figure 27:North America Smart Beds Market Share (%), by End User, 2032
Figure 28:North America Smart Beds Market Share (%), by Distribution Channel, 2023
Figure 29:North America Smart Beds Market Share (%), by Distribution Channel, 2032
Figure 30:North America Smart Beds Market Share (%), by Country, 2023
Figure 31:North America Smart Beds Market Share (%), by Country, 2032
Figure 32:Europe Smart Bed Market: Highest Share (%) Segment
Figure 33:Europe Smart Beds Market Share (%), by Product Type, 2023
Figure 34:Europe Smart Beds Market Share (%), by Product Type, 2032
Figure 35:Europe Smart Beds Market Share (%), by End User, 2023
Figure 36:Europe Smart Beds Market Share (%), by End User, 2032
Figure 37:Europe Smart Beds Market Share (%), by Distribution Channel, 2023
Figure 38:Europe Smart Beds Market Share (%), by Distribution Channel, 2032
Figure 39:Europe Smart Beds Market Share (%), by Country, 2023
Figure 40:Europe Smart Beds Market Share (%), by Country, 2032
Figure 41:Asia Pacific Smart Beds Market Share (%), by Product Type, 2023
Figure 42:Asia Pacific Smart Beds Market Share (%), by Product Type, 2032
Figure 43:Asia Pacific Smart Beds Market Share (%), by End User, 2023
Figure 44:Asia Pacific Smart Beds Market Share (%), by End User, 2032
Figure 45:Asia Pacific Smart Beds Market Share (%), by Distribution Channel, 2023
Figure 46:Asia Pacific Smart Beds Market Share (%), by Distribution Channel, 2032
Figure 47:Asia Pacific Smart Beds Market Share (%), by Country, 2023
Figure 48:Asia Pacific Smart Beds Market Share (%), by Country, 2032
Figure 49:Middle East & Africa Smart Bed Market: Highest Share (%) Segment
Figure 50:Middle East & Africa Smart Beds Market Share (%), by Product Type, 2023
Figure 51:Middle East & Africa Smart Beds Market Share (%), by Product Type, 2032
Figure 52:Middle East & Africa Smart Beds Market Share (%), by End User, 2023
Figure 53:Middle East & Africa Smart Beds Market Share (%), by End User, 2032
Figure 54:Middle East & Africa Smart Beds Market Share (%), by Distribution Channel, 2023
Figure 55:Middle East & Africa Smart Beds Market Share (%), by Distribution Channel, 2032
Figure 56:Middle East & Africa Smart Beds Market Share (%), by Country, 2023
Figure 57:Middle East & Africa Smart Beds Market Share (%), by Country, 2032
Figure 58:South America Smart Bed Market: Highest Share (%) Segment
Figure 59:South America Smart Beds Market Share (%), by Product Type, 2023
Figure 60:South America Smart Beds Market Share (%), by Product Type, 2032
Figure 61:South America Smart Beds Market Share (%), by End User, 2023
Figure 62:South America Smart Beds Market Share (%), by End User, 2032
Figure 63:South America Smart Beds Market Share (%), by Distribution Channel, 2023
Figure 64:South America Smart Beds Market Share (%), by Distribution Channel, 2032
Figure 65:South America Smart Beds Market Share (%), by Country, 2023
Figure 66:South America Smart Beds Market Share (%), by Country, 2032
Figure 67:Paramount Bed Co. Ltd.: Business Segment Wise Revenue Share, 2023
Figure 68:Paramount Bed Co. Ltd.: Regional Revenue Segmentation Share, 2023
Figure 69:Stryker Corporation: Business Segment Wise Revenue Share, 2023
Figure 70:Stryker Corporation: Regional Revenue Segmentation Share, 2023
Figure 71:Invacare Corporation: Business Revenue Segmentation, 2023
Figure 72:Invacare Corporation: Geographical Revenue Segmentation, 2023
Figure 73:Hill-Rom Holdings, Inc.: Business Revenue Segmentation, 2023
Figure 74:Hill-Rom Holdings, Inc.: Geographical Revenue Segmentation, 2023
Figure 75:Arjohuntleigh AB: Business Revenue Segmentation, 2023
Figure 76:Arjohuntleigh AB: Geographical Revenue Segmentation, 2023


Features | Type of License | ||||
Data Book | Single User |   Multi User | Corporate | ||
| e-Access | ✓ | ✓ | ✓ | ✓ | |
User Sharing | 1 User Only | 1 User Only | Up to 7 Users | Unlimited User Access | |
⨉ | ⨉ | ⨉ | ✓ | ||
Free Customization | No Free Customization | Up To 30 hrs work | Up To 60 hrs work | Up To 80 hrs work | |
Deliverable |
| ⨉ | ✓ | ✓ | ✓ |
| ✓ | ⨉ | ✓ | ✓ | |
| ⨉ | ⨉ | ⨉ | ✓ | |
Analyst Support | 2-Months Analyst Support | 4-Months Analyst Support | 7-Months Analyst Support | One Year Analyst Support | |
Free Report update in next update cycle | ⨉ | ⨉ | ⨉ | ✓ | |
Free Industry Update (Within 180 days) | ⨉ | ⨉ | ⨉ | ✓ | |
Benefit | Up to 10% off on Post Purchase | Up to 20% off on Post Purchase | Up to 30% off on Post Purchase | Up to 40% off on Post Purchase | |