U.S. Produced Water Treatment Market: Treatment Technology (Physical Treatment, Chemical Treatment, Biological Treatment); Produced Water Usage (Agricultural Use, Industrial Use, Municipal Use, Oil & Gas Field Operations, Other Emerging Uses); Application (Onshore Operations and Offshore Operations); Sources of Produced Water (Conventional Sources and Unconventional Sources); End User (Oil & Gas Operators (Upstream, Offshore, Onshore), Midstream & Water Services Companies, Independent Water Treatment Service Providers, Power Generation Facilities, Mining & Mineral Processing Companies, Chemical & Petrochemical Industries, Municipal & Regional Water Authorities)—Market Size, Industry Dynamics, Opportunity Analysis and Forecast for 2025–2033
- Last Updated: 30-Sep-2025 | | Report ID: AA09251518

Publication Date: Aug-2021
Base Year 2024
Historic Year 2020-2023
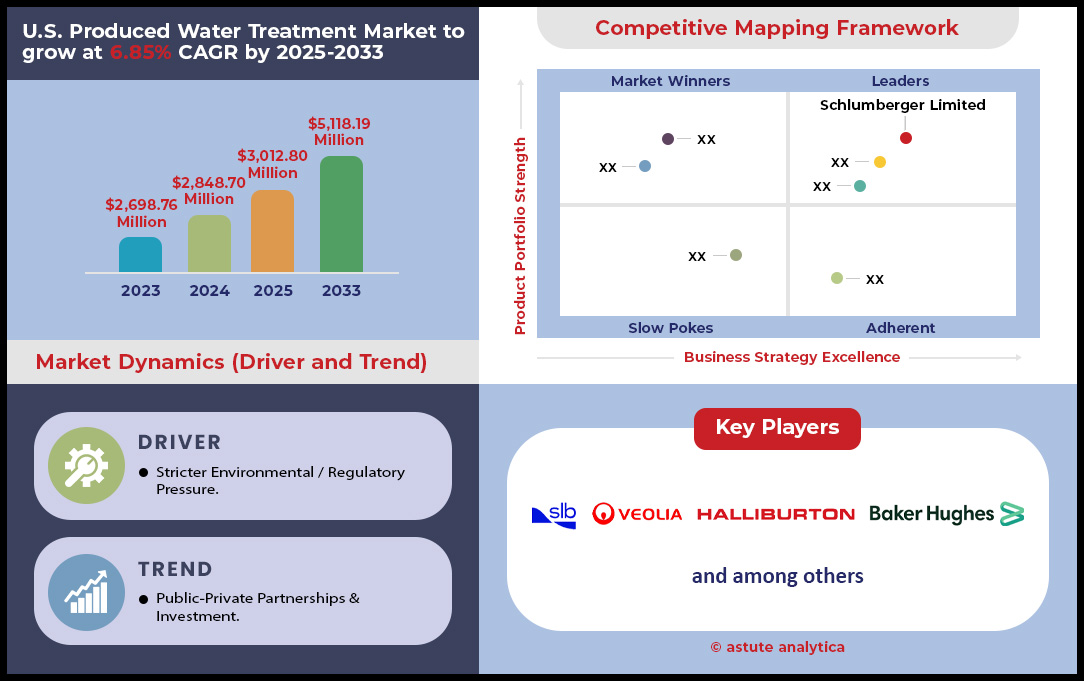
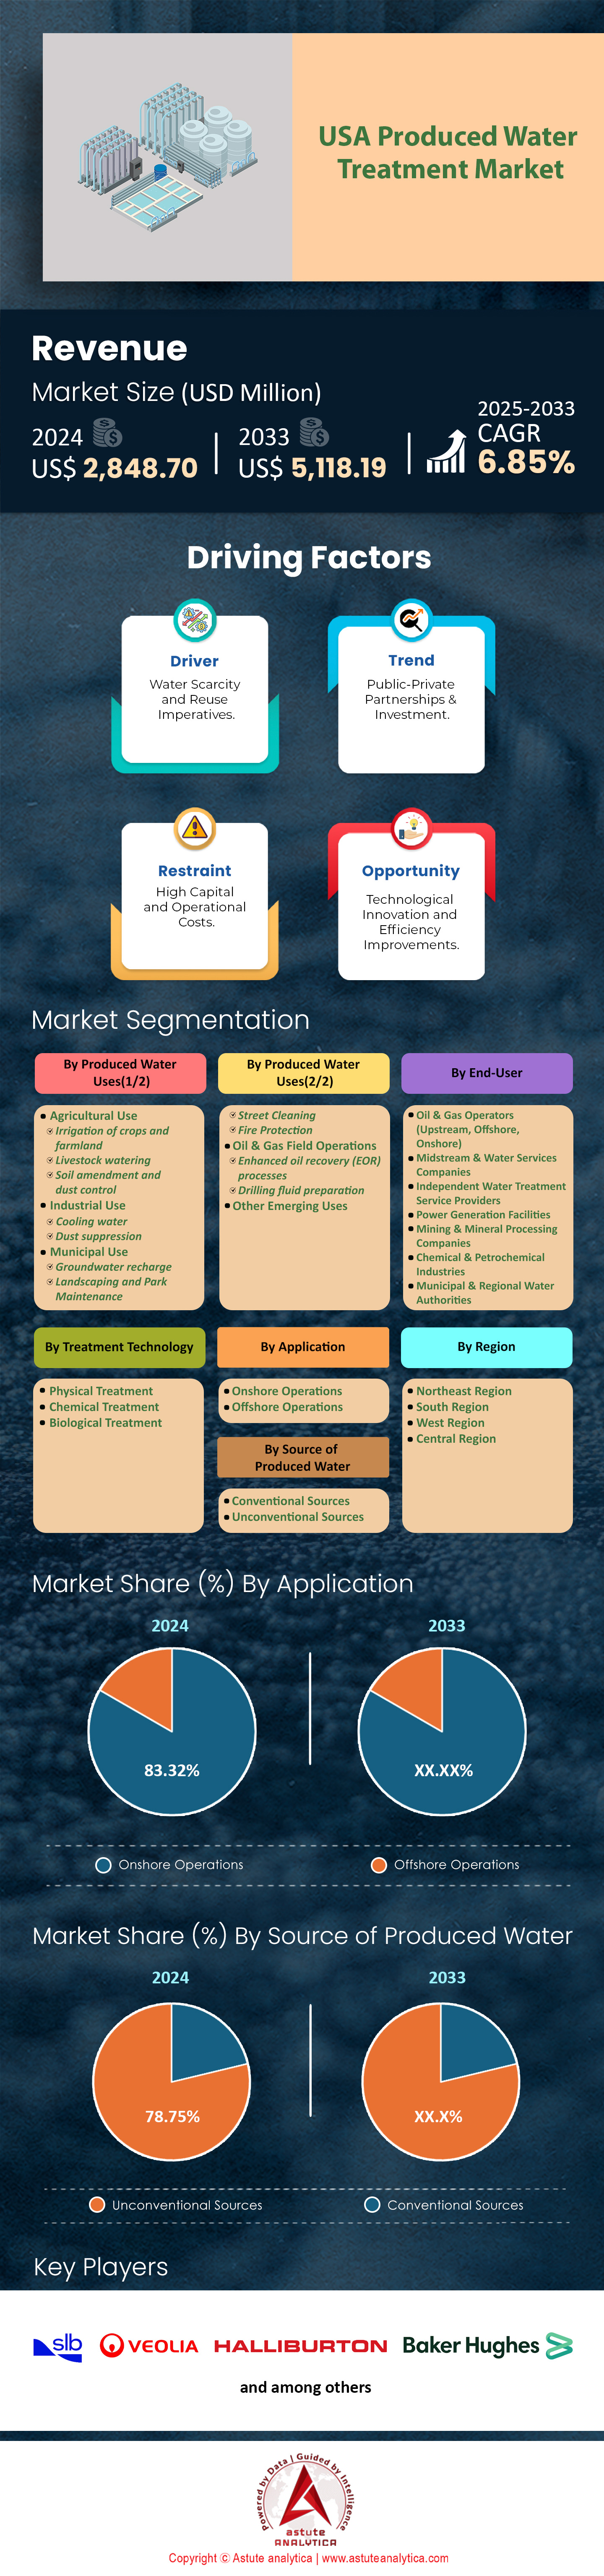
Forecast Year 2025-2033
No Of Pages 179
Total Figures 40
Total Tables 50


Features | Type of License | ||||
Data Book | Single User |   Multi User | Corporate | ||
| e-Access | ✓ | ✓ | ✓ | ✓ | |
User Sharing | 1 User Only | 1 User Only | Up to 7 Users | Unlimited User Access | |
⨉ | ⨉ | ⨉ | ✓ | ||
Free Customization | No Free Customization | Up To 30 hrs work | Up To 60 hrs work | Up To 80 hrs work | |
Deliverable |
| ⨉ | ✓ | ✓ | ✓ |
| ✓ | ⨉ | ✓ | ✓ | |
| ⨉ | ⨉ | ⨉ | ✓ | |
Analyst Support | 2-Months Analyst Support | 4-Months Analyst Support | 7-Months Analyst Support | One Year Analyst Support | |
Free Report update in next update cycle | ⨉ | ⨉ | ⨉ | ✓ | |
Free Industry Update (Within 180 days) | ⨉ | ⨉ | ⨉ | ✓ | |
Benefit | Up to 10% off on Post Purchase | Up to 20% off on Post Purchase | Up to 30% off on Post Purchase | Up to 40% off on Post Purchase | |