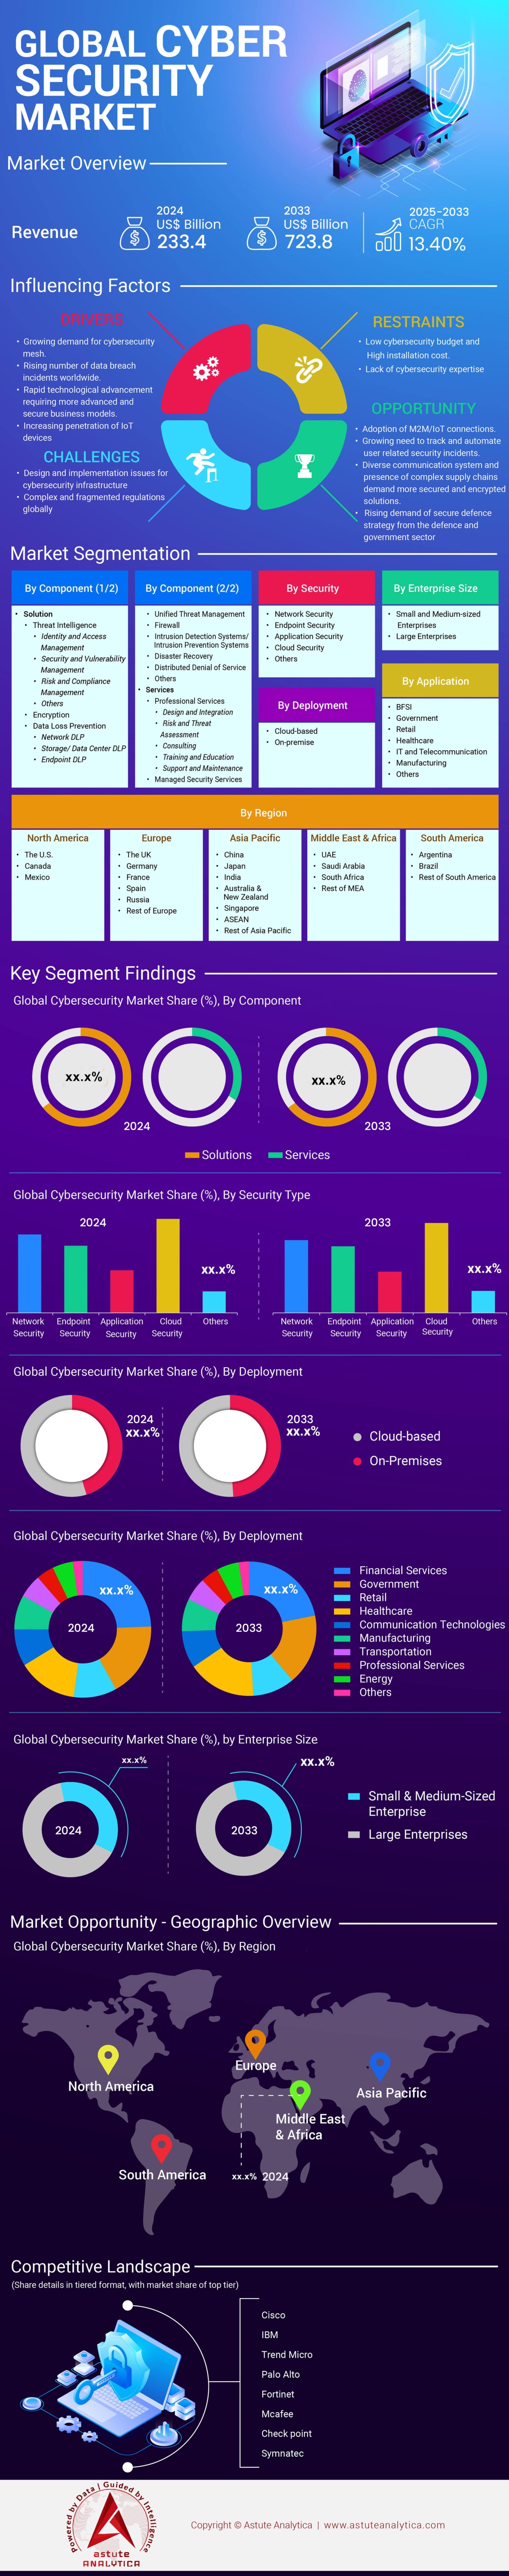
网络安全市场:按组件(解决方案和服务);安全(网络安全、终端安全、应用安全、云安全及其他);开发(云端和本地部署);企业规模(中小企业和大型企业);以及应用(银行、金融服务和保险 (BFSI)、政府、零售、医疗保健、IT 和电信、制造业及其他);区域——市场规模、行业动态、机遇分析及 2025-2033 年预测
- 最后更新日期:2025年6月28日 | | 报告编号:AA1120007
表1:利益相关者分析表2:市场动态影响分析表3:按国家和人口划分的数据泄露数量表4:竞争对手分析与基准测试表5:网络安全出口市场规模(亿美元)表6:2024-2033年全球网络安全市场规模(亿美元),按组件划分表7:2024-2033年全球网络安全市场规模(亿美元),按安全类型划分表8:2024-2033年全球网络安全市场规模(亿美元),按部署方式划分表9:2024-2033年全球网络安全市场规模(亿美元),按应用划分表10:2024-2033年全球网络安全市场规模(亿美元),按企业规模划分表11:2024-2033年全球网络安全市场规模(亿美元),按地区划分表表12:亚太地区网络安全市场规模(亿美元),按国家/地区划分,2024-2033年;表13:亚太地区网络安全市场规模(亿美元),按组件划分,2024-2033年;表14:亚太地区网络安全市场规模(亿美元),按安全类型划分,2024-2033年;表15:亚太地区网络安全市场规模(亿美元),按部署方式划分,2024-2033年;表16:亚太地区网络安全市场规模(亿美元),按应用划分,2024-2033年;表17:亚太地区网络安全市场规模(亿美元),按企业规模划分,2024-2033年;表18:新加坡网络安全市场规模(亿美元),按组件划分,2024-2033年;表19:新加坡网络安全市场规模(亿美元),按安全类型划分,2024-2033年。表20:新加坡网络安全市场规模(十亿美元),按部署方式划分,2024-2033年;表21:新加坡网络安全市场规模(十亿美元),按应用划分,2024-2033年;表22:新加坡网络安全市场规模(十亿美元),按企业规模划分,2024-2033年;表23:思科系统:财务分析;表24:IBM公司:财务分析;表25:微软公司:财务分析;表26:McAfee:财务分析;表27:趋势科技:财务分析;表28:BAE系统公司:财务分析;表29:Check Point软件技术有限公司:财务分析;表30:F5 Networks:财务分析;表31:FireEye公司:财务分析;表32:Proofpoint公司:财务分析;表33:Sophos PLC:财务分析。表34:Fortinet公司:财务分析表;表35:NortonLifeLock:财务分析表;表36:Juniper Networks:财务分析表;表37:Palo Alto Networks公司:财务分析表;表38:Qualys公司:财务分析表
图 1:2020-2033 年全球网络安全市场规模(按价值计,单位:十亿美元)图 2:网络安全流程概述图 3:网络安全市场价值链概述图 4:网络安全市场价值链概述 - 利益相关者映射图 5:按安全类型划分的网络安全市场(首选) 图 6:2020-2033 年网络安全市场(按收入计,单位:十亿美元)图 7:按部署方式划分的网络安全市场(按收入计,单位:十亿美元)图 8:网络安全网 - 2024 年顶级战略技术图 9:数据、安全和基础设施的技术类型图 10:物联网 - 2024 年顶级趋势技术图 11:2018-2024 年全球网络安全支出(单位:十亿美元)图 12:按地区划分的网络安全劳动力缺口图13:避免网络攻击的方法图14:过去十年网络攻击事件图15:网络空间的新兴威胁图16:塑造安全市场的技术趋势图17:网络安全基础设施的设计和实施问题图18:网络安全行业的监管环境图19:全球网络安全市场规模(十亿美元),新冠疫情影响及复苏,2020-2033年图20:按产品划分的价格分析(平均价格,美元)图21:市场集中度图22:主要公司市场份额分析,基于收入(2024年)图23:全球网络安全市场分析,按组件划分,复合年增长率(%),2024-2033年图24:全球网络安全市场份额(%),按组件划分,2033年图25:全球网络安全市场分析,按安全类型划分,复合年增长率(%),2024-2033年图26:2024年全球网络安全市场份额(%),按安全类型划分;图27 :2033年全球网络安全市场份额(%),按安全类型划分;图28:2024-2033年全球网络安全市场分析,按部署方式划分,复合年增长率(%);图29:2024年全球网络安全市场份额(%),按部署方式划分;图30:2033年全球网络安全市场份额(%),按部署方式划分;图31:2024-2033年全球网络安全市场分析,按应用划分,复合年增长率(%);图32:2024年全球网络安全市场份额(%),按应用划分;图33:2033年全球网络安全市场份额(%),按应用划分;图34:2024-2033年全球网络安全市场分析,按企业规模划分,复合年增长率(%);图35:2024年全球网络安全市场份额(%),按企业规模划分。图36:全球网络安全市场份额(%),按企业规模划分,2033年;图37:全球网络安全市场分析,按地区划分,复合年增长率(%),2024-2033年;图38:全球网络安全市场份额(%),按地区划分,2024年;图39:全球网络安全市场份额(%),按地区划分,2033年;图40:亚太地区,复合年增长率最高(%)细分市场;图41:亚太地区网络安全市场分析,按国家划分,复合年增长率(%),2024-2033年;图42:亚太地区网络安全市场份额(%),按国家划分,2024年;图43:亚太地区网络安全市场份额(%),按国家划分,2033年;图44:亚太地区网络安全市场分析,按组件划分,复合年增长率(%),2024-2033年;图45:亚太地区网络安全市场份额(%),按组件划分,2024年;图46:亚太地区网络安全市场份额(%)图 47:亚太网络安全市场分析,按安全类型划分,复合年增长率 (%),2024-2033 年;图 48:亚太网络安全市场份额 (%),按安全类型划分,2024 年;图 49:亚太网络安全市场份额 (%),按安全类型划分,2033 年;图 50:亚太网络安全市场分析,按部署方式划分,复合年增长率 (%),2024-2033 年;图 51:亚太网络安全市场份额 (%),按部署方式划分,2024 年;图 52:亚太网络安全市场份额 (%),按部署方式划分,2033 年;图 53:亚太网络安全市场分析,按应用划分,复合年增长率 (%),2024-2033 年;图 54:亚太网络安全市场份额 (%),按应用划分,2024 年;图 55:亚太网络安全市场份额 (%),按应用划分,2033 年。图56:亚太地区网络安全市场,按企业规模划分,复合年增长率(%),2024-2033年;图57:亚太地区网络安全市场份额(%),按企业规模划分,2024年;图58:亚太地区网络安全市场份额(%),按企业规模划分,2033年;图59:新加坡网络安全市场分析,按组件划分,复合年增长率(%),2024-2033年;图60:新加坡网络安全市场份额(%),按组件划分,2024年;图61:新加坡网络安全市场份额(%),按组件划分,2033年;图62:新加坡网络安全市场分析,按安全类型划分,复合年增长率(%),2024-2033年;图63:新加坡网络安全市场份额(%),按安全类型划分,2024年;图64:新加坡网络安全市场份额(%),按安全类型划分,2033年。图65:新加坡网络安全市场分析,按部署方式划分,复合年增长率(%),2024-2033年;图66 :新加坡网络安全市场份额(%),按部署方式划分,2024年;图67:新加坡网络安全市场份额(%),按部署方式划分,2033年;图68:新加坡网络安全市场分析,按应用划分,复合年增长率(%),2024-2033年;图69:新加坡网络安全市场份额(%),按应用方式划分,2024年;图70:新加坡网络安全市场份额(%),按应用方式划分,2033年;图71:新加坡网络安全市场,按企业规模划分,复合年增长率(%),2024-2033年;图72:新加坡网络安全市场份额(%),按企业规模划分,2024年;图73:新加坡网络安全市场份额(%),按企业规模划分,2024-2033年。图74 :思科系统:2024 年业务收入细分;图 75:思科系统:2024 年地域收入细分;图 76:IBM 公司:2024 年业务收入细分;图 77:IBM 公司:2024 年地域收入细分;图 78:微软公司:2024 年业务收入细分;图 79:微软公司:2024 年地域收入细分;图 80:迈克菲:2024 年业务收入细分;图 81:迈克菲:2024 年地域收入细分;图 82:趋势科技:2024 年业务收入细分;图 83:趋势科技:2024 年地域收入细分;图 84:BAE 系统公司:业务收入图 85:BAE Systems, Inc.:2024年地域收入细分;图 86:Check Point Software Technology Ltd.:2024年业务收入细分;图 87:Check Point Software Technology Ltd.:2024 年地域收入细分;图 88:F5 Networks:2024 年业务收入细分;图 89:F5 Networks:2024 年地域收入细分;图 90:FireEye, Inc.:2024 年业务收入细分;图 91:FireEye, Inc.:2024 年地域收入细分;图 92:Proofpoint Inc.:2024 年业务收入细分;图 93:Proofpoint Inc.:2024 年地域收入细分;图 94:Sophos PLC:业务收入图 95:Sophos PLC:2024 年地域收入细分;图96:Fortinet, Inc.:2024 年业务收入细分;图 97:Fortinet, Inc.:2024 年地域收入细分;图 98:NortonLifeLock:2024 年业务收入细分;图 99:NortonLifeLock:2024 年地域收入细分;图 100:Juniper Networks:2024 年业务收入细分;图 101:Juniper Networks:2024 年地域收入细分;图 102:Palo Alto Networks, Inc.:2024 年业务收入细分;图 103:Palo Alto Networks, Inc.:2024 年地域收入细分。图104:Qualys公司:2024年业务收入细分;图105:Qualys公司:2024年地域收入细分


特征 | 许可证类型 | ||||
数据手册 | 单用户 |   多用户 | 公司的 | ||
| 电子访问 | ✓ | ✓ | ✓ | ✓ | |
用户共享 | 仅限1位用户 | 仅限1位用户 | 最多 7 位用户 | 无限制用户访问 | |
打印 | ⨉ | ⨉ | ⨉ | ✓ | |
免费定制 | 不提供免费定制服务 | 最多工作30小时 | 最多工作 60 小时 | 最多工作80小时 | |
交付物 |
| ⨉ | ✓ | ✓ | ✓ |
| ✓ | ⨉ | ✓ | ✓ | |
| ⨉ | ⨉ | ⨉ | ✓ | |
分析支持 | 2 个月分析师支持 | 4个月分析师支持 | 7 个月分析师支持 | 一年分析师支持 | |
免费报告更新即将发布 更新周期 | ⨉ | ⨉ | ⨉ | ✓ | |
免费行业动态 (180天内) | ⨉ | ⨉ | ⨉ | ✓ | |
益处 | 购买后最高可享 10% 折扣 | 购买后最高可享20%折扣 | 购买后最高可享30%折扣 | 购买后最高可享 40% 折扣 | |