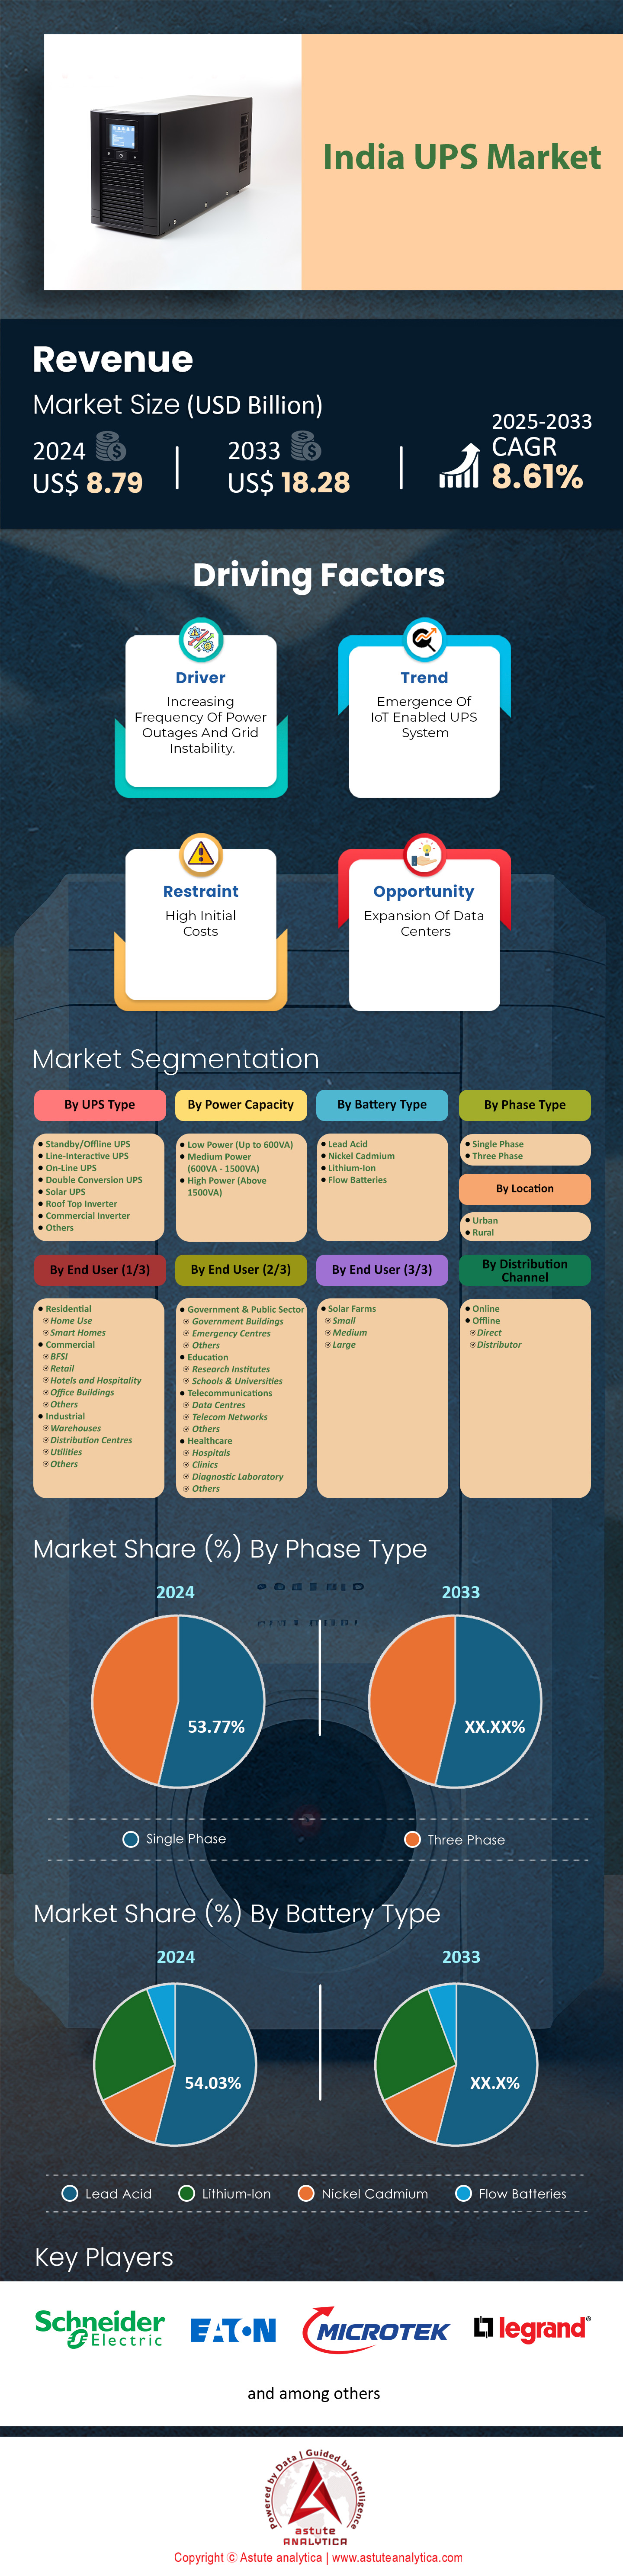
印度UPS市场:按UPS类型(备用/离线式UPS、在线互动式UPS、在线式UPS、双转换UPS、太阳能UPS、屋顶逆变器、商用逆变器、其他);功率容量(低功率(最高600VA)、中功率(600VA-1500VA)、高功率(1500VA以上));相数类型(单相和三相);电池类型(铅酸电池、镍镉电池、锂离子电池和液流电池);位置(城市和农村)划分。最终用户(住宅(家庭使用、智能家居)、商业(银行、金融服务和保险、零售、酒店和餐饮、办公楼、其他);工业(仓库、配送中心、公用事业、其他)、政府和公共部门(政府大楼、应急中心、其他)、教育(研究机构、学校和大学)、电信(数据中心、电信网络、其他)、医疗保健(医院、诊所、诊断实验室、其他);国家——市场规模、行业动态、机遇分析和2025-2033年预测
- 最后更新日期:2025年3月5日 | | 报告编号:AA03251217
表1 行业展望:印度UPS系统行业技术概述表2 行业展望:不间断电源(UPS)发展趋势概述表3 行业展望:最终用户总用电量增长(GWh)——按邦划分(2022-2023年)表4 行业展望:最终用户总用电量增长(GWh)——按邦划分表5 行业展望:主要厂商区域分布——印度(按地理位置划分)表6 行业展望:UPS逆变器设计更新概述表7 行业展望:印度半导体进口——2023年表8 印度UPS半导体市场规模(亿美元),按半导体类型划分,2020-2033年表9 印度UPS半导体市场规模(亿美元),按材料划分,2020-2033年表10 印度UPS半导体市场规模(亿美元),按应用划分, 2020-2033年PESTLE影响分析表 11:政治因素表 12:经济因素 PESTLE影响分析表 13:社会因素 PESTLE影响分析表 14:技术因素表 15:环境因素 PESTLE影响分析表 16:法律因素 PESTLE影响分析表 17:驱动因素:各邦/联邦属地太阳能潜力详情(2024年)表 18:机遇:印度数据中心供需情况 - 2022年表 19:产品价格分析:基于产品的价格分析(美元/单位)表 20:印度UPS市场规模(十亿美元),按UPS类型划分,2020-2033年 表 21:印度UPS市场规模(千台),按UPS类型划分,2020-2033年表 22:印度UPS市场规模(十亿美元),按功率容量划分,2020-2033年表 23:印度表24:印度UPS市场规模(千台),按功率容量划分,2020-2033年;表25:印度UPS市场规模(十亿美元),按相型划分,2020-2033年;表26:印度UPS市场规模(千台),按相型划分,2020-2033年;表27:印度UPS市场规模(十亿美元),按电池类型划分,2020-2033年;表28:印度UPS市场规模(千台),按电池类型划分,2020- 2033年;表29:印度UPS市场规模(千台),按地区划分,2020-2033年;表30:印度UPS市场规模(十亿美元),按地区划分,2020-2033年;表31:印度UPS市场规模(千台) ,按最终用户划分,2020-2033年。最终用户,2020-2033年表 32 印度 UPS 市场规模(十亿美元),按分销渠道划分,2020-2033年表 33 印度 UPS 市场规模(千台),按分销渠道划分,2020-2033年表 34 ABB 有限公司:近期发展表 35 ABB 有限公司:产品表 36 ABB 有限公司:财务分析表 37 Cyber Power Systems 公司:近期发展表 38 Cyber Power Systems公司:产品 表 39 Cyber Power Systems 公司:UPS 出口和国内销售的销售额贡献表 40 Cyber Power Systems 公司:UPS 产品本地化程度表 41 Cyber Power Systems 公司:本地采购与进口的组件/活动表 42 Cyber Power Systems 公司:大致成本构成(假设为 1kVA UPS)表 43 Cyber Power Systems 公司:UPS 中半导体材料的成本构成表 44 Cyber Power Systems, Inc.:UPS 中半导体器件(MOSFET、IGBT、微控制器、耦合器、二极管等)的成本细分(假设为 1kVA UPS)表 45 Cyber Power Systems, Inc.:UPS 中半导体器件(MOSFET、IGBT、微控制器、耦合器、二极管等)的成本细分(假设为 1kVA UPS)表46 Cyber Power Systems, Inc.:财务分析表 47 台达电子:近期发展表 48 台达电子:产品表 49 台达电子:财务分析表 50 伊顿公司:近期发展表 51 伊顿公司:产品表 52 伊顿公司:UPS 出口和国内销售的销售额贡献表 53 伊顿公司:UPS 产品本地化程度表 54 伊顿公司伊顿公司:本地采购与进口组件/活动对比表 55 伊顿公司:大致成本细分(假设为 1kVA UPS)表 56 伊顿公司:UPS 中半导体材料的成本细分(假设为 1kVA UPS)表 57 伊顿公司:UPS 中半导体器件(MOSFET、IGBT、微控制器、耦合器、二极管等)的成本细分(假设为 1kVA UPS)表 58 伊顿公司:UPS 中半导体器件(MOSFET、IGBT、微控制器、耦合器、二极管等)的成本细分(假设为 1kVA UPS)表 59 伊顿公司:财务分析表 60 艾默生电气公司:产品表 61 艾默生电气公司:财务分析表 62 EnerSys:产品表 63 EnerSys:财务分析表64 日立有限公司:产品表 65 日立有限公司:财务分析表 66 罗格朗集团:产品表 67 罗格朗集团:UPS产品出口和国内销售贡献表 68 罗格朗集团:UPS产品本地化程度表 69 罗格朗集团:本地采购与进口零部件/活动对比表 70 罗格朗集团:近似成本细分(假设为1kVA UPS) 71 罗格朗集团:UPS中半导体材料的成本细分(假设为1kVA UPS) 72 罗格朗集团:UPS中半导体器件(MOSFET、IGBT、微控制器、耦合器、二极管等)的成本细分(假设为1kVA UPS) 73 罗格朗集团:UPS中半导体器件(MOSFET、IGBT、微控制器、耦合器、二极管等)的成本细分(假设为1kVA UPS)表 74罗格朗集团:财务分析表 75 鲁米诺斯电力科技:产品表 76 鲁米诺斯电力科技:UPS 出口和国内销售的销售额贡献表 77 鲁米诺斯电力科技:UPS 产品本地化程度表 78 鲁米诺斯电力科技:本地采购与进口的组件/活动表 79 鲁米诺斯电力科技:近似成本细分(假设为 1kVA UPS)表 80 鲁米诺斯电力科技:UPS 中半导体材料的成本细分(假设为 1kVA UPS)表 81 鲁米诺斯电力科技:UPS 中半导体器件(MOSFET、IGBT、微控制器、耦合器、二极管等)的成本细分(假设为 1kVA UPS)表 82 鲁米诺斯电力科技:UPS 中半导体器件(MOSFET、IGBT、微控制器、耦合器、二极管等)的成本细分(假设为1kVA UPS)表83 Luminous Power Technologies:施耐德电气 SE(母公司):财务分析表 84 Microtek International:产品表 85 Microtek International:财务分析表 86 三菱电机株式会社:产品表 87 三菱电机株式会社:财务分析表 88 Numeric Power Systems:产品表 89 Legrand(母公司):财务分析表 90 Riello Elettronica Group:近期发展表 91 Riello Elettronica Group:产品表 92 Riello Elettronica Group:UPS 出口和国内销售的销售额贡献表 93 Riello Elettronica Group:UPS 产品本地化程度表 94 Riello Elettronica Group:本地采购与进口的组件/活动表 95 Riello Elettronica Group:近似成本细分(假设为 1kVA UPS)表 96 Riello Elettronica Group:成本细分表 97 Riello Elettronica 集团: UPS 中半导体器件(MOSFET、IGBT、微控制器、耦合器、二极管等)的成本细分(假设为 1kVA UPS)表 98 Riello Elettronica 集团:UPS 中半导体器件(MOSFET、IGBT、微控制器、耦合器、二极管等)的成本细分(假设为 1kVA UPS)表99 施耐德电气:近期发展表 100 施耐德电气:产品表 101 施耐德电气:UPS 出口和国内销售的销售额贡献表 102 施耐德电气:UPS 产品本地化程度表 103 施耐德电气:本地采购与进口的组件/活动表 104 施耐德电气:近似成本细分(假设为 1kVA)表 105施耐德电气股份有限公司:UPS 中半导体材料的成本细分(假设为 1kVA UPS)表 106 施耐德电气股份有限公司:UPS 中半导体器件(MOSFET、IGBT、微控制器、耦合器、二极管等)的成本细分(假设为 1kVA UPS)表 107 施耐德电气股份有限公司:UPS 中半导体器件(MOSFET、IGBT、微控制器、耦合器、二极管等)的成本细分(假设为 1kVA UPS)表 108 施耐德电气股份有限公司:财务分析表 109 索科迈克印度私人有限公司:近期发展表 110 索科迈克印度私人有限公司:产品表 111 索科迈克印度私人有限公司:UPS 出口和国内销售的销售额贡献表 112 索科迈克印度私人有限公司:UPS 产品本地化程度表 113 索科迈克印度私人有限公司:本地采购与进口组件/活动对比表 114 Socomec India Private Limited:大致成本细分(假设为 1kVA UPS)表 115 Socomec India Private Limited:UPS 中半导体材料的成本细分(假设为 1kVA UPS)表 116 Socomec India Private Limited:UPS 中半导体器件(MOSFET、IGBT、微控制器、耦合器、二极管等)的成本细分(假设为 1kVA UPS)表117 Socomec India Private Limited:UPS 中半导体器件(MOSFET、IGBT、微控制器、耦合器、二极管等)的成本细分(假设为 1kVA UPS)表 118 Su-Kam Power Systems Ltd:产品表 119 东芝公司:产品表 120 东芝公司:UPS 出口和国内销售的销售额贡献表 121 东芝公司:UPS产品本地化程度表122 东芝公司:本地采购与进口的组件/活动表123 东芝公司:大致成本细分(假设为1kVA UPS)表124 东芝公司:UPS中半导体材料的成本细分(假设为1kVA UPS)表125 东芝公司:UPS中半导体器件(MOSFET、IGBT、微控制器、耦合器、二极管等)的成本细分(假设为1kVA UPS)表126 东芝公司:UPS中半导体器件(MOSFET、IGBT、微控制器、耦合器、二极管等)的成本细分(假设为1kVA UPS)表127 东芝公司:财务分析表128 Zebronics India Pvt.有限公司:产品表 129 其他主要参与者表 130 附录:二手资料
图 1 执行摘要:印度 UPS 市场规模及预测,2020-2033 年(十亿美元和千台)图 2 行业展望:按最终消费者划分的总电力消耗增长率(%) - 按地区划分(2022-2024 年)图 3 消费者行为分析:按品牌偏好图 4 消费者行为分析:按零售渠道偏好图 5 消费者行为分析:按收入群体偏好图 6 消费者行为分析:按 UPS 类型偏好图 7 消费者行为分析:按容量偏好图 8 消费者行为分析:按维护频率偏好图 9 消费者行为分析:按电池更换频率偏好图 10 消费者行为分析:按与 UPS 相关的关键问题偏好图 11 行业展望:主要参与者的区域集中度 - 印度(基于地理位置)图 12 行业展望:主要参与者的区域集中度 - 印度(基于收入/营业额)图 13 行业展望:能源生产统计概览 - 印度图 14 采用率分析:采用率图 15 采用率分析:印度 UPS 市场,按年增长率(%) ,2020-2033 年;图 16 采用率分析:按功率容量划分,收入比较(十亿美元);图 17 驱动因素:2022-2023 年印度各行业并网可再生能源装机容量分布(%);图 18 驱动因素:2021-2022 年和 2022-2023 年印度并网可再生能源装机容量(兆瓦);图 19 驱动因素:印度并网家庭停电频率(%),按地区划分(2021 年);图 20 趋势:智能家居 - 印度收入(十亿美元);图 21 竞争格局:市场份额分析,按公司划分,基于收入(2024 年);图 22 印度 UPS 市场,按 UPS 类型划分,复合年增长率 (%)。图 23 印度 UPS 市场份额(%),按 UPS 类型划分,2024 年;图24 印度 UPS 市场份额(%),按 UPS 类型划分,2033 年;图 25 印度 UPS 市场,按功率容量划分,复合年增长率(%),2025-2033 年;图 26 印度 UPS 市场份额(%),按功率容量划分,2024 年;图 27 印度 UPS 市场份额(%),按功率容量划分,2033 年;图 28 印度 UPS 市场,按相型划分,复合年增长率(%),2025-2033 年;图 29 印度 UPS 市场份额(%),按相型划分,2024 年;图 30 印度 UPS 市场份额(%),按相型划分,2033 年;图 31 印度 UPS 市场,按电池类型划分,复合年增长率(%),2025-2033 年;图 32 印度 UPS 市场份额(%),按电池类型划分,2024 年。图33 印度UPS市场份额(%),按电池类型划分,2033年图34 印度UPS市场,按地区划分,复合年增长率(%),2025-2033年图35 印度UPS市场份额(%),按地区划分,2024年图36 印度UPS市场份额(%),按地区划分,2033年图37 印度UPS市场,按最终用户划分,复合年增长率(%),2025-2033年图38 印度UPS市场份额(%),按最终用户划分,2024年图39 印度UPS市场份额(%),按最终用户划分,2033年图40 印度UPS市场,按分销渠道划分,复合年增长率(%),2025-2033年图41 印度UPS市场份额(%),按分销渠道划分,2024年图42 印度UPS市场份额(%),按分销渠道划分,2033年图43 ABB有限公司:业务领域细分图 44 ABB 有限公司: 2024 年地域收入细分;图 45 Cyber Power Systems 公司:2024 年业务领域细分;图 46 Cyber Power Systems 公司:2024 年地域收入细分;图 47 台达电子股份有限公司:2024 年业务领域细分;图 48 台达电子股份有限公司:2024 年地域收入细分;图 49 伊顿公司:2024 年业务领域细分;图 50 伊顿公司:2024 年地域收入细分;图 51 艾默生电气公司:2024 年业务领域细分;图 52 艾默生电气公司: 2024 年地域收入细分;图 53 EnerSys:2024 年业务领域细分;图 54 日立公司:2024 年地域收入细分。图 55 日立有限公司:业务领域细分,2024 年;图 56 日立有限公司:地域收入细分,2024 年;图 57罗格朗集团:地域收入细分,2024 年;图 58 鲁米诺斯电力科技:业务领域细分,2024 年;图 59 鲁米诺斯电力科技:地域收入细分,2024 年;图 60 三菱电机株式会社:业务领域细分,2024 年;图 61三菱电机株式会社:地域收入细分,2024 年;图 62 纽瑞克电力系统:地域收入细分,2024 年;图 63施耐德电气:业务领域细分,2024 年;图 64 施耐德电气:地域收入细分,2024 年;图 65 东芝公司:业务领域细分,2024 年。图 65 东芝公司: 2024 年地域收入细分;图 66 附录:印度宏观经济展望/指标;图 67 附录:印度宏观经济展望/指标


特征 | 许可证类型 | ||||
数据手册 | 单用户 |   多用户 | 公司的 | ||
| 电子访问 | ✓ | ✓ | ✓ | ✓ | |
用户共享 | 仅限1位用户 | 仅限1位用户 | 最多 7 位用户 | 无限制用户访问 | |
打印 | ⨉ | ⨉ | ⨉ | ✓ | |
免费定制 | 不提供免费定制服务 | 最多工作30小时 | 最多工作 60 小时 | 最多工作80小时 | |
交付物 |
| ⨉ | ✓ | ✓ | ✓ |
| ✓ | ⨉ | ✓ | ✓ | |
| ⨉ | ⨉ | ⨉ | ✓ | |
分析支持 | 2 个月分析师支持 | 4个月分析师支持 | 7 个月分析师支持 | 一年分析师支持 | |
免费报告更新即将发布 更新周期 | ⨉ | ⨉ | ⨉ | ✓ | |
免费行业动态 (180天内) | ⨉ | ⨉ | ⨉ | ✓ | |
益处 | 购买后最高可享 10% 折扣 | 购买后最高可享20%折扣 | 购买后最高可享30%折扣 | 购买后最高可享 40% 折扣 | |