Japan Insurance Market: By Type (Life (Term Life Insurance, Whole Life Insurance, Unit Linked Insurance Plans, Endowment Plans, Annuities, Others), Non-Life (Health Insurance, Fire Insurance, Accident Insurance, Marine Insurance, Motor Insurance, Automobile Insurance, Travel Insurance, Property Insurance, Others); Duration (Short Term and Long Term); End Users (Individual and Commercial); Distribution Channel (Offline and Online); Country—Market Size, Industry Dynamics, Opportunity Analysis and Forecast for 2025–2033
- 最后更新时间:2025年5月8日 | | 报告编号:AA05251301
表1 行业展望:有效保单数量概览
表2 PESTLE影响分析:政治因素
表3 PESTLE影响分析:经济因素
表4 PESTLE影响分析:社会因素
表5 PESTLE影响分析:技术因素
表6 PESTLE影响分析:法律因素
表7 PESTLE影响分析:环境因素
表8 日本保险市场规模(亿美元),按类型划分,2020-2033年
表9 日本保险市场规模(亿美元),按期限划分,2020-2033年
表10 日本保险市场规模(亿美元),按最终用户划分,2020-2033年
表11 日本保险市场规模(亿美元),按分销渠道划分,2020-2033年
表12 永旺安联人寿保险有限公司:近期发展
表13 永旺安联人寿保险有限公司:产品/服务
表14 朝日互惠人寿保险公司:近期发展情况
表15 朝日互惠人寿保险公司:发行情况
表16 朝日互惠人寿保险公司:财务分析
表17 日本生命保险公司:近期发展情况
表18 日本生命保险公司:发行情况
表19 日本邮政保险株式会社:近期发展情况
表20 日本邮政保险株式会社:发行情况
表21 日本邮政保险株式会社:财务分析
表22 第一生命控股株式会社:近期发展情况
表23 第一生命控股株式会社:发行情况
表24 第一生命控股株式会社:财务分析
表25 明治安田生命保险公司:近期发展情况
表26 明治安田生命保险公司:发行情况
表27 明治安田生命保险公司:财务分析
表28 丘博保险:近期发展情况
表29 丘博保险:发行情况
表30保险:财务分析
表 31 住友生命:近期发展
表 32 住友生命:财务分析
表 33 东京海上控股:近期发展
表 34 东京海上控股:发行
表 35 东京海上控股:财务分析
表 36 Sompo Holdings:近期发展
表 37 Sompo Holdings:发行
表 38 Sompo Holdings:财务分析
表 39 法国巴黎银行卡迪夫:近期发展
表 40 法国巴黎银行卡迪夫:发行
表 41 法国巴黎银行(母公司):财务分析
表 42 法国农业信贷生命保险(日本)有限公司:发行
表 43 法国农业信贷生命保险(日本)有限公司:财务分析
表 44 大同生命保险公司:近期发展
表 45 大同生命保险公司:发行
表 46 T&D Holdings(母公司):财务分析
表 47 Aflac:发行
表 48 Aflac Incorporated (母公司):财务分析
表 49 福国互助生命保险公司:发行
表 50 福国互助生命保险公司:财务分析
表 51 太阳生命保险公司:近期发展
表 52 太阳生命保险公司:发行
表 53 T&D控股(母公司):财务分析
表 54 索尼生命保险株式会社:近期发展
表 55 索尼生命保险株式会社:发行
表 56 索尼集团株式会社(母公司):财务分析
表 57 Lifenet保险公司:发行
表 58 Lifenet保险公司:财务分析
表 59 Medicare生命保险株式会社:发行
表 60 MS & AD保险集团:近期发展
表 61 MS & AD保险集团:发行
表 62 MS & AD保险集团:财务分析
表 63 其他主要参与者
表 64 附录:二手资料
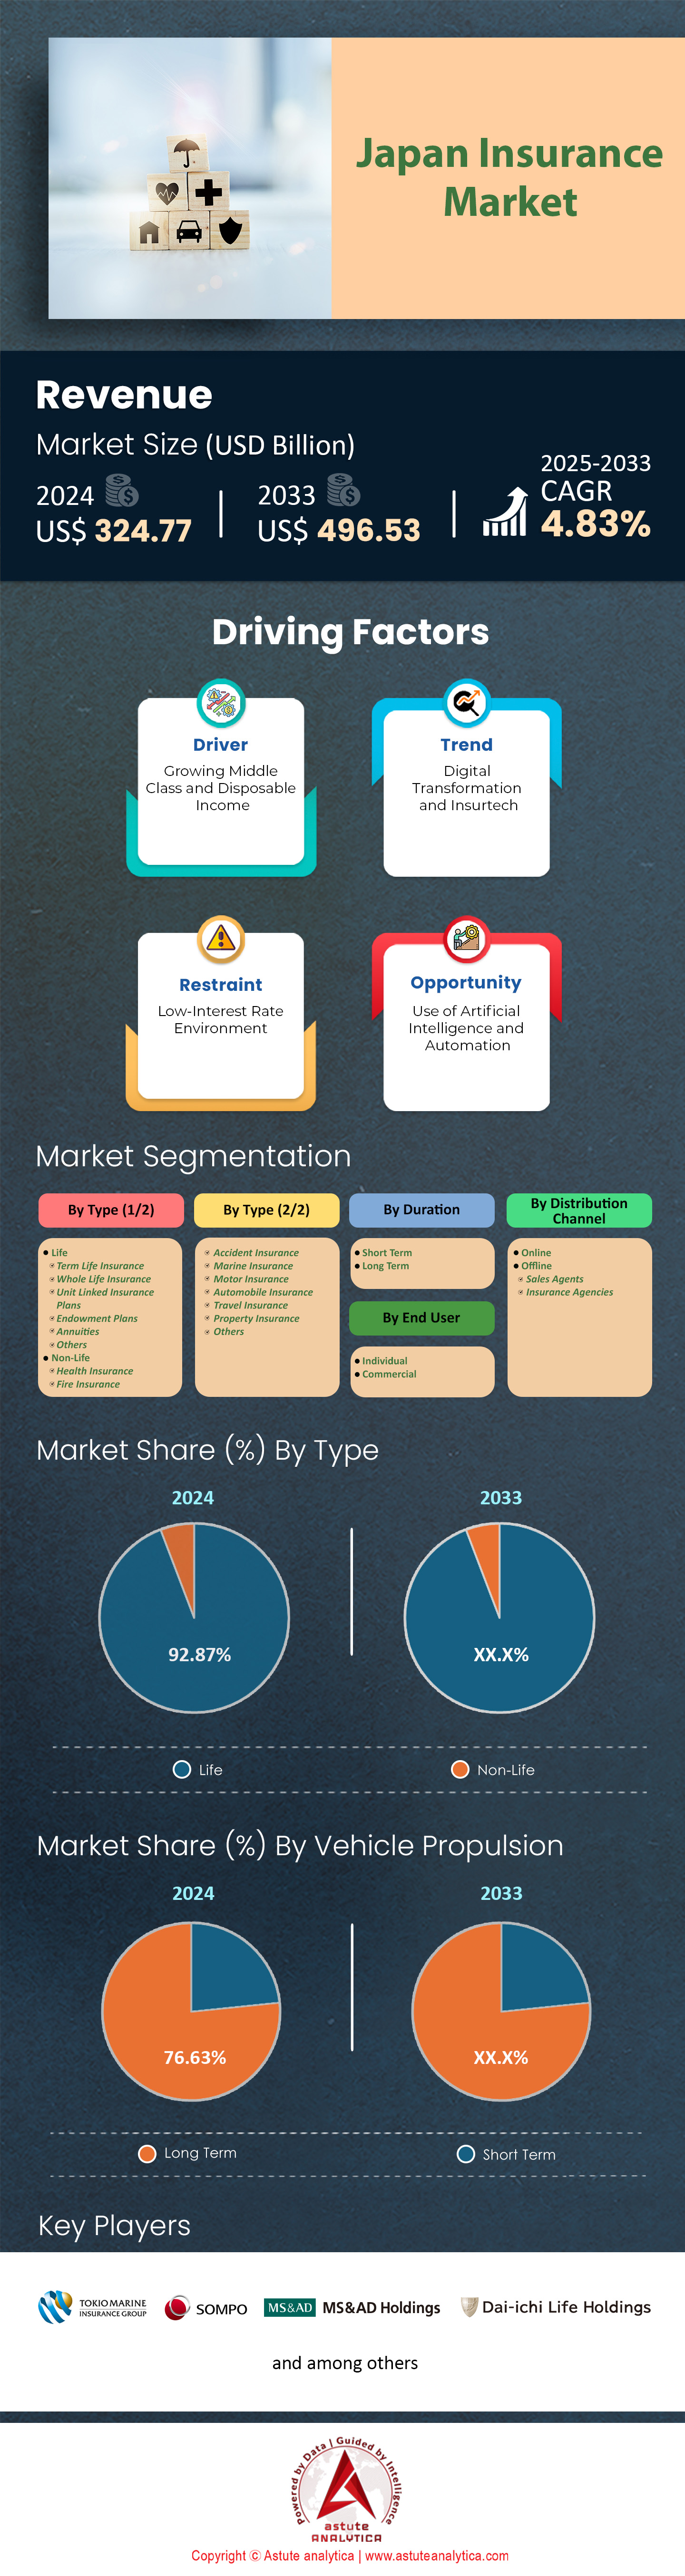
图 1 执行摘要:日本保险市场规模及预测,2020-2033 年(十亿美元)
图 2 主要细分市场,复合年增长率 (%) (2025-2033 年)
图 3 行业展望:有效个人保险单数量
图 4 行业展望:有效个人保险单金额
图 5 行业展望:有效保单金额
图 6 采用率分析:按类型划分的采用率 (%)
图 7 采用率分析:按期限划分的收入比较(十亿美元)
图 8 驱动因素:日本 65 岁及以上人口占总人口的百分比
图 9 驱动因素:日本个人可支配收入 – 千美元 – 2024 年月度
图 10 趋势:日本智能手机用户 – 百万
图 11 竞争格局:按公司收入划分的市场份额分析 (2024 年)
图 12 日本保险市场,按类型划分,复合年增长率 (%),2024-2033 年
图 13 日本
图14 日本
保险市场份额(%),按类型划分,2024年;图15 日本保险市场份额(%),按类型划分,2033年;图16 日本保险市场,按期限划分,复合年增长率(%),2024-2033年;
图17
日本保险市场份额(%),按期限图18 日本保险市场,按期限划分,复合年增长率(%),2024-2033年;
图19 日本保险市场份额(%),按最终用户划分,复合年增长率(%),2024年;
图20 日本保险市场份额(%),按最终用户划分,2033年;
图21 日本保险市场,按分销渠道划分,复合年增长率(%),2024-2033年;
图22 日本保险市场份额(%),按分销渠道划分,2024年;
图23 日本保险市场份额(%),按分销渠道划分,2033年;
图24 朝日互惠人寿
图 25 第一生命控股株式会社:
2024 年业务收入细分图 26 丘博保险:
图 27 东京海上控股:2024 年业务收入细分 图 28 Sompo 控股:2024 年业务收入细分
法国巴黎银行卡迪夫:
2024 年业务收入细分法国农业信贷生命保险(日本)有限公司:2024 年业务收入细分
图 31 法国农业信贷生命保险(日本)有限公司:2024 年地域收入细分
图 32 大同生命保险公司:2024 年业务收入细分
图 33 美国福祉保险公司:2024 年业务收入细分
图 34 太阳生命保险公司:2024 年业务收入
图35 索尼生命保险株式会社:
2024年图36 索尼生命保险株式会社:2024年地域收入细分
图37 MS & AD保险集团:2024年业务收入细分
图38 附录:二手资料
图39 附录:GDP,现价(十亿美元)
图40 附录:人均GDP,现价(美元/人)
图41 附录:按年龄组划分的人口(千人)
图42 附录:互联网用户占其年龄组的百分比
图43 附录:日本企业技术进出口趋势(美元)
图44 附录:软件支出占GDP的百分比


特征 | 许可证类型 | ||||
数据手册 | 单用户 |   多用户 | 公司的 | ||
| 电子访问 | ✓ | ✓ | ✓ | ✓ | |
用户分享 | 仅限 1 个用户 | 仅限 1 个用户 | 最多 7 个用户 | 无限制的用户访问 | |
打印 | ⨉ | ⨉ | ⨉ | ✓ | |
免费定制 | 没有免费定制 | 长达 30 小时的工作时间 | 工作时间长达 60 小时 | 工作时间长达 80 小时 | |
交付 |
| ⨉ | ✓ | ✓ | ✓ |
| ✓ | ⨉ | ✓ | ✓ | |
| ⨉ | ⨉ | ⨉ | ✓ | |
分析师支持 | 2 个月分析师支持 | 4 个月分析师支持 | 7 个月分析师支持 | 一年分析师支持 | |
下次免费报告更新 更新周期 | ⨉ | ⨉ | ⨉ | ✓ | |
免费行业更新 (180天内) | ⨉ | ⨉ | ⨉ | ✓ | |
益处 | 购买后最高可享受 10% 折扣 | 购买后高达 20% 折扣 | 购买后高达 30% 折扣 | 购买后高达 40% 折扣 | |