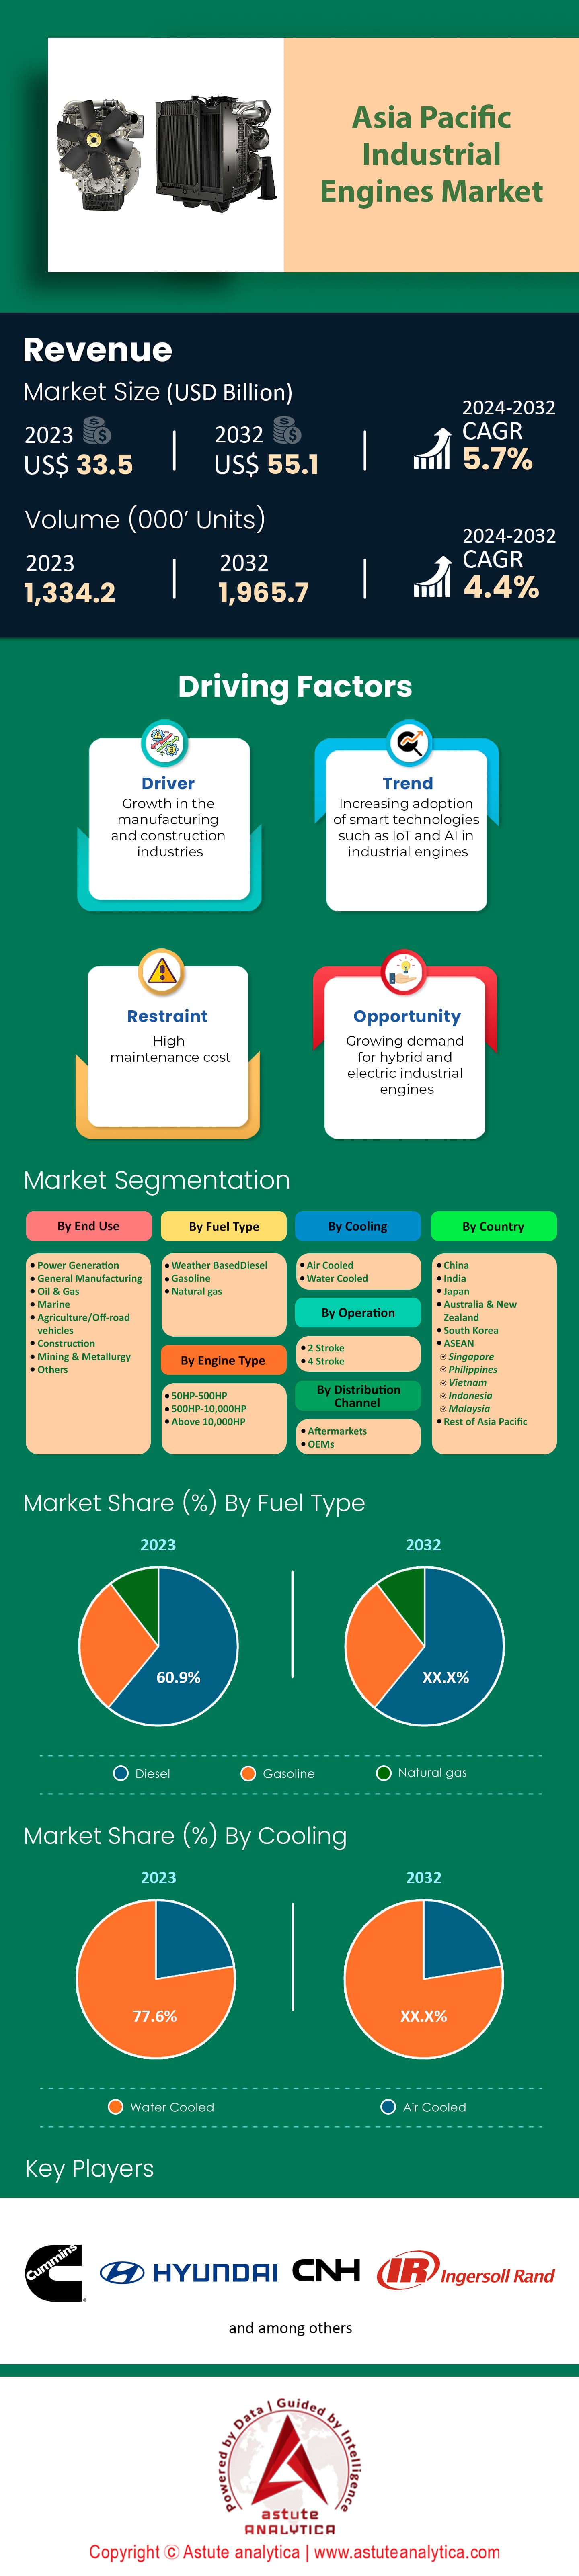
Markt für Industriemotoren im asiatisch-pazifischen Raum: Nach Kraftstoffart (wetterbasierter Diesel, Benzin und Erdgas); Motortyp (50–500 PS, 500–10.000 PS, über 10.000 PS); Kühlung (luftgekühlt und wassergekühlt); Betriebsart (2-Takt und 4-Takt); Vertriebskanal (Ersatzteilmarkt und Erstausrüster); Endverwendung (Energieerzeugung, allgemeine Fertigung, Öl und Gas, Schifffahrt, Landwirtschaft/Geländefahrzeuge, Bauwesen, Bergbau und Metallurgie und Sonstige) – Marktgröße, Branchendynamik, Chancenanalyse und Prognose für 2024–2032
- Letzte Aktualisierung: 23. Juli 2024 | | Bericht-ID: AA0423390
Tabelle 1: Markt für Industriemotoren im asiatisch-pazifischen Raum: Wirkungsanalyse der Marktdynamik
Tabelle 2: Preisanalyse nach Kraftstoffart (Durchschnittspreise in US-Dollar)
Tabelle 3: Wettbewerbsanalyse und Benchmarking der Industriemotoren im asiatisch-pazifischen Raum
Tabelle 4: Marktgröße für Industriemotoren im asiatisch-pazifischen Raum (Mrd. US-Dollar) nach Kraftstoffart, 2019–2032
Tabelle 5: Marktgröße für Industriemotoren im asiatisch-pazifischen Raum (Tsd. Einheiten) nach Kraftstoffart, 2019–2032
Tabelle 6: Marktgröße für Industriemotoren im asiatisch-pazifischen Raum (Mrd. US-Dollar) nach Motortyp, 2019–2032
Tabelle 7: Marktgröße für Industriemotoren im asiatisch-pazifischen Raum (Tsd. Einheiten) nach Motortyp, 2019–2032
Tabelle 8: Marktgröße für Industriemotoren im asiatisch-pazifischen Raum (Mrd. US-Dollar) nach Kühlung, 2019–2032
Tabelle 9: Marktgröße für Industriemotoren im asiatisch-pazifischen Raum (Tsd. Einheiten) nach Kühlung, 2019–2032
Tabelle 10: Marktgröße für Industriemotoren im asiatisch-pazifischen Raum (Mrd. US$), nach Betriebsart 2019–2032;
Tabelle 11: Marktgröße für Industriemotoren im asiatisch-pazifischen Raum (Tsd. Einheiten), nach Betriebsart 2019–2032;
Tabelle 12: Marktgröße für Industriemotoren im asiatisch-pazifischen Raum (Mrd. US$), nach Vertriebskanal 2019–2032;
Tabelle 13: Marktgröße für Industriemotoren im asiatisch-pazifischen Raum (Tsd. Einheiten), nach Vertriebskanal 2019–2032;
Tabelle 14: Marktgröße für Industriemotoren im asiatisch-pazifischen Raum (Mrd. US$), nach Endverwendung 2019–2032
; Tabelle 15: Marktgröße für Industriemotoren im asiatisch-pazifischen Raum (Tsd. Einheiten), nach Endverwendung 2019–2032
; Tabelle 16: Marktgröße für Industriemotoren im asiatisch-pazifischen Raum (Mrd. US$), nach Land 2019–2032;
Tabelle 17: Marktgröße für Industriemotoren im asiatisch-pazifischen Raum (Tsd. Einheiten), nach Land
Tabelle 18: Markt für Industriemotoren in China: Wirkungsanalyse – Diagramm
Tabelle 19: Marktgröße für Industriemotoren in China (Mrd. US$), nach Kraftstoffart, 2019–2032
Tabelle 20: Marktgröße für Industriemotoren in China (Tsd. Einheiten), nach Kraftstoffart, 2019–2032
Tabelle 21: Marktgröße für Industriemotoren in China (Mrd. US$), nach Motortyp, 2019–2032 Tabelle 22
: Marktgröße für Industriemotoren in China (Tsd. Einheiten), nach Motortyp, 2019–2032
Tabelle 23: Marktgröße für Industriemotoren in China (Mrd. US$), nach Kühlung, 2019–2032
Tabelle 24: Marktgröße für Industriemotoren in China (Tsd. Einheiten), nach Kühlung, 2019–2032
Tabelle 25: Marktgröße für Industriemotoren in China (Mrd. US$), nach Betriebsart, 2019–2032
Tabelle 26: Marktgröße für Industriemotoren in China
Tabelle 27: Marktgröße für Industriemotoren in China (
Mrd. US$), nach Vertriebskanal, 2019–2032; Tabelle 28: Marktgröße für Industriemotoren in China (Mrd. US$), nach Vertriebskanal, 2019–2032; Tabelle 29: Marktgröße für Industriemotoren in
China (Mrd. US$), nach Endverwendung
; Tabelle 30: Marktgröße für Industriemotoren in China (Mrd. US$), nach Endverwendung, 2019–2032;
Tabelle 31: Markt für Industriemotoren in Indien: Wirkungsanalyse – Diagramm
; Tabelle 32: Marktgröße für Industriemotoren in Indien (Mrd. US$), nach Kraftstoffart,
; Tabelle 33: Marktgröße für Industriemotoren in Indien (Mrd. US$), nach Kraftstoffart, 2019–2032;
Tabelle 34: Marktgröße für Industriemotoren in Indien (Mrd. US$), nach Motorentyp
35 : Marktgröße für Industriemotoren in Indien (Tsd. Einheiten) nach Motortyp;
Tabelle 36: Marktgröße für Industriemotoren in Indien (Mrd. US$) nach Kühlung;
Tabelle 37: Marktgröße für Industriemotoren in Indien (Tsd. Einheiten) nach Kühlung;
Tabelle 38: Marktgröße für Industriemotoren in Indien (Mrd. US$) nach Betriebsart;
Tabelle 39: Marktgröße für Industriemotoren in Indien (Tsd. Einheiten) nach Betriebsart;
Tabelle 40: Marktgröße für Industriemotoren in Indien (Mrd. US$) nach Vertriebskanal;
Tabelle 41: Marktgröße für Industriemotoren in Indien (Tsd. Einheiten) nach Vertriebskanal;
Tabelle 42: Marktgröße für Industriemotoren in Indien (Mrd. US$) nach … Endverwendung 2019–2032
Tabelle 43: Marktgröße für Industriemotoren in Indien (Tsd. Einheiten) nach Endverwendung 2019–2032
Tabelle 44: Markt für Industriemotoren in Japan: Wirkungsanalyse – Diagramm
Tabelle 45: Marktgröße für Industriemotoren in Japan (Mrd. US$) nach Kraftstoffart 2019–2032
Tabelle 46: Marktgröße für Industriemotoren in Japan (Tsd. Einheiten) nach Kraftstoffart 2019–2032
Tabelle 47: Marktgröße für Industriemotoren in Japan (Mrd. US$) nach Motortyp 2019–2032
Tabelle 48: Marktgröße für Industriemotoren in Japan (Tsd. Einheiten) nach Motortyp 2019–2032
Tabelle 49: Marktgröße für Industriemotoren in Japan (Mrd. US$) nach Kühlung 2019–2032
Tabelle 50: Marktgröße für Industriemotoren in Japan (Tsd. Einheiten) nach Kühlung 2019–2032
Tabelle 51: Japanische Industrie Marktgröße für Motoren (Mrd. US$), nach Betriebsart 2019–2032
Tabelle 52: Marktgröße für Industriemotoren in Japan (Tsd. Einheiten), nach Betriebsart 2019–2032
Tabelle 53: Marktgröße für Industriemotoren in Japan (Mrd. US$), nach Vertriebskanal 2019–2032
Tabelle 54: Marktgröße für Industriemotoren in Japan (Tsd. Einheiten), nach Vertriebskanal 2019–2032
Tabelle 55: Marktgröße für Industriemotoren in Japan (Mrd. US$), nach Endverwendung 2019–2032
Tabelle 56: Marktgröße für Industriemotoren in Japan (Tsd. Einheiten), nach Endverwendung 2019–2032
Tabelle 57: Markt für Industriemotoren in Australien und Neuseeland: Wirkungsanalyse – Diagramm
Tabelle 58: Marktgröße für Industriemotoren in Australien und Neuseeland (Mrd. US$), nach Kraftstoffart 2019–2032
Tabelle 59: Marktgröße für Industriemotoren in Australien und Neuseeland (Tsd. Einheiten), nach Kraftstoffart, 2019–2032
Tabelle:60 Marktgröße für Industriemotoren in Australien und Neuseeland (Mrd. US$), nach Motortyp 2019–2032
Tabelle:61 Marktgröße für Industriemotoren in Australien und Neuseeland (Tsd. Einheiten), nach Motortyp 2019–2032
Tabelle:62 Marktgröße für Industriemotoren in Australien und Neuseeland (Mrd. US$), nach Kühlung 2019–2032
Tabelle:63 Marktgröße für Industriemotoren in Australien und Neuseeland (Tsd. Einheiten), nach Kühlung 2019–2032
Tabelle:64 Marktgröße für Industriemotoren in Australien und Neuseeland (Mrd. US$), nach Betriebsart 2019–2032
Tabelle:65 Marktgröße für Industriemotoren in Australien und Neuseeland (Tsd. Einheiten), nach Betriebsart 2019–2032
Tabelle:66 Marktgröße für Industriemotoren in Australien und Neuseeland (Mrd. US$), nach Vertriebskanal, 2019–2032
Tabelle 67: Marktgröße für Industriemotoren in Australien und Neuseeland (Tsd. Einheiten), nach Vertriebskanal, 2019–2032
Tabelle 68: Marktgröße für Industriemotoren in Australien und Neuseeland (Mrd. US$), nach Endverwendung, 2019–2032
Tabelle 69: Marktgröße für Industriemotoren in Australien und Neuseeland (Tsd. Einheiten), nach Endverwendung, 2019–2032
Tabelle 70: Markt für Industriemotoren in Südkorea: Wirkungsanalyse – Diagramm
Tabelle 71: Marktgröße für Industriemotoren in Südkorea (Mrd. US$), nach Kraftstoffart, 2019–2032
Tabelle 72: Marktgröße für Industriemotoren in Südkorea (Tsd. Einheiten), nach Kraftstoffart, 2019–2032
Tabelle 73: Marktgröße für Industriemotoren in Südkorea (Mrd. US$), nach Motortyp, 2019–2032
Tabelle 74: Markt für Industriemotoren in Südkorea Marktgröße (Tsd. Einheiten) nach Motortyp 2019–2032
Tabelle 75: Südkoreas Marktgröße für Industriemotoren (Mrd. US$) nach Kühlung 2019–2032
Tabelle 76: Südkoreas Marktgröße für Industriemotoren (Tsd. Einheiten) nach Kühlung 2019–2032
Tabelle 77: Südkoreas Marktgröße für Industriemotoren (Mrd. US$) nach Betriebsart 2019–2032
Tabelle 78: Südkoreas Marktgröße für Industriemotoren (Tsd. Einheiten) nach Betriebsart 2019–2032
Tabelle 79: Südkoreas Marktgröße für Industriemotoren (Mrd. US$) nach Vertriebskanal 2019–2032
Tabelle 80: Südkoreas Marktgröße für Industriemotoren (Tsd. Einheiten) nach Vertriebskanal 2019–2032
Tabelle 81: Südkoreas Marktgröße für Industriemotoren (Mrd. US$) nach Endverwendung 2019–2032
Tabelle 82: Südkoreas Industrie Marktgröße für Industriemotoren in ASEAN (Tsd. Einheiten), nach Endverwendung 2019–2032
Tabelle 83: ASEAN-Industriemotorenmarkt: Wirkungsanalyse – Diagramm
Tabelle 84: Marktgröße für Industriemotoren in ASEAN (Mrd. US$), nach Kraftstoffart, 2019–2032
Tabelle 85: Marktgröße für Industriemotoren in ASEAN (Tsd. Einheiten), nach Kraftstoffart, 2019–2032
Tabelle 86: Marktgröße für Industriemotoren in ASEAN (Mrd. US$), nach Motortyp 2019–2032
Tabelle 87: Marktgröße für Industriemotoren in ASEAN (Tsd. Einheiten), nach Motortyp 2019–2032
Tabelle 88: Marktgröße für Industriemotoren in ASEAN (Mrd. US$), nach Kühlung 2019–2032
Tabelle 89: Marktgröße für Industriemotoren in ASEAN (Tsd. Einheiten), nach Kühlung 2019–2032
Tabelle 90: Marktgröße für Industriemotoren in ASEAN (Mrd. US$), nach
Tabelle 91: Marktgröße für Industriemotoren in ASEAN (Tsd. Einheiten), nach
Betriebsart 2019–2032; Tabelle 92: Marktgröße für Industriemotoren in ASEAN (Mrd. US$), nach Vertriebskanal 2019–2032;
Tabelle 93: Marktgröße für Industriemotoren in ASEAN (Tsd. Einheiten), nach Vertriebskanal 2019–2032;
Tabelle 94: Marktgröße für Industriemotoren in ASEAN (Mrd. US$), nach Endverwendung 2019–2032;
Tabelle 95: Marktgröße für Industriemotoren in ASEAN (Tsd. Einheiten), nach Endverwendung 2019–2032;
Tabelle 96: Markt für Industriemotoren in Singapur: Wirkungsanalyse – Diagramm
; Tabelle 97: Marktgröße für Industriemotoren in Singapur (Mrd. US$), nach Kraftstoffart 2019–2032;
Tabelle 98: Marktgröße für Industriemotoren in Singapur (Tsd. Einheiten), nach Kraftstoffart
99 : Marktgröße für Industriemotoren in Singapur (Mrd. US$), nach Motortyp;
Tabelle 100: Marktgröße für Industriemotoren in Singapur (Tsd. Einheiten), nach Motortyp;
Tabelle 101: Marktgröße für Industriemotoren in Singapur (Mrd. US$), nach Kühlung;
Tabelle 102: Marktgröße für Industriemotoren in Singapur (Tsd. Einheiten), nach Kühlung;
Tabelle 103: Marktgröße für Industriemotoren in Singapur (Mrd. US$), nach Betriebsart;
Tabelle 104: Marktgröße für Industriemotoren in Singapur (Tsd. Einheiten), nach Betriebsart;
Tabelle 105: Marktgröße für Industriemotoren in Singapur (Mrd. US$), nach Vertriebskanal
Tabelle 106: Marktgröße für Industriemotoren in Singapur (in Tsd. Einheiten), nach Vertriebskanal, 2019–2032;
Tabelle 107: Marktgröße für Industriemotoren in Singapur (in Mrd. US-Dollar), nach Endverwendung, 2019–2032;
Tabelle 108: Marktgröße für Industriemotoren in Singapur (in Tsd. Einheiten), nach Endverwendung, 2019–2032;
Tabelle 109: Markt für Industriemotoren auf den Philippinen: Wirkungsanalyse – Diagramm
; Tabelle 110: Marktgröße für Industriemotoren auf den Philippinen (in Mrd. US-Dollar), nach Kraftstoffart, 2019–2032;
Tabelle 111: Marktgröße für Industriemotoren auf den Philippinen (in Tsd. Einheiten), nach Kraftstoffart, 2019–2032; Tabelle
112: Marktgröße für Industriemotoren auf den Philippinen (in Mrd. US-Dollar), nach Motorentyp, 2019–2032;
Tabelle 113: Marktgröße für Industriemotoren auf den Philippinen (in Tsd. Einheiten), nach Motorentyp
114 : Marktgröße für Industriemotoren auf den Philippinen (Mrd. US$), nach Kühlungsart;
Tabelle 115: Marktgröße für Industriemotoren auf den Philippinen (Tsd. Einheiten), nach Kühlungsart;
Tabelle 116: Marktgröße für Industriemotoren auf den Philippinen (Mrd. US$), nach Betriebsart;
Tabelle 117: Marktgröße für Industriemotoren auf den Philippinen (Tsd. Einheiten), nach Betriebsart;
Tabelle 118: Marktgröße für Industriemotoren auf den Philippinen (Mrd. US$), nach Vertriebskanal;
Tabelle 119: Marktgröße für Industriemotoren auf den Philippinen (Tsd. Einheiten), nach Vertriebskanal;
Tabelle 120: Marktgröße für Industriemotoren auf den Philippinen (Mrd. US$), nach Endverwendung
Tabelle 121: Marktgröße für Industriemotoren auf den Philippinen (in Tsd. Einheiten), nach Endverwendung 2019–2032;
Tabelle 122: Markt für Industriemotoren in Vietnam: Wirkungsanalyse – Diagramm
; Tabelle 123: Marktgröße für Industriemotoren in Vietnam (in Mrd. US-Dollar), nach Kraftstoffart, 2019–2032;
Tabelle 124: Marktgröße für Industriemotoren in Vietnam (in Tsd. Einheiten), nach Kraftstoffart, 2019–2032;
Tabelle 125: Marktgröße für Industriemotoren in Vietnam (in Mrd. US-Dollar), nach Motortyp 2019–2032;
Tabelle 126: Marktgröße für Industriemotoren in Vietnam (in Tsd. Einheiten), nach Motortyp 2019–2032
; Tabelle 127: Marktgröße für Industriemotoren in Vietnam (in Mrd. US-Dollar), nach Kühlung 2019–2032;
Tabelle 128: Marktgröße für Industriemotoren in Vietnam (in Tsd. Einheiten), nach Kühlung
129 : Marktgröße für Industriemotoren in Vietnam (Mrd. US$), nach Betriebsart;
Tabelle 130: Marktgröße für Industriemotoren in Vietnam (Tsd. Einheiten), nach Betriebsart;
Tabelle 131: Marktgröße für Industriemotoren in Vietnam (Mrd. US$), nach Vertriebskanal;
Tabelle 132: Marktgröße für Industriemotoren in Vietnam (Tsd. Einheiten), nach Vertriebskanal;
Tabelle 133: Marktgröße für Industriemotoren in Vietnam (Mrd. US$), nach Endverwendung;
Tabelle 134: Marktgröße für Industriemotoren in Vietnam (Tsd. Einheiten), nach Endverwendung;
Tabelle 135: Markt für Industriemotoren in Indonesien: Wirkungsanalyse – Diagramm;
Tabelle 136: Marktgröße für Industriemotoren in Indonesien (Mrd. US$), nach Kraftstoffart
Tabelle 137: Marktgröße für Industriemotoren in Indonesien (in Tsd. Einheiten), nach Kraftstoffart,
2019–2032; Tabelle 138: Marktgröße für Industriemotoren in Indonesien (in Mrd. US$), nach Motortyp, 2019–2032;
Tabelle 139: Marktgröße für Industriemotoren in Indonesien (in Tsd. Einheiten), nach Motortyp, 2019–2032
; Tabelle 140: Marktgröße für Industriemotoren in Indonesien (in Mrd. US$), nach Kühlung, 2019–2032;
Tabelle 141: Marktgröße für Industriemotoren in Indonesien (in Tsd. Einheiten), nach Kühlung, 2019–2032;
Tabelle 142: Marktgröße für Industriemotoren in Indonesien (in Mrd. US$), nach Betriebsart, 2019–2032;
Tabelle 143: Marktgröße für Industriemotoren in Indonesien (in Tsd. Einheiten), nach Betriebsart, 2019–2032
Tabelle 144: Marktgröße für Industriemotoren in Indonesien (Mrd. US$), nach Vertriebskanal, 2019–2032;
Tabelle 145: Marktgröße für Industriemotoren in Indonesien (Tsd. Einheiten), nach Vertriebskanal, 2019–2032
; Tabelle 146: Marktgröße für Industriemotoren in Indonesien (Mrd. US$), nach Endverwendung, 2019–2032
; Tabelle 147: Marktgröße für Industriemotoren in Indonesien (Tsd. Einheiten), nach Endverwendung, 2019–2032;
Tabelle 148: Markt für Industriemotoren in Malaysia: Wirkungsanalyse – Diagramm
149: Marktgröße für Industriemotoren in Malaysia (Mrd. US$), nach Kraftstoffart, 2019–2032
; Tabelle 150: Marktgröße für Industriemotoren in Malaysia (Tsd. Einheiten), nach Kraftstoffart, 2019–2032;
Tabelle 151: Marktgröße für Industriemotoren in Malaysia (Mrd. US$), nach Motorentyp
152 : Marktgröße für Industriemotoren in Malaysia (Tsd. Einheiten) nach Motortyp (2019–2032)
; Tabelle 153: Marktgröße für Industriemotoren in Malaysia (Mrd. US$) nach Kühlung (2019–2032)
; Tabelle 154: Marktgröße für Industriemotoren in Malaysia (Tsd. Einheiten) nach Kühlung (2019–2032)
; Tabelle 155: Marktgröße für Industriemotoren in Malaysia (Mrd. US$) nach Betriebsart (2019–2032)
; Tabelle 156: Marktgröße für Industriemotoren in Malaysia (Tsd. Einheiten) nach Betriebsart (2019–2032
); Tabelle 157: Marktgröße für Industriemotoren in Malaysia (Mrd. US$) nach Vertriebskanal (2019–2032)
; Tabelle 158: Marktgröße für Industriemotoren in Malaysia (Tsd. Einheiten) nach Vertriebskanal (2019–2032)
Tabelle 159: Marktgröße für Industriemotoren in Malaysia (Mrd. US$), nach Endverwendung 2019–2032;
Tabelle 160: Marktgröße für Industriemotoren in Malaysia (Tsd. Einheiten), nach Endverwendung 2019–2032;
Tabelle 161: Markt für Industriemotoren im übrigen Asien-Pazifik-Raum: Wirkungsanalyse – Diagramm
; Tabelle 162: Marktgröße für Industriemotoren im übrigen Asien-Pazifik-Raum (Mrd. US$), nach Kraftstoffart 2019–2032;
Tabelle 163: Marktgröße für Industriemotoren im übrigen Asien-Pazifik-Raum (Tsd. Einheiten), nach Kraftstoffart 2019–2032
; Tabelle 164: Marktgröße für Industriemotoren im übrigen Asien-Pazifik-Raum (Mrd. US$), nach Motortyp 2019–2032;
Tabelle 165: Marktgröße für Industriemotoren im übrigen Asien-Pazifik-Raum (Tsd. Einheiten), nach Motortyp 2019–2032;
Tabelle 166: Marktgröße für Industriemotoren im übrigen Asien-Pazifik-Raum (Mrd. US$)
Marktgröße für Industriemotoren im übrigen Asien-Pazifik (in Tsd. Einheiten
), nach Kühlung 2019–2032 Marktgröße für Industriemotoren im übrigen Asien-Pazifik (in Tsd. Einheiten), nach Kühlung 2019–2032 Tabelle:168 Marktgröße für Industriemotoren
im übrigen Asien-Pazifik (in Mrd. US$), nach Betriebsart 2019–2032 Tabelle:169 Marktgröße für Industriemotoren im übrigen Asien-Pazifik (in
), nach Betriebsart 2019–2032 Tabelle:170 Marktgröße für Industriemotoren im übrigen Asien-Pazifik (in Mrd. US$), nach Vertriebskanal 2019–2032
Tabelle:171 Marktgröße für Industriemotoren im übrigen Asien-Pazifik (in Tsd. Einheiten), nach Vertriebskanal 2019–2032
Tabelle:172 Marktgröße für Industriemotoren im übrigen Asien-Pazifik (in Mrd. US$), nach Endverwendung 2019–2032
Tabelle:173 Marktgröße für Industriemotoren im übrigen Asien-Pazifik (in Tsd. Einheiten) Einheiten), nach Endverwendung 2019-2032
Tabelle:174Caterpillar Inc.: Aktuelle Entwicklungen
Tabelle:175Caterpillar Inc.: Produktmerkmale
Tabelle:176Caterpillar Inc.: Finanzanalyse
Tabelle:177Changchai Co., Ltd.: Produktmerkmale
Tabelle:178Chongqing Fuchai Power Machinery Manufacturing Co., Ltd.: Produkte
Tabelle:179CNH Industrial NV: Aktuelle Entwicklungen
Tabelle:180CNH Industrial NV: Produktmerkmale
Tabelle:181CNH Industrial NV: Finanzanalyse
Tabelle:182Cummins Inc.: Aktuelle Entwicklungen
Tabelle:183Cummins Inc.: Produktmerkmale
Tabelle:184Cummins Inc.: Finanzanalyse
Tabelle:185DAIHATSU DIESEL MFG. CO., LTD.: Aktuelle Entwicklungen
Tabelle:186DAIHATSU DIESEL MFG. CO., LTD.: Produktmerkmale
Tabelle:187DAIHATSU DIESEL MFG. Fuzhou Launtop M&E Co., Ltd.: Tabelle 188: Finanzanalyse
; Fuzhou Launtop M&E Co., Ltd.:
Tabelle 189: Produktmerkmale; Honda Motor Co.,
Ltd.: Tabelle 190: Aktuelle Entwicklungen; Honda
Motor Co., Ltd.: Tabelle 191: Finanzanalyse
; Hyundai Motor Company:
Tabelle 192: Produktmerkmale; Hyundai Motor Company: Tabelle 193: Finanzanalyse;
Ingersoll Rand: Tabelle 194: Produktmerkmale
; Ingersoll Rand: Tabelle 195: Finanzanalyse;
Kohler Co.:
Tabelle 196: Aktuelle Entwicklungen; Kohler Co
.: Tabelle 197: Produktmerkmale; Jeemar
Power Co., Ltd.:
Tabelle 198: Produktmerkmale; Kawasaki Heavy Industries Limited:
Tabelle 200: Aktuelle Entwicklungen; Kawasaki Heavy Industries Limited: Tabelle 201: Finanzanalyse;
Kirloskar Group: Produktmerkmale
Tabelle 203: Kirloskar-Gruppe: Finanzanalyse
Tabelle 204: Lifan Power USA: Produktmerkmale
Tabelle 205: Loncin Motor Co., Ltd.: Produktmerkmale
Tabelle 206: Mitsubishi Electric Corporation: Aktuelle Entwicklungen
Tabelle 207: Mitsubishi Electric Corporation: Produktmerkmale
Tabelle 208: Mitsubishi Electric Corporation: Finanzanalyse
Tabelle 209: Motorenfabrik Hatz GmbH & Co. KG: Aktuelle Entwicklungen
Tabelle 210: Motorenfabrik Hatz GmbH & Co. KG: Produktmerkmale
Tabelle 211: Siemens Energy AG: Produktmerkmale
Tabelle 212: Siemens Energy AG: Finanzanalyse
Tabelle 213: Shanghai Diesel Engine Co., Ltd.: Produktmerkmale
Abbildung 1: Markt für Industriemotoren im asiatisch-pazifischen Raum, nach Umsatz (Mrd. US$)
Abbildung 2: Markt für Industriemotoren im asiatisch-pazifischen Raum, nach Produktionsmenge (Tsd. Einheiten)
Abbildung 3: Markt für Industriemotoren im asiatisch-
pazifischen Raum: Marktdurchdringungsrate (%), nach Kraftstoffart Abbildung 4: Markt für Industriemotoren im asiatisch-pazifischen Raum, jährliches Wachstum (%), 2019–2032
Abbildung 5: Markt für Industriemotoren im asiatisch-pazifischen Raum: Umsatzvergleich, nach Motortyp, in Mrd. US$
Abbildung 6: Markt für Industriemotoren im asiatisch-pazifischen Raum: Wachstum des Baugewerbes in Asien (Wachstumsrate %), 2014–2023
Abbildung 7: Markt für Industriemotoren im asiatisch-pazifischen Raum, Auswirkungen von Covid-19 und Erholung, 2019–2032, jährliches Wachstum (%)
Abbildung 8: Markt für Industriemotoren im asiatisch-pazifischen Raum: Marktkonzentration (2023)
Abbildung 9: Markt für Industriemotoren im asiatisch-pazifischen Raum: Marktanteilsanalyse nach Unternehmen, basierend auf dem Umsatz (2023)
Abbildung 10: Markt für Industriemotoren im asiatisch-pazifischen Raum, durchschnittliche jährliche Wachstumsrate (CAGR) nach Kraftstoffart (%), 2024–2032
Abbildung 11: Marktanteil von Industriemotoren im asiatisch-pazifischen Raum (%), nach Kraftstoffart, 2023
Abbildung 12: Marktanteil von Industriemotoren im asiatisch-pazifischen Raum (%), nach Kraftstoffart, 2032
Abbildung 13: Markt für Industriemotoren im asiatisch-pazifischen Raum, nach Motortyp, CAGR (%), 2024–2032
Abbildung 14: Marktanteil von Industriemotoren im asiatisch-pazifischen Raum (%), nach Motortyp, 2023
Abbildung 15: Marktanteil von Industriemotoren im asiatisch-pazifischen Raum (%), nach Motortyp, 2032
Abbildung 16: Markt für Industriemotoren im asiatisch-pazifischen Raum, nach Kühlung, CAGR (%), 2024–2032
Abbildung 17: Marktanteil von Industriemotoren im asiatisch-pazifischen Raum (%), nach Kühlung, 2023
Abbildung 18: Marktanteil von Industriemotoren im asiatisch-pazifischen Raum (%), nach Kühlung, 2032
Abbildung 19: Markt für Industriemotoren im asiatisch-pazifischen Raum, nach Betriebsart, CAGR (%) 2024–2032
Abbildung 20: Marktanteile (%) am asiatisch-pazifischen Markt für Industriemotoren nach Betriebsart, 2023
Abbildung 21: Marktanteile (%) am asiatisch-pazifischen Markt für Industriemotoren nach Betriebsart, 2032
Abbildung 22: Markt für Industriemotoren im asiatisch-pazifischen Raum nach Vertriebskanal, CAGR (%), 2024–2032
Abbildung 23: Marktanteile (%) am asiatisch-pazifischen Markt für Industriemotoren nach Vertriebskanal, 2023
Abbildung 24: Marktanteile (%) am asiatisch-pazifischen Markt für Industriemotoren nach Vertriebskanal, 2032
Abbildung 25: Markt für Industriemotoren im asiatisch-pazifischen Raum nach Endverwendung, CAGR (%), 2024–2032
Abbildung 26: Marktanteile (%) am asiatisch-pazifischen Markt für Industriemotoren nach Endverwendung, 2023
Abbildung 27: Marktanteile (%) am asiatisch-pazifischen Markt für Industriemotoren nach Endverwendung, 2032
Abbildung 28: Markt für Industriemotoren im asiatisch-pazifischen Raum nach Land, CAGR (%), 2024–2032
Abbildung 29: Marktanteile von Industriemotoren im asiatisch-pazifischen Raum (%), nach Ländern, 2023;
Abbildung 30: Marktanteile von Industriemotoren im asiatisch-pazifischen Raum (%), nach Ländern, 2032
; Abbildung 31: Markt für
Industriemotoren in China: Segment mit dem höchsten Marktanteil (%); Abbildung 32: Markt für Industriemotoren in China: Netto-Potenzialzuwachs in Mrd. US-Dollar
Potenzialanalyse nach Kraftstoffart
Potenzialanalyse nach Motortyp;
Abbildung 35: Markt für Industriemotoren in China
: Potenzialanalyse nach Kühlung Abbildung 36: Markt für Industriemotoren in China: Potenzialanalyse nach Betriebsart; Abbildung 37: Markt für Industriemotoren in China: Potenzialanalyse nach Vertriebskanal
; Abbildung 38: Markt für Industriemotoren in China: Potenzialanalyse nach Endverwendung
; Abbildung 39: Marktanteile von Industriemotoren in China (%), nach Kraftstoffart, 2023
; Abbildung 40: Marktanteile von Industriemotoren in China (%), nach Kraftstoffart, 2032
Abbildung 41: Marktanteil chinesischer Industriemotoren (%), nach Motortyp, 2023;
Abbildung 42: Marktanteil chinesischer Industriemotoren (%), nach Motortyp, 2032;
Abbildung 43: Marktanteil chinesischer Industriemotoren (%), nach Kühlung, 2023;
Abbildung 44: Marktanteil chinesischer Industriemotoren (%), nach Kühlung, 2032;
Abbildung 45: Marktanteil chinesischer Industriemotoren (%), nach Betriebsart, 2023;
Abbildung 46: Marktanteil chinesischer Industriemotoren (%), nach Betriebsart, 2032;
Abbildung 47: Marktanteil chinesischer Industriemotoren (%), nach Vertriebskanal
; Abbildung 48: Marktanteil chinesischer Industriemotoren (%), nach Vertriebskanal, 2032;
Abbildung 49: Marktanteil chinesischer Industriemotoren (%), nach Endverwendung,
Abbildung 50: Marktanteil chinesischer Industriemotoren (%), nach Endverwendung, 2032;
Abbildung 51: Markt für Industriemotoren in Indien: Segment mit dem höchsten Marktanteil (%);
Abbildung 52: Markt für Industriemotoren in Indien: Netto-Marktpotenzial (in Mrd. US$)
Abbildung 53: Markt für Industriemotoren in Indien: Potenzialanalyse nach Kraftstoffart
Abbildung 54: Markt für Industriemotoren in Indien: Potenzialanalyse nach Motortyp
Abbildung 55: Markt für Industriemotoren in Indien: Potenzialanalyse nach Kühlung
Abbildung 56: Markt für Industriemotoren in Indien: Potenzialanalyse nach Betriebsart
Abbildung 57: Markt für Industriemotoren in Indien: Potenzialanalyse nach Vertriebskanal
Abbildung 58: Markt für Industriemotoren in Indien: Potenzialanalyse nach Endverwendung
Abbildung 59: Marktanteil (%) für Industriemotoren in Indien nach Kraftstoffart, 2023
Abbildung 60: Marktanteil (%) für Industriemotoren in Indien nach Kraftstoffart, 2032
Abbildung 61: Marktanteil (%) für Industriemotoren in Indien nach Motortyp, 2023
Abbildung 62: Marktanteil (%) für Industriemotoren in Indien nach Motortyp, 2032
Abbildung 63: Marktanteil (%) für Industriemotoren in Indien nach Kühlung 2023
Abbildung:64 Marktanteil Indiens für Industriemotoren (%), nach Kühlung, 2032
Abbildung:65 Marktanteil Indiens für Industriemotoren (%), nach Betriebsart, 2023
Abbildung:66 Marktanteil Indiens für Industriemotoren (%), nach Betriebsart, 2032
Abbildung:67 Marktanteil Indiens für Industriemotoren (%), nach Vertriebskanal, 2023
Abbildung:68 Marktanteil Indiens für Industriemotoren (%), nach Vertriebskanal, 2032
Abbildung:69 Marktanteil Indiens für Industriemotoren (%), nach Endverwendung, 2023
Abbildung:70 Marktanteil Indiens für Industriemotoren (%), nach Endverwendung, 2032
Abbildung:71 Markt für Industriemotoren in Japan: Segment mit dem höchsten Anteil (%) Abbildung
:72 Markt für Industriemotoren in Japan: Nettopotenzialzuwachs in Mrd. US$ Abbildung
:73 Markt für Industriemotoren in Japan: Potenzialanalyse nach Kraftstoffart
Abbildung:74 Markt für Industriemotoren in Japan: Potenzialanalyse nach Motortyp
Abbildung:75 Japan Markt für Industriemotoren in Japan: Chancenanalyse nach Kühlung
(Abbildung 76) | Markt für Industriemotoren in Japan: Chancenanalyse nach Betriebsart
(Abbildung 77) | Markt für Industriemotoren in Japan: Chancenanalyse nach Vertriebskanal (
Abbildung 78) | Markt für Industriemotoren in Japan: Chancenanalyse nach Endverwendung
(Abbildung 79) | Marktanteile (%) nach Kraftstoffart, 2023
(Abbildung 80) | Marktanteile (%) nach Kraftstoffart,
2032 (Abbildung 81) | Marktanteile
(%) nach Motortyp, 2023 (Abbildung 82) | Marktanteile
(%) nach Motortyp, 2032 (
Abbildung 83) | Marktanteile (%) nach Kühlung, 2023 (Abbildung 84)
| Marktanteile (%) nach Kühlung, 2032 (Abbildung 85) |
Marktanteile (%) nach Betriebsart, 2023 (Abbildung 86)
Abbildung 87: Marktanteil japanischer Industriemotoren (%), nach Vertriebskanal, 2023;
Abbildung 88: Marktanteil japanischer Industriemotoren (%), nach Vertriebskanal, 2032;
Abbildung 89: Marktanteil japanischer Industriemotoren (%), nach Endverwendung, 2023;
Abbildung 90: Marktanteil japanischer Industriemotoren (%), nach Endverwendung, 2032
; Abbildung 91: Markt für Industriemotoren in Australien und Neuseeland: Segment mit dem höchsten Anteil (%)
; Abbildung 92: Markt für Industriemotoren in Australien und Neuseeland: Nettopotenzialzuwachs in Mrd. US-Dollar
; Abbildung 93: Markt für Industriemotoren in Australien und Neuseeland: Potenzialanalyse nach Kraftstoffart
; Abbildung 94: Markt für Industriemotoren in Australien und Neuseeland: Potenzialanalyse nach Motortyp
; Abbildung 95: Markt für Industriemotoren in Australien und Neuseeland: Potenzialanalyse nach Kühlung
; Abbildung 96: Markt für Industriemotoren in Australien und Neuseeland: Potenzialanalyse nach Betriebsart;
Abbildung 97: Industriemotoren in Australien und Neuseeland Markt: Chancenanalyse nach Vertriebskanal
Abbildung 98 Australien & Neuseeland Markt für Industriemotoren: Chancenanalyse nach Endverwendung
Abbildung 99 Marktanteil (%) nach Kraftstoffart, 2023 Abbildung 100 Marktanteil (
%) nach Kraftstoffart, 2032 Abbildung 101 Marktanteil (%) nach Motortyp, 2023
Abbildung 102 Marktanteil (%) nach
Motortyp, 2032 Abbildung 103 Marktanteil (%) nach Kühlung, 2023 Abbildung 104 Marktanteil
(%) nach Kühlung, 2032 Abbildung
105 Marktanteil (%) nach Betriebsart, 2023
Abbildung 106 Marktanteil (%), nach Betriebsart, 2032
Abbildung:107 Marktanteil Australien & Neuseeland für Industriemotoren (%), nach Vertriebskanal, 2023
Abbildung:108 Marktanteil Australien & Neuseeland für Industriemotoren (%), nach Vertriebskanal, 2032
Abbildung:109 Marktanteil Australien & Neuseeland für Industriemotoren (%), nach Endverwendung, 2023
Abbildung:110 Marktanteil Australien & Neuseeland für Industriemotoren (%), nach Endverwendung, 2032
Abbildung:111 Südkoreanischer Markt für Industriemotoren: Segment mit dem höchsten Anteil (%)
Abbildung:112 Südkoreanischer Markt für Industriemotoren: Nettopotenzialzuwachs in Mrd. US$ Abbildung
:113 Südkoreanischer Markt für Industriemotoren: Potenzialanalyse nach Kraftstoffart
Abbildung:114 Südkoreanischer Markt für Industriemotoren: Potenzialanalyse nach Motortyp
Abbildung:115 Südkoreanischer Markt für Industriemotoren: Potenzialanalyse nach Kühlung
Abbildung:116 Südkoreanischer Markt für Industriemotoren: Potenzial Bewertung, nach Betriebsart
Abbildung:117 Südkoreanischer Markt für Industriemotoren: Chancenbewertung, nach Vertriebskanal
Abbildung:118 Südkoreanischer Markt für Industriemotoren: Chancenbewertung, nach Endverwendung
Abbildung:119 Marktanteil Südkoreanischer Industriemotoren (%), nach Kraftstoffart, 2023
Abbildung:120 Marktanteil Südkoreanischer Industriemotoren (%), nach Kraftstoffart, 2032
Abbildung:121 Marktanteil Südkoreanischer Industriemotoren (%), nach Motortyp, 2023
Abbildung:122 Marktanteil Südkoreanischer Industriemotoren (%), nach Motortyp, 2032
Abbildung:123 Marktanteil Südkoreanischer Industriemotoren (%), nach Kühlung, 2023
Abbildung:124 Marktanteil Südkoreanischer Industriemotoren (%), nach Kühlung, 2032
Abbildung:125 Marktanteil Südkoreanischer Industriemotoren (%), nach Betriebsart, 2023
Abbildung:126 Marktanteil Südkoreanischer Industriemotoren (%), nach Betriebsart, 2032
Abbildung:127 Südkoreanische Industriemotoren Marktanteil (%), nach Vertriebskanal, 2023
Abbildung:128 Südkorea Marktanteil (%), nach Vertriebskanal, 2032
Abbildung:129 Südkorea Marktanteil (%), nach Endverwendung, 2023
Abbildung:130 Südkorea Marktanteil (%), nach Endverwendung, 2032
Abbildung:131 ASEAN-Industriemotorenmarkt: Segment mit dem höchsten Anteil (%)
Abbildung:132 ASEAN-Industriemotorenmarkt: Netto-Potenzialzuwachs in Mrd. US$
Abbildung:133 ASEAN-Industriemotorenmarkt: Potenzialanalyse nach Kraftstoffart
Abbildung:134 ASEAN-Industriemotorenmarkt: Potenzialanalyse nach Motortyp
Abbildung:135 ASEAN-Industriemotorenmarkt: Potenzialanalyse nach Kühlung
Abbildung:136 ASEAN-Industriemotorenmarkt: Potenzialanalyse nach Betriebsart
Abbildung:137 ASEAN-Industriemotorenmarkt: Potenzialanalyse nach Vertriebskanal
Abbildung:138 ASEAN-Industriemotorenmarkt: Chancenanalyse, nach Endverwendung
Abbildung:139 ASEAN-Marktanteil für Industriemotoren (%), nach Kraftstoffart, 2023
Abbildung:140 ASEAN-Marktanteil für Industriemotoren (%), nach Kraftstoffart, 2032
Abbildung:141 ASEAN-Marktanteil für Industriemotoren (%), nach Motortyp, 2023
Abbildung:142 ASEAN-Marktanteil für Industriemotoren (%), nach Motortyp, 2032
Abbildung:143 ASEAN-Marktanteil für Industriemotoren (%), nach Kühlung, 2023
Abbildung:144 ASEAN-Marktanteil für Industriemotoren (%), nach Kühlung, 2032
Abbildung:145 ASEAN-Marktanteil für Industriemotoren (%), nach Betriebsart, 2023
Abbildung:146 ASEAN-Marktanteil für Industriemotoren (%), nach Betriebsart, 2032
Abbildung:147 ASEAN-Marktanteil für Industriemotoren (%), nach Vertriebskanal, 2023
Abbildung:148 ASEAN-Marktanteil für Industriemotoren (%), nach Vertriebskanal 2032
Abbildung:149 ASEAN-Marktanteil für Industriemotoren (%), nach Endverwendung, 2023
Abbildung:150 ASEAN-Marktanteil für Industriemotoren (%), nach Endverwendung, 2032
Abbildung:151 Singapur-Markt für Industriemotoren: Segment mit dem höchsten Anteil (%)
Abbildung:152 Singapur-Markt für Industriemotoren: Netto-Potenzialzuwachs in Mrd. US$
Abbildung:153 Singapur-Markt für Industriemotoren: Potenzialanalyse nach Kraftstoffart
Abbildung:154 Singapur-Markt für Industriemotoren: Potenzialanalyse nach Motortyp
Abbildung:155 Singapur-Markt für Industriemotoren: Potenzialanalyse nach Kühlung
Abbildung:156 Singapur-Markt für Industriemotoren: Potenzialanalyse nach Betriebsart
Abbildung:157 Singapur-Markt für Industriemotoren: Potenzialanalyse nach Vertriebskanal
Abbildung:158 Singapur-Markt für Industriemotoren: Potenzialanalyse nach Endverwendung
Abbildung:159 Singapur Marktanteile von Industriemotoren in Singapur (%), nach Kraftstoffart, 2023
Abbildung:160 Marktanteile von Industriemotoren in Singapur (%), nach Kraftstoffart, 2032
Abbildung:161 Marktanteil von Industriemotoren in Singapur (%), nach Motortyp, 2023
Abbildung:162 Marktanteil von Industriemotoren in Singapur (%), nach Motortyp, 2032
Abbildung:163 Marktanteil von Industriemotoren in Singapur (%), nach Kühlung, 2023
Abbildung:164 Marktanteil von Industriemotoren in Singapur (%), nach Kühlung, 2032
Abbildung:165 Marktanteil von Industriemotoren in Singapur (%), nach Betriebsart, 2023
Abbildung:166 Marktanteil von Industriemotoren in Singapur (%), nach Betriebsart, 2032
Abbildung:167 Marktanteil von Industriemotoren in Singapur (%), nach Vertriebskanal, 2023
Abbildung:168 Marktanteil von Industriemotoren in Singapur (%), nach Vertriebskanal
169 : Marktanteil Singapurs für Industriemotoren (%), nach Endverwendung, 2023;
Abbildung 170: Marktanteil Singapurs für Industriemotoren (%), nach Endverwendung, 2032;
Abbildung 171: Markt für Industriemotoren auf den Philippinen: Segment mit dem höchsten Anteil (%);
Abbildung 172: Markt für Industriemotoren auf den Philippinen: Netto-Potenzialzuwachs in Mrd. US-Dollar;
Abbildung 173: Markt für Industriemotoren auf den Philippinen: Potenzialanalyse nach Kraftstoffart
; Abbildung 174: Markt für Industriemotoren auf den Philippinen: Potenzialanalyse nach Motortyp
; Abbildung 175: Markt für Industriemotoren auf den Philippinen: Potenzialanalyse nach Kühlung
; Abbildung 176: Markt für Industriemotoren auf den Philippinen: Potenzialanalyse nach Betriebsart
; Abbildung 177: Markt für Industriemotoren auf den Philippinen: Potenzialanalyse nach Vertriebskanal
; Abbildung 178: Markt für Industriemotoren auf den Philippinen: Potenzialanalyse nach Endverwendung;
Abbildung 179: Marktanteil für Industriemotoren auf den Philippinen
(%), nach Kraftstoffart, 2023 Abbildung:180Philippinen Industriemotoren Marktanteil (%), nach Kraftstoffart, 2032
Abbildung:181Philippinen Industriemotoren Marktanteil (%), nach Motortyp, 2023
Abbildung:182Philippinen Industriemotoren Marktanteil (%), nach Motortyp, 2032
Abbildung:183Philippinen Industriemotoren Marktanteil (%), nach Kühlung, 2023
Abbildung:184Philippinen Industriemotoren Marktanteil (%), nach Kühlung, 2032
Abbildung:185Philippinen Industriemotoren Marktanteil (%), nach Betriebsart, 2023
Abbildung:186Philippinen Industriemotoren Marktanteil (%), nach Betriebsart, 2032
Abbildung:187Philippinen Industriemotoren Marktanteil (%), nach Vertriebskanal, 2023
Abbildung:188Philippinen Industriemotoren Marktanteil (%), nach Vertriebskanal, 2032
Abbildung:189Philippinen Industriemotoren Marktanteil (%), nach Endverwendung, 2023
Abbildung:190 Marktanteil Philippinen Industriemotoren (%), nach Endverwendung, 2032
Abbildung:191 Markt für Industriemotoren in Vietnam: Segment mit dem höchsten Anteil (%) Abbildung
:192 Markt für Industriemotoren in Vietnam: Netto-Potenzialzuwachs in Mrd. US$
Abbildung:193 Markt für Industriemotoren in Vietnam: Potenzialanalyse nach Kraftstoffart
Abbildung:194 Markt für Industriemotoren in Vietnam: Potenzialanalyse nach Motortyp
Abbildung:195 Markt für Industriemotoren in Vietnam: Potenzialanalyse nach Kühlung
Abbildung:196 Markt für Industriemotoren in Vietnam: Potenzialanalyse nach Betriebsart
Abbildung:197 Markt für Industriemotoren in Vietnam: Potenzialanalyse nach Vertriebskanal
Abbildung:198 Markt für Industriemotoren in Vietnam: Potenzialanalyse nach Endverwendung
Abbildung:199 Marktanteil von Industriemotoren in Vietnam (%), nach Kraftstoffart, 2023
Abbildung 200: Marktanteil vietnamesischer Industriemotoren (%), nach Kraftstoffart, 2032;
Abbildung 201: Marktanteil vietnamesischer Industriemotoren (%), nach Motortyp, 2023;
Abbildung 202: Marktanteil vietnamesischer Industriemotoren (%), nach Motortyp, 2032;
Abbildung 203: Marktanteil vietnamesischer Industriemotoren (%), nach Kühlung, 2023;
Abbildung 204: Marktanteil vietnamesischer Industriemotoren (%), nach Kühlung, 2032;
Abbildung 205: Marktanteil vietnamesischer Industriemotoren (%), nach Betriebsart, 2023
; Abbildung 206: Marktanteil vietnamesischer Industriemotoren (%), nach Betriebsart, 2032
; Abbildung 207: Marktanteil vietnamesischer Industriemotoren (%), nach Vertriebskanal, 2023;
Abbildung 208: Marktanteil vietnamesischer Industriemotoren (%), nach Vertriebskanal, 2032;
Abbildung 209: Marktanteil vietnamesischer Industriemotoren (%), nach Endverwendung
210 : Marktanteil Vietnams (%) nach Endverwendung, 2023;
Abbildung 211: Markt für Industriemotoren in Indonesien: Segment mit dem höchsten Anteil (%);
Abbildung 212: Markt für Industriemotoren in Indonesien: Netto-Potenzialzuwachs in Mrd. US-Dollar;
Abbildung 213: Markt für Industriemotoren in Indonesien: Potenzialanalyse nach Kraftstoffart
; Abbildung 214: Markt für Industriemotoren in Indonesien: Potenzialanalyse nach Motortyp
; Abbildung 215: Markt für Industriemotoren in Indonesien: Potenzialanalyse nach Kühlung
; Abbildung 216: Markt für Industriemotoren in Indonesien: Potenzialanalyse nach Betriebsart
; Abbildung 217: Markt für Industriemotoren in Indonesien: Potenzialanalyse nach Vertriebskanal
; Abbildung 218: Markt für Industriemotoren in Indonesien: Potenzialanalyse nach Endverwendung
; Abbildung 219: Marktanteil Indonesiens (%) nach Kraftstoffart, 2023;
Abbildung 220: Marktanteil Indonesiens
(%), nach Kraftstoffart, 2032 Abbildung:221Indonesischer Marktanteil (%), nach Motortyp, 2023
Abbildung:222Indonesischer Marktanteil (%), nach Motortyp, 2032
Abbildung:223Indonesischer Marktanteil (%), nach Kühlung, 2023
Abbildung:224Indonesischer Marktanteil (%), nach Kühlung, 2032
Abbildung:225Indonesischer Marktanteil (%), nach Betriebsart, 2023
Abbildung:226Indonesischer Marktanteil (%), nach Betriebsart, 2032
Abbildung:227Indonesischer Marktanteil (%), nach Vertriebskanal, 2023
Abbildung:228Indonesischer Marktanteil (%), nach Vertriebskanal, 2032
Abbildung:229Indonesischer Marktanteil (%), nach Endverwendung, 2023
Abbildung:230Indonesische Industriemotoren Marktanteil (%), nach Endverwendung, 2032
Abbildung:231 Markt für Industriemotoren in Malaysia: Segment mit dem höchsten Anteil (%)
Abbildung:232 Markt für Industriemotoren in Malaysia: Netto-Potenzialzuwachs in Mrd. US$
Abbildung:233 Markt für Industriemotoren in Malaysia: Potenzialanalyse nach Kraftstoffart
Abbildung:234 Markt für Industriemotoren in Malaysia: Potenzialanalyse nach Motortyp
Abbildung:235 Markt für Industriemotoren in Malaysia:
Potenzialanalyse nach Kühlung Abbildung:236 Markt für Industriemotoren in Malaysia: Potenzialanalyse nach Betriebsart
Abbildung:237 Markt für Industriemotoren in Malaysia: Potenzialanalyse nach Vertriebskanal
Abbildung:238 Markt für Industriemotoren in Malaysia: Potenzialanalyse nach Endverwendung
Abbildung:239 Marktanteil (%) von Industriemotoren in Malaysia nach Kraftstoffart, 2023
Abbildung:240 Marktanteil (%) von Industriemotoren in Malaysia nach Kraftstoffart, 2032
Abbildung 241: Marktanteile malaysischer Industriemotoren (%), nach Motortyp, 2023;
Abbildung 242: Marktanteile malaysischer Industriemotoren (%), nach Motortyp, 2032;
Abbildung 243: Marktanteile malaysischer Industriemotoren (%), nach Kühlung, 2023;
Abbildung 244: Marktanteile malaysischer Industriemotoren (%), nach Kühlung, 2032
; Abbildung 245: Marktanteile malaysischer Industriemotoren (%), nach Betriebsart, 2023;
Abbildung 246: Marktanteile malaysischer Industriemotoren (%), nach Betriebsart, 2032
; Abbildung 247: Marktanteile malaysischer Industriemotoren (%), nach Vertriebskanal, 2023;
Abbildung 248: Marktanteile malaysischer Industriemotoren (%), nach Vertriebskanal, 2032;
Abbildung 249: Marktanteile malaysischer Industriemotoren (%), nach Endverwendung, 2023;
Abbildung 250: Marktanteile malaysischer Industriemotoren (%), nach Endverwendung
2032 :251Rest Asien Pa Markt für Industriemotoren im asiatisch-pazifischen Raum: Höchster Marktanteil (%) Abbildung
: 252 Markt für Industriemotoren im übrigen Asien-Pazifik-Raum: Nettopotenzialzuwachs in Mrd. US-Dollar
Abbildung: 253 Markt für Industriemotoren
im übrigen Asien-Pazifik-Raum: Potenzialanalyse nach Kraftstoffart Abbildung: 254 Markt für Industriemotoren im übrigen
Asien-Pazifik-Raum: Potenzialanalyse nach
Abbildung: 255 Markt für Industriemotoren im übrigen Asien-Pazifik-Raum: Potenzialanalyse nach Kühlung Abbildung: 256
Markt für Industriemotoren im übrigen Asien-Pazifik-Raum: Potenzialanalyse nach Betriebsart Abbildung: 257
Markt für Industriemotoren im übrigen Asien-Pazifik-Raum: Potenzialanalyse nach Vertriebskanal Abbildung: 258 Markt für Industriemotoren im übrigen Asien-Pazifik-Raum: Potenzialanalyse nach Endverwendung
259 Marktanteil (%) nach Kraftstoffart, 2023
Abbildung: 260 Marktanteil (%) nach Kraftstoffart, 2032
Abbildung: 261 Marktanteile der Industriemotoren im asiatisch-pazifischen Raum (%), nach Motortyp, 2023
Abbildung: 262 Marktanteile der Industriemotoren im übrigen asiatisch-pazifischen Raum (%), nach Motortyp, 2032
Abbildung: 263 Marktanteile der Industriemotoren im übrigen asiatisch-pazifischen Raum (%), nach Kühlung, 2023
Abbildung: 264 Marktanteile der Industriemotoren im übrigen asiatisch-pazifischen Raum (%), nach Kühlung, 2032
Abbildung: 265 Marktanteile der Industriemotoren im übrigen asiatisch-pazifischen Raum (%), nach Betriebsart, 2023
Abbildung: 266 Marktanteile der Industriemotoren im übrigen asiatisch-pazifischen Raum (%), nach Betriebsart, 2032
Abbildung: 267 Marktanteile der Industriemotoren im übrigen asiatisch-pazifischen Raum (%), nach Vertriebskanal, 2023
Abbildung: 268 Marktanteile der Industriemotoren im übrigen asiatisch-pazifischen Raum (%), nach Vertriebskanal, 2032
Abbildung: 269 Marktanteile der Industriemotoren im übrigen asiatisch-pazifischen Raum (%), nach Endverwendung, 2023
Abbildung: 270 Marktanteil (%), nach Endverwendung, 2032
Abbildung:271Caterpillar Inc.: Umsatzsegmentierung nach Geschäftsfeld, 2023
Abbildung:272Caterpillar Inc.: Umsatzsegmentierung nach geografischem Gebiet, 2023
Abbildung:273CNH Industrial NV: Umsatzsegmentierung nach Geschäftsfeld, 2023
Abbildung:274CNH Industrial NV: Umsatzsegmentierung nach geografischem Gebiet, 2023
Abbildung:275Cummins Inc.: Umsatzsegmentierung nach Geschäftsfeld, 2023
Abbildung:276Cummins Inc.: Umsatzsegmentierung nach geografischem Gebiet, 2023
Abbildung:277DAIHATSU DIESEL MFG. CO., LTD.: Umsatzsegmentierung nach Geschäftsfeld, 2023
Abbildung:278DAIHATSU DIESEL MFG. CO., LTD.: Geografische Umsatzsegmentierung, 2023
Abbildung:279Honda Motor Co., Ltd.: Umsatzsegmentierung nach Geschäftsbereich, 2023
Abbildung:280Honda Motor Co., Ltd.: Geografische Umsatzsegmentierung, 2023
Abbildung:281Hyundai Motor Company: Umsatzsegmentierung nach Geschäftsbereich, 2023
Abbildung:282Hyundai Motor Company: Geografische Umsatzsegmentierung, 2023
Abbildung:283Ingersoll Rand: Umsatzsegmentierung nach Geschäftsbereich, 2023
Abbildung:284Ingersoll Rand: Umsatzsegmentierung nach Geschäftsbereich, 2023
Abbildung:285Ingersoll Rand: Umsatzsegmentierung nach Geschäftsbereich, 2023
Abbildung:286Kawasaki Heavy Industries Limited: Umsatzsegmentierung nach Geschäftsbereich, 2021
Abbildung:287Kawasaki Heavy Industries Limited: Geografische Umsatzsegmentierung, 2021
Abbildung:288Kirloskar Group: Umsatzsegmentierung nach Geschäftsbereich
289 : Mitsubishi Electric Corporation: Umsatzsegmentierung nach Geschäftsbereichen, 2023;
Abbildung 290: Mitsubishi Electric Corporation: Umsatzsegmentierung nach geografischer Region, 2023;
Abbildung 291: Siemens Energy AG: Umsatzsegmentierung nach Geschäftsbereichen, 2023;
Abbildung 292: Siemens Energy AG: Umsatzsegmentierung nach geografischer Region, 2023


Merkmale | Lizenzart | ||||
Datenbuch | Einzelbenutzer |   Mehrere Benutzer | Unternehmen | ||
| E-Zugang | ✓ | ✓ | ✓ | ✓ | |
Benutzerfreigabe | Nur für 1 Benutzer | Nur für 1 Benutzer | Bis zu 7 Benutzer | Unbegrenzter Benutzerzugriff | |
⨉ | ⨉ | ⨉ | ✓ | ||
Kostenlose Anpassung | Keine kostenlose Anpassung | Bis zu 30 Stunden Arbeit | Bis zu 60 Stunden Arbeit | Bis zu 80 Arbeitsstunden | |
Lieferformat |
| ⨉ | ✓ | ✓ | ✓ |
| ✓ | ⨉ | ✓ | ✓ | |
| ⨉ | ⨉ | ⨉ | ✓ | |
Analystenunterstützung | 2 Monate Analystenunterstützung | 4 Monate Analystenunterstützung | 7 Monate Analystenunterstützung | Ein Jahr Analystenbetreuung | |
Kostenloses Bericht-Update im nächsten Aktualisierungszyklus | ⨉ | ⨉ | ⨉ | ✓ | |
Kostenloses Branchen-Update (Innerhalb von 180 Tagen) | ⨉ | ⨉ | ⨉ | ✓ | |
Nutzen | Bis zu 10 % Rabatt nach dem Kauf | Bis zu 20 % Rabatt nach dem Kauf | Bis zu 30 % Rabatt nach dem Kauf | Bis zu 40 % Rabatt nach dem Kauf | |