Table: 1 PESTLE Impact Analysis: Political Factors
Table: 2 PESTLE Impact Analysis: Economic Factors
Table: 3 PESTLE Impact Analysis: Social Factors
Table: 4 PESTLE Impact Analysis: Technological Factors
Table: 5 PESTLE Impact Analysis: Legal Factors
Table: 6 PESTLE Impact Analysis: Environmental Factors
Table: 7 Driver: Global Food Safety Standards and Certifications
Table: 8 Trend: Integration of Artificial Intelligence and IoT
Table: 9 Market Dynamics And Trends: Impact Analysis of Market Dynamics
Table: 10 Competitive Dashboard: Competitor Mapping & Benchmarking
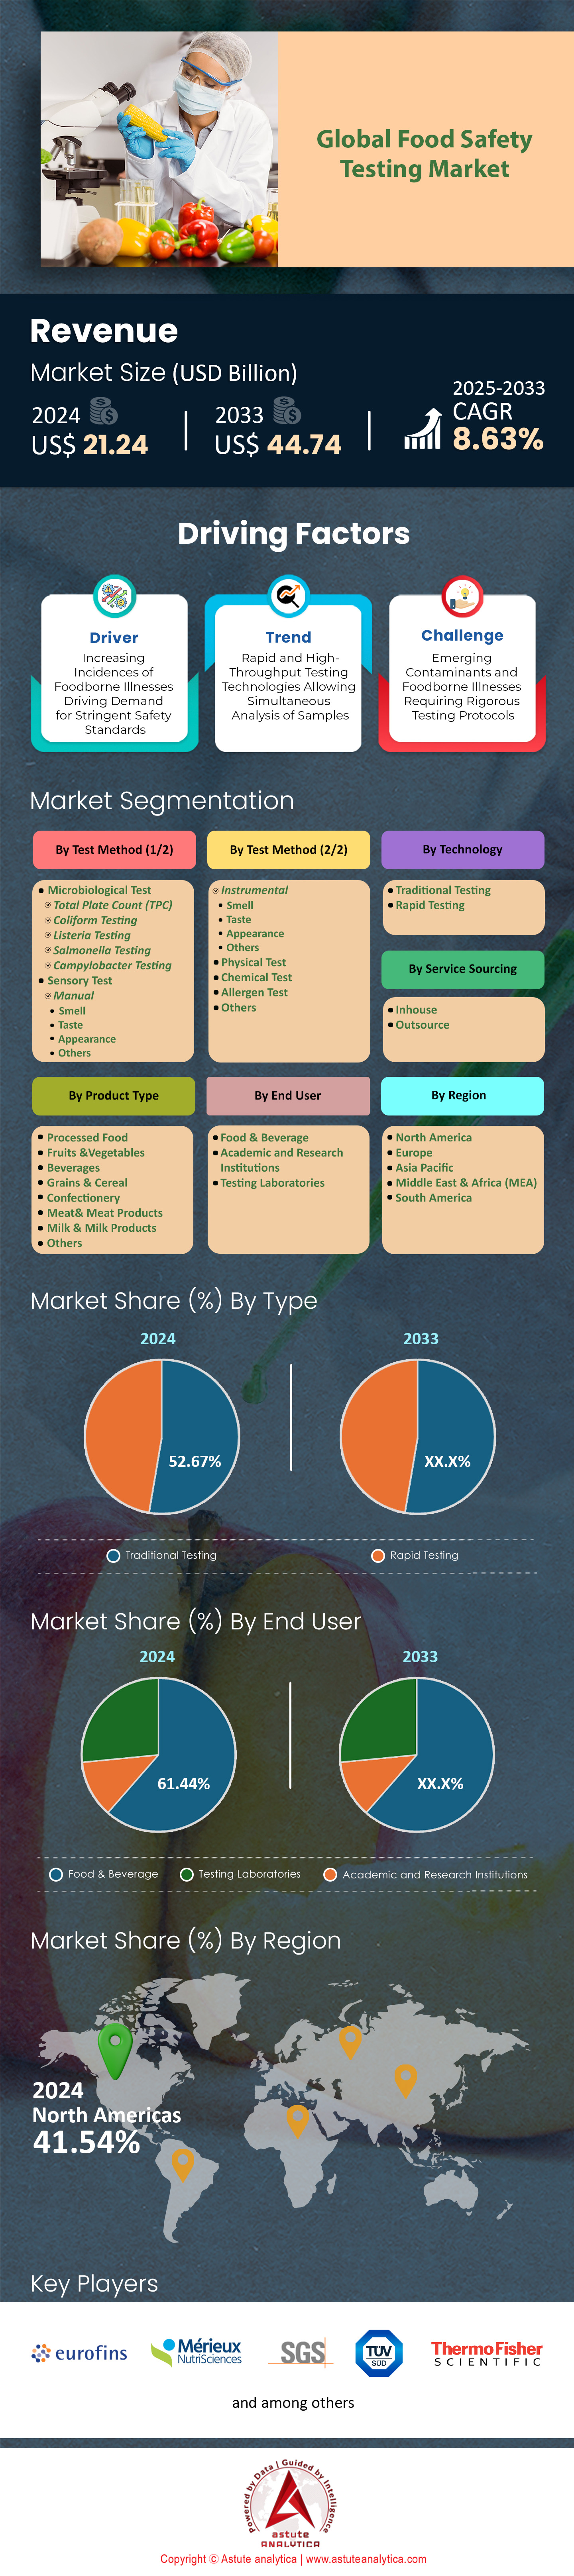
Table: 11 Global Food Safety Testing Market Size (US$ Bn), By Test Method, 2020-2033
Table: 12 Global Food Safety Testing Market Size (US$ Bn), By Product Type, 2020-2033
Table: 13 Global Food Safety Testing Market Size (US$ Bn), By Technology, 2020-2033
Table: 14 Global Food Safety Testing Market Size (US$ Bn), By Service Sourcing, 2020-2033
Table: 15 Global Food Safety Testing Market Size (US$ Bn), By End User, 2020-2033
Table: 16 Global Food Safety Testing Market Size (US$ Bn), By Region, 2020-2033
Table: 17 North America Food Safety Testing Market Size (US$ Bn), By Country, 2020-2033
Table: 18 North America Food Safety Testing Market Size (US$ Bn), By Test Method, 2020-2033
Table: 19 North America Food Safety Testing Market Size (US$ Bn), By Product Type, 2020-2033
Table: 20 North America Food Safety Testing Market Size (US$ Bn), By Technology, 2020-2033
Table: 21 North America Food Safety Testing Market Size (US$ Bn), By Service Sourcing, 2020-2033
Table: 22 North America Food Safety Testing Market Size (US$ Bn), By End User, 2020-2033
Table: 23 Europe Food Safety Testing Market Size (US$ Bn), By Country, 2020-2033
Table: 24 Europe Food Safety Testing Market Size (US$ Bn), By Test Method, 2020-2033
Table: 25 Europe Food Safety Testing Market Size (US$ Bn), By Product Type, 2020-2033
Table: 26 Europe Food Safety Testing Market Size (US$ Bn), By Technology, 2020-2033
Table: 27 Europe Food Safety Testing Market Size (US$ Bn), By Service Sourcing, 2020-2033
Table: 28 Europe Food Safety Testing Market Size (US$ Bn), By End User, 2020-2033
Table: 29 Asia Pacific Food Safety Testing Market Size (US$ Bn), By Country, 2020-2033
Table: 30 Asia Pacific Food Safety Testing Market Size (US$ Bn), By Test Method, 2020-2033
Table: 31 Asia Pacific Food Safety Testing Market Size (US$ Bn), By Product Type, 2020-2033
Table: 32 Asia Pacific Food Safety Testing Market Size (US$ Bn), By Technology, 2020-2033
Table: 33 Asia Pacific Food Safety Testing Market Size (US$ Bn), By Service Sourcing, 2020-2033
Table: 34 Asia Pacific Food Safety Testing Market Size (US$ Bn), By End User, 2020-2033
Table: 35 Middle East & Africa Food Safety Testing Market Size (US$ Bn), By Country, 2020-2033
Table: 36 Middle East & Africa Food Safety Testing Market Size (US$ Bn), By Test Method, 2020-2033
Table: 37 Middle East & Africa Food Safety Testing Market Size (US$ Bn), By Product Type, 2020-2033
Table: 38 Middle East & Africa Food Safety Testing Market Size (US$ Bn), By Technology, 2020-2033
Table: 39 Middle East & Africa Food Safety Testing Market Size (US$ Bn), By Service Sourcing, 2020-2033
Table: 40 Middle East & Africa Food Safety Testing Market Size (US$ Bn), By End User, 2020-2033
Table: 41 South America Food Safety Testing Market Size (US$ Bn), By Country, 2020-2033
Table: 42 South America Food Safety Testing Market Size (US$ Bn), By Test Method, 2020-2033
Table: 43 South America Food Safety Testing Market Size (US$ Bn), By Product Type, 2020-2033
Table: 44 South America Food Safety Testing Market Size (US$ Bn), By Technology, 2020-2033
Table: 45 South America Food Safety Testing Market Size (US$ Bn), By Service Sourcing, 2020-2033
Table: 46 South America Food Safety Testing Market Size (US$ Bn), By End User, 2020-2033
Table: 47 USA Food Safety Testing Market Size (US$ Bn), By Test Method, 2020-2033
Table: 48 USA Food Safety Testing Market Size (US$ Bn), By Product Type, 2020-2033
Table: 49 USA Food Safety Testing Market Size (US$ Bn), By Technology, 2020-2033
Table: 50 USA Food Safety Testing Market Size (US$ Bn), By Service Sourcing, 2020-2033
Table: 51 USA Food Safety Testing Market Size (US$ Bn), By End User, 2020-2033
Table: 52 Canada Food Safety Testing Market Size (US$ Bn), By Test Method, 2020-2033
Table: 53 Canada Food Safety Testing Market Size (US$ Bn), By Product Type, 2020-2033
Table: 54 Canada Food Safety Testing Market Size (US$ Bn), By Technology, 2020-2033
Table: 55 Canada Food Safety Testing Market Size (US$ Bn), By Service Sourcing, 2020-2033
Table: 56 Canada Food Safety Testing Market Size (US$ Bn), By End User, 2020-2033
Table: 57 Mexico Food Safety Testing Market Size (US$ Bn), By Test Method, 2020-2033
Table: 58 Mexico Food Safety Testing Market Size (US$ Bn), By Product Type, 2020-2033
Table: 59 Mexico Food Safety Testing Market Size (US$ Bn), By Technology, 2020-2033
Table: 60 Mexico Food Safety Testing Market Size (US$ Bn), By Service Sourcing, 2020-2033
Table: 61 Mexico Food Safety Testing Market Size (US$ Bn), By End User, 2020-2033
Table: 62 UK Food Safety Testing Market Size (US$ Bn), By Test Method, 2020-2033
Table: 63 UK Food Safety Testing Market Size (US$ Bn), By Product Type, 2020-2033
Table: 64 UK Food Safety Testing Market Size (US$ Bn), By Technology, 2020-2033
Table: 65 UK Food Safety Testing Market Size (US$ Bn), By Service Sourcing, 2020-2033
Table: 66 UK Food Safety Testing Market Size (US$ Bn), By End User, 2020-2033
Table: 67 Germany Food Safety Testing Market Size (US$ Bn), By Test Method, 2020-2033
Table: 68 Germany Food Safety Testing Market Size (US$ Bn), By Product Type, 2020-2033
Table: 69 Germany Food Safety Testing Market Size (US$ Bn), By Technology, 2020-2033
Table: 70 Germany Food Safety Testing Market Size (US$ Bn), By Service Sourcing, 2020-2033
Table: 71 Germany Food Safety Testing Market Size (US$ Bn), By End User, 2020-2033
Table: 72 France Food Safety Testing Market Size (US$ Bn), By Test Method, 2020-2033
Table: 73 France Food Safety Testing Market Size (US$ Bn), By Product Type, 2020-2033
Table: 74 France Food Safety Testing Market Size (US$ Bn), By Technology, 2020-2033
Table: 75 France Food Safety Testing Market Size (US$ Bn), By Service Sourcing, 2020-2033
Table: 76 France Food Safety Testing Market Size (US$ Bn), By End User, 2020-2033
Table: 77 Italy Food Safety Testing Market Size (US$ Bn), By Test Method, 2020-2033
Table: 78 Italy Food Safety Testing Market Size (US$ Bn), By Product Type, 2020-2033
Table: 79 Italy Food Safety Testing Market Size (US$ Bn), By Technology, 2020-2033
Table: 80 Italy Food Safety Testing Market Size (US$ Bn), By Service Sourcing, 2020-2033
Table: 81 Italy Food Safety Testing Market Size (US$ Bn), By End User, 2020-2033
Table: 82 Spain Food Safety Testing Market Size (US$ Bn), By Test Method, 2020-2033
Table: 83 Spain Food Safety Testing Market Size (US$ Bn), By Product Type, 2020-2033
Table: 84 Spain Food Safety Testing Market Size (US$ Bn), By Technology, 2020-2033
Table: 85 Spain Food Safety Testing Market Size (US$ Bn), By Service Sourcing, 2020-2033
Table: 86 Spain Food Safety Testing Market Size (US$ Bn), By End User, 2020-2033
Table: 87 Poland Food Safety Testing Market Size (US$ Bn), By Test Method, 2020-2033
Table: 88 Poland Food Safety Testing Market Size (US$ Bn), By Product Type, 2020-2033
Table: 89 Poland Food Safety Testing Market Size (US$ Bn), By Technology, 2020-2033
Table: 90 Poland Food Safety Testing Market Size (US$ Bn), By Service Sourcing, 2020-2033
Table: 91 Poland Food Safety Testing Market Size (US$ Bn), By End User, 2020-2033
Table: 92 Russia Food Safety Testing Market Size (US$ Bn), By Test Method, 2020-2033
Table: 93 Russia Food Safety Testing Market Size (US$ Bn), By Product Type, 2020-2033
Table: 94 Russia Food Safety Testing Market Size (US$ Bn), By Technology, 2020-2033
Table: 95 Russia Food Safety Testing Market Size (US$ Bn), By Service Sourcing, 2020-2033
Table: 96 Russia Food Safety Testing Market Size (US$ Bn), By End User, 2020-2033
Table: 97 Rest of Europe Food Safety Testing Market Size (US$ Bn), By Test Method, 2020-2033
Table: 98 Rest of Europe Food Safety Testing Market Size (US$ Bn), By Product Type, 2020-2033
Table: 99 Rest of Europe Food Safety Testing Market Size (US$ Bn), By Technology, 2020-2033
Table: 100 Rest of Europe Food Safety Testing Market Size (US$ Bn), By Service Sourcing, 2020-2033
Table: 101 Rest of Europe Food Safety Testing Market Size (US$ Bn), By End User, 2020-2033
Table: 102 China Food Safety Testing Market Size (US$ Bn), By Test Method, 2020-2033
Table: 103 China Food Safety Testing Market Size (US$ Bn), By Product Type, 2020-2033
Table: 104 China Food Safety Testing Market Size (US$ Bn), By Technology, 2020-2033
Table: 105 China Food Safety Testing Market Size (US$ Bn), By Service Sourcing, 2020-2033
Table: 106 China Food Safety Testing Market Size (US$ Bn), By End User, 2020-2033
Table: 107 India Food Safety Testing Market Size (US$ Bn), By Test Method, 2020-2033
Table: 108 India Food Safety Testing Market Size (US$ Bn), By Product Type, 2020-2033
Table: 109 India Food Safety Testing Market Size (US$ Bn), By Technology, 2020-2033
Table: 110 India Food Safety Testing Market Size (US$ Bn), By Service Sourcing, 2020-2033
Table: 111 India Food Safety Testing Market Size (US$ Bn), By End User, 2020-2033
Table: 112 Japan Food Safety Testing Market Size (US$ Bn), By Test Method, 2020-2033
Table: 113 Japan Food Safety Testing Market Size (US$ Bn), By Product Type, 2020-2033
Table: 114 Japan Food Safety Testing Market Size (US$ Bn), By Technology, 2020-2033
Table: 115 Japan Food Safety Testing Market Size (US$ Bn), By Service Sourcing, 2020-2033
Table: 116 Japan Food Safety Testing Market Size (US$ Bn), By End User, 2020-2033
Table: 117 South Korea Food Safety Testing Market Size (US$ Bn), By Test Method, 2020-2033
Table: 118 South Korea Food Safety Testing Market Size (US$ Bn), By Product Type, 2020-2033
Table: 119 South Korea Food Safety Testing Market Size (US$ Bn), By Technology, 2020-2033
Table: 120 South Korea Food Safety Testing Market Size (US$ Bn), By Service Sourcing, 2020-2033
Table: 121 South Korea Food Safety Testing Market Size (US$ Bn), By End User, 2020-2033
Table: 122 Australia & New Zealand Food Safety Testing Market Size (US$ Bn), By Test Method, 2020-2033
Table: 123 Australia & New Zealand Food Safety Testing Market Size (US$ Bn), By Product Type, 2020-2033
Table: 124 Australia & New Zealand Food Safety Testing Market Size (US$ Bn), By Technology, 2020-2033
Table: 125 Australia & New Zealand Food Safety Testing Market Size (US$ Bn), By Service Sourcing, 2020-2033
Table: 126 Australia & New Zealand Food Safety Testing Market Size (US$ Bn), By End User, 2020-2033
Table: 127 ASEAN Food Safety Testing Market Size (US$ Bn), By Country, 2020-2033
Table: 128 ASEAN Food Safety Testing Market Size (US$ Bn), By Test Method, 2020-2033
Table: 129 ASEAN Food Safety Testing Market Size (US$ Bn), By Product Type, 2020-2033
Table: 130 ASEAN Food Safety Testing Market Size (US$ Bn), By Technology, 2020-2033
Table: 131 ASEAN Food Safety Testing Market Size (US$ Bn), By Service Sourcing, 2020-2033
Table: 132 ASEAN Food Safety Testing Market Size (US$ Bn), By End User, 2020-2033
Table: 133 Rest of Asia Pacific Food Safety Testing Market Size (US$ Bn), By Test Method, 2020-2033
Table: 134 Rest of Asia Pacific Food Safety Testing Market Size (US$ Bn), By Product Type, 2020-2033
Table: 135 Rest of Asia Pacific Food Safety Testing Market Size (US$ Bn), By Technology, 2020-2033
Table: 136 Rest of Asia Pacific Food Safety Testing Market Size (US$ Bn), By Service Sourcing, 2020-2033
Table: 137 Rest of Asia Pacific Food Safety Testing Market Size (US$ Bn), By End User, 2020-2033
Table: 138 UAE Food Safety Testing Market Size (US$ Bn), By Test Method, 2020-2033
Table: 139 UAE Food Safety Testing Market Size (US$ Bn), By Product Type, 2020-2033
Table: 140 UAE Food Safety Testing Market Size (US$ Bn), By Technology, 2020-2033
Table: 141 UAE Food Safety Testing Market Size (US$ Bn), By Service Sourcing, 2020-2033
Table: 142 UAE Food Safety Testing Market Size (US$ Bn), By End User, 2020-2033
Table: 143 Saudi Arabia Food Safety Testing Market Size (US$ Bn), By Test Method, 2020-2033
Table: 144 Saudi Arabia Food Safety Testing Market Size (US$ Bn), By Product Type, 2020-2033
Table: 145 Saudi Arabia Food Safety Testing Market Size (US$ Bn), By Technology, 2020-2033
Table: 146 Saudi Arabia Food Safety Testing Market Size (US$ Bn), By Service Sourcing, 2020-2033
Table: 147 Saudi Arabia Food Safety Testing Market Size (US$ Bn), By End User, 2020-2033
Table: 148 South Africa Food Safety Testing Market Size (US$ Bn), By Test Method, 2020-2033
Table: 149 South Africa Food Safety Testing Market Size (US$ Bn), By Product Type, 2020-2033
Table: 150 South Africa Food Safety Testing Market Size (US$ Bn), By Technology, 2020-2033
Table: 151 South Africa Food Safety Testing Market Size (US$ Bn), By Service Sourcing, 2020-2033
Table: 152 South Africa Food Safety Testing Market Size (US$ Bn), By End User, 2020-2033
Table: 153 Rest of Middle East & Africa Food Safety Testing Market Size (US$ Bn), By Test Method, 2020-2033
Table: 154 Rest of Middle East & Africa Food Safety Testing Market Size (US$ Bn), By Product Type, 2020-2033
Table: 155 Rest of Middle East & Africa Food Safety Testing Market Size (US$ Bn), By Technology, 2020-2033
Table: 156 Rest of Middle East & Africa Food Safety Testing Market Size (US$ Bn), By Service Sourcing, 2020-2033
Table: 157 Rest of Middle East & Africa Food Safety Testing Market Size (US$ Bn), By End User, 2020-2033
Table: 158 Argentina Food Safety Testing Market Size (US$ Bn), By Test Method, 2020-2033
Table: 159 Argentina Food Safety Testing Market Size (US$ Bn), By Product Type, 2020-2033
Table: 160 Argentina Food Safety Testing Market Size (US$ Bn), By Technology, 2020-2033
Table: 161 Argentina Food Safety Testing Market Size (US$ Bn), By Service Sourcing, 2020-2033
Table: 162 Argentina Food Safety Testing Market Size (US$ Bn), By End User, 2020-2033
Table: 163 Brazil Food Safety Testing Market Size (US$ Bn), By Test Method, 2020-2033
Table: 164 Brazil Food Safety Testing Market Size (US$ Bn), By Product Type, 2020-2033
Table: 165 Brazil Food Safety Testing Market Size (US$ Bn), By Technology, 2020-2033
Table: 166 Brazil Food Safety Testing Market Size (US$ Bn), By Service Sourcing, 2020-2033
Table: 167 Brazil Food Safety Testing Market Size (US$ Bn), By End User, 2020-2033
Table: 168 Rest of South America Food Safety Testing Market Size (US$ Bn), By Test Method, 2020-2033
Table: 169 Rest of South America Food Safety Testing Market Size (US$ Bn), By Product Type, 2020-2033
Table: 170 Rest of South America Food Safety Testing Market Size (US$ Bn), By Technology, 2020-2033
Table: 171 Rest of South America Food Safety Testing Market Size (US$ Bn), By Service Sourcing, 2020-2033
Table: 172 Rest of South America Food Safety Testing Market Size (US$ Bn), By End User, 2020-2033
Table: 173 ALS: Recent Developments
Table: 174 ALS: Offerings
Table: 175 ALS: Financial Analysis
Table: 176 Biomerieux: Recent Developments
Table: 177 Biomerieux: Offerings
Table: 178 Biomerieux: Financial Analysis
Table: 179 Eurofins Scientific: Recent Developments
Table: 180 Eurofins Scientific: Offerings
Table: 181 Eurofins Scientific: Financial Analysis
Table: 182 Intertek Group plc: Recent Developments
Table: 183 Intertek Group plc: Offerings
Table: 184 Intertek Group plc: Financial Analysis
Table: 185 Merck KgaA: Offerings
Table: 186 Merck KGaA: Financial Analysis
Table: 187 Merieux Nutrisciences: Recent Developments
Table: 188 Merieux Nutrisciences: Offerings
Table: 189 NSF: Recent Developments
Table: 190 NSF: Offerings
Table: 191 SGS Société Générale de Surveillance SA: Recent Developments
Table: 192 SGS Société Générale de Surveillance SA: Offerings
Table: 193 SGS Société Générale de Surveillance SA: Financial Analysis
Table: 194 Symbio Labs: Offerings
Table: 195 Thermo Fisher Scientific Inc.: Recent Developments
Table: 196 Thermo Fisher Scientific Inc.: Products
Table: 197 Thermo Fisher Scientific Inc.: Financial Analysis
Table: 198 TUV SUD: Recent Developments
Table: 199 TUV SUD: Offerings
Table: 200 TUV SUD: Financial Analysis
Table: 201 Other Prominent Players
Table: 202 Annexure: Secondary Sources
Figure: 1 Executive Summary: Global Food Safety Testing Market Size and Forecast, 2020-2033 (US$ Bn)
Figure: 2 Industry Outlook: Share of Global Food & Beverage Market Sub – Segments, 2021
Figure: 3 Industry Outlook: Foodborne Illnesses Cases – By Causes (In Numbers) – Global 2021
Figure: 4 Industry Outlook: % Of Global Total Population Facing Foodborne Related Illnesses And Deaths - 2021
Figure: 5 Opportunity: Organic Food Market (In US$ Bn), 2021
Figure: 6 Covid -19 Impact & Recovery: Global Food Safety Testing Market, Covid-19 Impact & Recovery, 2020-2033 Y-o-Y(%)
Figure: 7 Competitive Dashboard: Market Share Analysis, By Company, Based on Revenue (2024)
Figure: 8 Global Food Safety Testing Market, By Test Method, CAGR (%), 2024-2033
Figure: 9 Global Food Safety Testing Market Share (%), By Test Method, 2024
Figure: 10 Global Food Safety Testing Market Share (%), By Test Method, 2033
Figure: 11 Global Food Safety Testing Market, By Product Type, CAGR (%), 2024-2033
Figure: 12 Global Food Safety Testing Market Share (%), By Product Type, 2024
Figure: 13 Global Food Safety Testing Market Share (%), By Product Type, 2033
Figure: 14 Global Food Safety Testing Market, By Technology, CAGR (%), 2024-2033
Figure: 15 Global Food Safety Testing Market Share (%), By Technology, 2024
Figure: 16 Global Food Safety Testing Market Share (%), By Technology, 2033
Figure: 17 Global Food Safety Testing Market, By Service Sourcing, CAGR (%), 2024-2033
Figure: 18 Global Food Safety Testing Market Share (%), By Service Sourcing, 2024
Figure: 19 Global Food Safety Testing Market Share (%), By Service Sourcing, 2033
Figure: 20 Global Food Safety Testing Market, By End User, CAGR (%), 2024-2033
Figure: 21 Global Food Safety Testing Market Share (%), By End User, 2024
Figure: 22 Global Food Safety Testing Market Share (%), By End User, 2033
Figure: 23 Global Food Safety Testing Market, By Region, CAGR (%), 2024-2033
Figure: 24 Global Food Safety Testing Market Share (%), By Region, 2024
Figure: 25 Global Food Safety Testing Market Share (%), By Region, 2033
Figure: 26 North America: Highest Share (%) Segment
Figure: 27 North America: Net Opportunity Addition, in US$ Bn
Figure: 28 North America: Impact Analysis - Chart
Figure: 29 North America: Opportunity Assessment, By Test Method
Figure: 30 North America: Opportunity Assessment, By Product Type
Figure: 31 North America: Opportunity Assessment, By Technology
Figure: 32 North America: Opportunity Assessment, By Service Sourcing
Figure: 33 North America: Opportunity Assessment, By End User
Figure: 34 North America Food Safety Testing Market Share (%), By Country, 2024
Figure: 35 North America Food Safety Testing Market Share (%), By Country, 2033
Figure: 36 North America Food Safety Testing Market Share (%), By Test Method, 2024
Figure: 37 North America Food Safety Testing Market Share (%), By Test Method, 2033
Figure: 38 North America Food Safety Testing Market Share (%), By Product Type, 2024
Figure: 39 North America Food Safety Testing Market Share (%), By Product Type, 2033
Figure: 40 North America Food Safety Testing Market Share (%), By Technology, 2024
Figure: 41 North America Food Safety Testing Market Share (%), By Technology, 2033
Figure: 42 North America Food Safety Testing Market Share (%), By Service Sourcing, 2024
Figure: 43 North America Food Safety Testing Market Share (%), By Service Sourcing, 2033
Figure: 44 North America Food Safety Testing Market Share (%), By End User, 2024
Figure: 45 North America Food Safety Testing Market Share (%), By End User, 2033
Figure: 46 Europe: Highest Share (%) Segment
Figure: 47 Europe: Net Opportunity Addition, in US$ Bn
Figure: 48 Europe: Impact Analysis - Chart
Figure: 49 Europe: Opportunity Assessment, By Test Method
Figure: 50 Europe: Opportunity Assessment, By Product Type
Figure: 51 Europe: Opportunity Assessment, By Technology
Figure: 52 Europe: Opportunity Assessment, By Service Sourcing
Figure: 53 Europe: Opportunity Assessment, By End User
Figure: 54 Europe Food Safety Testing Market Share (%), By Country, 2024
Figure: 55 Europe Food Safety Testing Market Share (%), By Country, 2033
Figure: 56 Europe Food Safety Testing Market Share (%), By Test Method, 2024
Figure: 57 Europe Food Safety Testing Market Share (%), By Test Method, 2033
Figure: 58 Europe Food Safety Testing Market Share (%), By Product Type, 2024
Figure: 59 Europe Food Safety Testing Market Share (%), By Product Type, 2033
Figure: 60 Europe Food Safety Testing Market Share (%), By Technology, 2024
Figure: 61 Europe Food Safety Testing Market Share (%), By Technology, 2033
Figure: 62 Europe Food Safety Testing Market Share (%), By Service Sourcing, 2024
Figure: 63 Europe Food Safety Testing Market Share (%), By Service Sourcing, 2033
Figure: 64 Europe Food Safety Testing Market Share (%), By End User, 2024
Figure: 65 Europe Food Safety Testing Market Share (%), By End User, 2033
Figure: 66 Asia Pacific: Highest Share (%) Segment
Figure: 67 Asia Pacific: Net Opportunity Addition, in US$ Bn
Figure: 68 Asia Pacific: Impact Analysis - Chart
Figure: 69 Asia Pacific: Opportunity Assessment, By Test Method
Figure: 70 Asia Pacific: Opportunity Assessment, By Product Type
Figure: 71 Asia Pacific: Opportunity Assessment, By Technology
Figure: 72 Asia Pacific: Opportunity Assessment, By Service Sourcing
Figure: 73 Asia Pacific: Opportunity Assessment, By End User
Figure: 74 Asia Pacific Food Safety Testing Market Share (%), By Country, 2024
Figure: 75 Asia Pacific Food Safety Testing Market Share (%), By Country, 2033
Figure: 76 Asia Pacific Food Safety Testing Market Share (%), By Test Method, 2024
Figure: 77 Asia Pacific Food Safety Testing Market Share (%), By Test Method, 2033
Figure: 78 Asia Pacific Food Safety Testing Market Share (%), By Product Type, 2024
Figure: 79 Asia Pacific Food Safety Testing Market Share (%), By Product Type, 2033
Figure: 80 Asia Pacific Food Safety Testing Market Share (%), By Technology, 2024
Figure: 81 Asia Pacific Food Safety Testing Market Share (%), By Technology, 2033
Figure: 82 Asia Pacific Food Safety Testing Market Share (%), By Service Sourcing, 2024
Figure: 83 Asia Pacific Food Safety Testing Market Share (%), By Service Sourcing, 2033
Figure: 84 Asia Pacific Food Safety Testing Market Share (%), By End User, 2024
Figure: 85 Asia Pacific Food Safety Testing Market Share (%), By End User, 2033
Figure: 86 Middle East & America: Highest Share (%) Segment
Figure: 87 Middle East & America: Net Opportunity Addition, in US$ Bn
Figure: 88 Middle East & America: Impact Analysis - Chart
Figure: 89 Middle East & America: Opportunity Assessment, By Test Method
Figure: 90 Middle East & America: Opportunity Assessment, By Product Type
Figure: 91 Middle East & America: Opportunity Assessment, By Technology
Figure: 92 Middle East & America: Opportunity Assessment, By Service Sourcing
Figure: 93 Middle East & America: Opportunity Assessment, By End User
Figure: 94 Middle East & America Food Safety Testing Market Share (%), By Country, 2024
Figure: 95 Middle East & America Food Safety Testing Market Share (%), By Country, 2033
Figure: 96 Middle East & America Food Safety Testing Market Share (%), By Test Method, 2024
Figure: 97 Middle East & America Food Safety Testing Market Share (%), By Test Method, 2033
Figure: 98 Middle East & America Food Safety Testing Market Share (%), By Product Type, 2024
Figure: 99 Middle East & America Food Safety Testing Market Share (%), By Product Type, 2033
Figure: 100 Middle East & America Food Safety Testing Market Share (%), By Technology, 2024
Figure: 101 Middle East & America Food Safety Testing Market Share (%), By Technology, 2033
Figure: 102 Middle East & America Food Safety Testing Market Share (%), By Service Sourcing, 2024
Figure: 103 Middle East & America Food Safety Testing Market Share (%), By Service Sourcing, 2033
Figure: 104 Middle East & America Food Safety Testing Market Share (%), By End User, 2024
Figure: 105 Middle East & America Food Safety Testing Market Share (%), By End User, 2033
Figure: 106 South America: Highest Share (%) Segment
Figure: 107 South America: Net Opportunity Addition, in US$ Bn
Figure: 108 South America: Impact Analysis - Chart
Figure: 109 South America: Opportunity Assessment, By Test Method
Figure: 110 South America: Opportunity Assessment, By Product Type
Figure: 111 South America: Opportunity Assessment, By Technology
Figure: 112 South America: Opportunity Assessment, By Service Sourcing
Figure: 113 South America: Opportunity Assessment, By End User
Figure: 114 South America Food Safety Testing Market Share (%), By Country, 2024
Figure: 115 South America Food Safety Testing Market Share (%), By Country, 2033
Figure: 116 South America Food Safety Testing Market Share (%), By Test Method, 2024
Figure: 117 South America Food Safety Testing Market Share (%), By Test Method, 2033
Figure: 118 South America Food Safety Testing Market Share (%), By Product Type, 2024
Figure: 119 South America Food Safety Testing Market Share (%), By Product Type, 2033
Figure: 120 South America Food Safety Testing Market Share (%), By Technology, 2024
Figure: 121 South America Food Safety Testing Market Share (%), By Technology, 2033
Figure: 122 South America Food Safety Testing Market Share (%), By Service Sourcing, 2024
Figure: 123 South America Food Safety Testing Market Share (%), By Service Sourcing, 2033
Figure: 124 South America Food Safety Testing Market Share (%), By End User, 2024
Figure: 125 South America Food Safety Testing Market Share (%), By End User, 2033
Figure: 126 US: Highest Share (%) Segment
Figure: 127 US: Net Opportunity Addition, in US$ Bn
Figure: 128 US: Impact Analysis - Chart
Figure: 129 US: Opportunity Assessment, By Test Method
Figure: 130 US: Opportunity Assessment, By Product Type
Figure: 131 US: Opportunity Assessment, By Technology
Figure: 132 US: Opportunity Assessment, By Service Sourcing
Figure: 133 US: Opportunity Assessment, By End User
Figure: 134 US Food Safety Testing Market Share (%), By Test Method, 2024
Figure: 135 US Food Safety Testing Market Share (%), By Test Method, 2033
Figure: 136 US Food Safety Testing Market Share (%), By Product Type, 2024
Figure: 137 US Food Safety Testing Market Share (%), By Product Type, 2033
Figure: 138 US Food Safety Testing Market Share (%), By Technology, 2024
Figure: 139 US Food Safety Testing Market Share (%), By Technology, 2033
Figure: 140 US Food Safety Testing Market Share (%), By Service Sourcing, 2024
Figure: 141 US Food Safety Testing Market Share (%), By Service Sourcing, 2033
Figure: 142 US Food Safety Testing Market Share (%), By End User, 2024
Figure: 143 US Food Safety Testing Market Share (%), By End User, 2033
Figure: 144 Canada: Highest Share (%) Segment
Figure: 145 Canada: Net Opportunity Addition, in US$ Bn
Figure: 146 Canada: Impact Analysis - Chart
Figure: 147 Canada: Opportunity Assessment, By Test Method
Figure: 148 Canada: Opportunity Assessment, By Product Type
Figure: 149 Canada: Opportunity Assessment, By Technology
Figure: 150 Canada: Opportunity Assessment, By Service Sourcing
Figure: 151 Canada: Opportunity Assessment, By End User
Figure: 152 Canada Food Safety Testing Market Share (%), By Test Method, 2024
Figure: 153 Canada Food Safety Testing Market Share (%), By Test Method, 2033
Figure: 154 Canada Food Safety Testing Market Share (%), By Product Type, 2024
Figure: 155 Canada Food Safety Testing Market Share (%), By Product Type, 2033
Figure: 156 Canada Food Safety Testing Market Share (%), By Technology, 2024
Figure: 157 Canada Food Safety Testing Market Share (%), By Technology, 2033
Figure: 158 Canada Food Safety Testing Market Share (%), By Service Sourcing, 2024
Figure: 159 Canada Food Safety Testing Market Share (%), By Service Sourcing, 2033
Figure: 160 Canada Food Safety Testing Market Share (%), By End User, 2024
Figure: 161 Canada Food Safety Testing Market Share (%), By End User, 2033
Figure: 162 Mexico: Highest Share (%) Segment
Figure: 163 Mexico: Net Opportunity Addition, in US$ Bn
Figure: 164 Mexico: Impact Analysis - Chart
Figure: 165 Mexico: Opportunity Assessment, By Test Method
Figure: 166 Mexico: Opportunity Assessment, By Product Type
Figure: 167 Mexico: Opportunity Assessment, By Technology
Figure: 168 Mexico: Opportunity Assessment, By Service Sourcing
Figure: 169 Mexico: Opportunity Assessment, By End User
Figure: 170 Mexico Food Safety Testing Market Share (%), By Test Method, 2024
Figure: 171 Mexico Food Safety Testing Market Share (%), By Test Method, 2033
Figure: 172 Mexico Food Safety Testing Market Share (%), By Product Type, 2024
Figure: 173 Mexico Food Safety Testing Market Share (%), By Product Type, 2033
Figure: 174 Mexico Food Safety Testing Market Share (%), By Technology, 2024
Figure: 175 Mexico Food Safety Testing Market Share (%), By Technology, 2033
Figure: 176 Mexico Food Safety Testing Market Share (%), By Service Sourcing, 2024
Figure: 177 Mexico Food Safety Testing Market Share (%), By Service Sourcing, 2033
Figure: 178 Mexico Food Safety Testing Market Share (%), By End User, 2024
Figure: 179 Mexico Food Safety Testing Market Share (%), By End User, 2033
Figure: 180 UK: Highest Share (%) Segment
Figure: 181 UK: Net Opportunity Addition, in US$ Bn
Figure: 182 UK: Impact Analysis - Chart
Figure: 183 UK: Opportunity Assessment, By Test Method
Figure: 184 UK: Opportunity Assessment, By Product Type
Figure: 185 UK: Opportunity Assessment, By Technology
Figure: 186 UK: Opportunity Assessment, By Service Sourcing
Figure: 187 UK: Opportunity Assessment, By End User
Figure: 188 UK Food Safety Testing Market Share (%), By Test Method, 2024
Figure: 189 UK Food Safety Testing Market Share (%), By Test Method, 2033
Figure: 190 UK Food Safety Testing Market Share (%), By Product Type, 2024
Figure: 191 UK Food Safety Testing Market Share (%), By Product Type, 2033
Figure: 192 UK Food Safety Testing Market Share (%), By Technology, 2024
Figure: 193 UK Food Safety Testing Market Share (%), By Technology, 2033
Figure: 194 UK Food Safety Testing Market Share (%), By Service Sourcing, 2024
Figure: 195 UK Food Safety Testing Market Share (%), By Service Sourcing, 2033
Figure: 196 UK Food Safety Testing Market Share (%), By End User, 2024
Figure: 197 UK Food Safety Testing Market Share (%), By End User, 2033
Figure: 198 Germany: Highest Share (%) Segment
Figure: 199 Germany: Net Opportunity Addition, in US$ Bn
Figure: 200 Germany: Impact Analysis - Chart
Figure: 201 Germany: Opportunity Assessment, By Test Method
Figure: 202 Germany: Opportunity Assessment, By Product Type
Figure: 203 Germany: Opportunity Assessment, By Technology
Figure: 204 Germany: Opportunity Assessment, By Service Sourcing
Figure: 205 Germany: Opportunity Assessment, By End User
Figure: 206 Germany Food Safety Testing Market Share (%), By Test Method, 2024
Figure: 207 Germany Food Safety Testing Market Share (%), By Test Method, 2033
Figure: 208 Germany Food Safety Testing Market Share (%), By Product Type, 2024
Figure: 209 Germany Food Safety Testing Market Share (%), By Product Type, 2033
Figure: 210 Germany Food Safety Testing Market Share (%), By Technology, 2024
Figure: 211 Germany Food Safety Testing Market Share (%), By Technology, 2033
Figure: 212 Germany Food Safety Testing Market Share (%), By Service Sourcing, 2024
Figure: 213 Germany Food Safety Testing Market Share (%), By Service Sourcing, 2033
Figure: 214 Germany Food Safety Testing Market Share (%), By End User, 2024
Figure: 215 Germany Food Safety Testing Market Share (%), By End U France: Highest Share (%) Segment
Figure: 216 France: Net Opportunity Addition, in US$ Bn
Figure: 217 France: Impact Analysis - Chart
Figure: 218 France: Opportunity Assessment, By Test Method
Figure: 219 France: Opportunity Assessment, By Product Type
Figure: 220 France: Opportunity Assessment, By Technology
Figure: 221 France: Opportunity Assessment, By Service Sourcing
Figure: 222 France: Opportunity Assessment, By End User
Figure: 223 France Food Safety Testing Market Share (%), By Test Method, 2024
Figure: 224 France Food Safety Testing Market Share (%), By Test Method, 2033
Figure: 225 France Food Safety Testing Market Share (%), By Product Type, 2024
Figure: 226 France Food Safety Testing Market Share (%), By Product Type, 2033
Figure: 227 France Food Safety Testing Market Share (%), By Technology, 2024
Figure: 228 France Food Safety Testing Market Share (%), By Technology, 2033
Figure: 229 France Food Safety Testing Market Share (%), By Service Sourcing, 2024
Figure: 230 France Food Safety Testing Market Share (%), By Service Sourcing, 2033
Figure: 231 France Food Safety Testing Market Share (%), By End User, 2024
Figure: 232 France Food Safety Testing Market Share (%), By End User, 2033
Figure: 233 Italy: Highest Share (%) Segment
Figure: 234 Italy: Net Opportunity Addition, in US$ Bn
Figure: 235 Italy: Impact Analysis - Chart
Figure: 236 Italy: Opportunity Assessment, By Test Method
Figure: 237 Italy: Opportunity Assessment, By Product Type
Figure: 238 Italy: Opportunity Assessment, By Technology
Figure: 239 Italy: Opportunity Assessment, By Service Sourcing
Figure: 240 Italy: Opportunity Assessment, By End User
Figure: 241 Italy Food Safety Testing Market Share (%), By Test Method, 2024
Figure: 242 Italy Food Safety Testing Market Share (%), By Test Method, 2033
Figure: 243 Italy Food Safety Testing Market Share (%), By Product Type, 2024
Figure: 244 Italy Food Safety Testing Market Share (%), By Product Type, 2033
Figure: 245 Italy Food Safety Testing Market Share (%), By Technology, 2024
Figure: 246 Italy Food Safety Testing Market Share (%), By Technology, 2033
Figure: 247 Italy Food Safety Testing Market Share (%), By Service Sourcing, 2024
Figure: 248 Italy Food Safety Testing Market Share (%), By Service Sourcing, 2033
Figure: 249 Italy Food Safety Testing Market Share (%), By End User, 2024
Figure: 250 Italy Food Safety Testing Market Share (%), By End User, 2033
Figure: 251 Spain: Highest Share (%) Segment
Figure: 252 Spain: Net Opportunity Addition, in US$ Bn
Figure: 253 Spain: Impact Analysis - Chart
Figure: 254 Spain: Opportunity Assessment, By Test Method
Figure: 255 Spain: Opportunity Assessment, By Product Type
Figure: 256 Spain: Opportunity Assessment, By Technology
Figure: 257 Spain: Opportunity Assessment, By Service Sourcing
Figure: 258 Spain: Opportunity Assessment, By End User
Figure: 259 Spain Food Safety Testing Market Share (%), By Test Method, 2024
Figure: 260 Spain Food Safety Testing Market Share (%), By Test Method, 2033
Figure: 261 Spain Food Safety Testing Market Share (%), By Product Type, 2024
Figure: 262 Spain Food Safety Testing Market Share (%), By Product Type, 2033
Figure: 263 Spain Food Safety Testing Market Share (%), By Technology, 2024
Figure: 264 Spain Food Safety Testing Market Share (%), By Technology, 2033
Figure: 265 Spain Food Safety Testing Market Share (%), By Service Sourcing, 2024
Figure: 266 Spain Food Safety Testing Market Share (%), By Service Sourcing, 2033
Figure: 267 Spain Food Safety Testing Market Share (%), By End User, 2024
Figure: 268 Spain Food Safety Testing Market Share (%), By End User, 2033
Figure: 269 Poland: Highest Share (%) Segment
Figure: 270 Poland: Net Opportunity Addition, in US$ Bn
Figure: 271 Poland: Impact Analysis - Chart
Figure: 272 Poland: Opportunity Assessment, By Test Method
Figure: 273 Poland: Opportunity Assessment, By Product Type
Figure: 274 Poland: Opportunity Assessment, By Technology
Figure: 275 Poland: Opportunity Assessment, By Service Sourcing
Figure: 276 Poland: Opportunity Assessment, By End User
Figure: 277 Poland Food Safety Testing Market Share (%), By Test Method, 2024
Figure: 278 Poland Food Safety Testing Market Share (%), By Test Method, 2033
Figure: 279 Poland Food Safety Testing Market Share (%), By Product Type, 2024
Figure: 280 Poland Food Safety Testing Market Share (%), By Product Type, 2033
Figure: 281 Poland Food Safety Testing Market Share (%), By Technology, 2024
Figure: 282 Poland Food Safety Testing Market Share (%), By Technology, 2033
Figure: 283 Poland Food Safety Testing Market Share (%), By Service Sourcing, 2024
Figure: 284 Poland Food Safety Testing Market Share (%), By Service Sourcing, 2033
Figure: 285 Poland Food Safety Testing Market Share (%), By End User, 2024
Figure: 286 Poland Food Safety Testing Market Share (%), By End User, 2033
Figure: 287 Russia: Highest Share (%) Segment
Figure: 288 Russia: Net Opportunity Addition, in US$ Bn
Figure: 289 Russia: Impact Analysis - Chart
Figure: 290 Russia: Opportunity Assessment, By Test Method
Figure: 291 Russia: Opportunity Assessment, By Product Type
Figure: 292 Russia: Opportunity Assessment, By Technology
Figure: 293 Russia: Opportunity Assessment, By Service Sourcing
Figure: 294 Russia: Opportunity Assessment, By End User
Figure: 295 Russia Food Safety Testing Market Share (%), By Test Method, 2024
Figure: 296 Russia Food Safety Testing Market Share (%), By Test Method, 2033
Figure: 297 Russia Food Safety Testing Market Share (%), By Product Type, 2024
Figure: 298 Russia Food Safety Testing Market Share (%), By Product Type, 2033
Figure: 299 Russia Food Safety Testing Market Share (%), By Technology, 2024
Figure: 300 Russia Food Safety Testing Market Share (%), By Technology, 2033
Figure: 301 Russia Food Safety Testing Market Share (%), By Service Sourcing, 2024
Figure: 302 Russia Food Safety Testing Market Share (%), By Service Sourcing, 2033
Figure: 303 Russia Food Safety Testing Market Share (%), By End User, 2024
Figure: 304 Russia Food Safety Testing Market Share (%), By End User, 2033
Figure: 305 Rest of Europe: Highest Share (%) Segment
Figure: 306 Rest of Europe: Net Opportunity Addition, in US$ Bn
Figure: 307 Rest of Europe: Impact Analysis - Chart
Figure: 308 Rest of Europe: Opportunity Assessment, By Test Method
Figure: 309 Rest of Europe: Opportunity Assessment, By Product Type
Figure: 310 Rest of Europe: Opportunity Assessment, By Technology
Figure: 311 Rest of Europe: Opportunity Assessment, By Service Sourcing
Figure: 312 Rest of Europe: Opportunity Assessment, By End User
Figure: 313 Rest of Europe Food Safety Testing Market Share (%), By Test Method, 2024
Figure: 314 Rest of Europe Food Safety Testing Market Share (%), By Test Method, 2033
Figure: 315 Rest of Europe Food Safety Testing Market Share (%), By Product Type, 2024
Figure: 316 Rest of Europe Food Safety Testing Market Share (%), By Product Type, 2033
Figure: 317 Rest of Europe Food Safety Testing Market Share (%), By Technology, 2024
Figure: 318 Rest of Europe Food Safety Testing Market Share (%), By Technology, 2033
Figure: 319 Rest of Europe Food Safety Testing Market Share (%), By Service Sourcing, 2024
Figure: 320 Rest of Europe Food Safety Testing Market Share (%), By Service Sourcing, 2033
Figure: 321 Rest of Europe Food Safety Testing Market Share (%), By End User, 2024
Figure: 322 Rest of Europe Food Safety Testing Market Share (%), By End User, 2033
Figure: 323 China: Highest Share (%) Segment
Figure: 324 China: Net Opportunity Addition, in US$ Bn
Figure: 325 China: Impact Analysis - Chart
Figure: 326 China: Opportunity Assessment, By Test Method
Figure: 327 China: Opportunity Assessment, By Product Type
Figure: 328 China: Opportunity Assessment, By Technology
Figure: 329 China: Opportunity Assessment, By Service Sourcing
Figure: 330 China: Opportunity Assessment, By End User
Figure: 331 China Food Safety Testing Market Share (%), By Test Method, 2024
Figure: 332 China Food Safety Testing Market Share (%), By Test Method, 2033
Figure: 333 China Food Safety Testing Market Share (%), By Product Type, 2024
Figure: 334 China Food Safety Testing Market Share (%), By Product Type, 2033
Figure: 335 China Food Safety Testing Market Share (%), By Technology, 2024
Figure: 336 China Food Safety Testing Market Share (%), By Technology, 2033
Figure: 337 China Food Safety Testing Market Share (%), By Service Sourcing, 2024
Figure: 338 China Food Safety Testing Market Share (%), By Service Sourcing, 2033
Figure: 339 China Food Safety Testing Market Share (%), By End User, 2024
Figure: 340 China Food Safety Testing Market Share (%), By End User, 2033
Figure: 341 India: Highest Share (%) Segment
Figure: 342 India: Net Opportunity Addition, in US$ Bn
Figure: 343 India: Impact Analysis - Chart
Figure: 344 India: Opportunity Assessment, By Test Method
Figure: 345 India: Opportunity Assessment, By Product Type
Figure: 346 India: Opportunity Assessment, By Technology
Figure: 347 India: Opportunity Assessment, By Service Sourcing
Figure: 348 India: Opportunity Assessment, By End User
Figure: 349 India Food Safety Testing Market Share (%), By Test Method, 2024
Figure: 350 India Food Safety Testing Market Share (%), By Test Method, 2033
Figure: 351 India Food Safety Testing Market Share (%), By Product Type, 2024
Figure: 352 India Food Safety Testing Market Share (%), By Product Type, 2033
Figure: 353 India Food Safety Testing Market Share (%), By Technology, 2024
Figure: 354 India Food Safety Testing Market Share (%), By Technology, 2033
Figure: 355 India Food Safety Testing Market Share (%), By Service Sourcing, 2024
Figure: 356 India Food Safety Testing Market Share (%), By Service Sourcing, 2033
Figure: 357 India Food Safety Testing Market Share (%), By End User, 2024
Figure: 358 India Food Safety Testing Market Share (%), By End User, 2033
Figure: 359 Japan: Highest Share (%) Segment
Figure: 360 Japan: Net Opportunity Addition, in US$ Bn
Figure: 361 Japan: Impact Analysis - Chart
Figure: 362 Japan: Opportunity Assessment, By Test Method
Figure: 363 Japan: Opportunity Assessment, By Product Type
Figure: 364 Japan: Opportunity Assessment, By Technology
Figure: 365 Japan: Opportunity Assessment, By Service Sourcing
Figure: 366 Japan: Opportunity Assessment, By End User
Figure: 367 Japan Food Safety Testing Market Share (%), By Test Method, 2024
Figure: 368 Japan Food Safety Testing Market Share (%), By Test Method, 2033
Figure: 369 Japan Food Safety Testing Market Share (%), By Product Type, 2024
Figure: 370 Japan Food Safety Testing Market Share (%), By Product Type, 2033
Figure: 371 Japan Food Safety Testing Market Share (%), By Technology, 2024
Figure: 372 Japan Food Safety Testing Market Share (%), By Technology, 2033
Figure: 373 Japan Food Safety Testing Market Share (%), By Service Sourcing, 2024
Figure: 374 Japan Food Safety Testing Market Share (%), By Service Sourcing, 2033
Figure: 375 Japan Food Safety Testing Market Share (%), By End User, 2024
Figure: 376 Japan Food Safety Testing Market Share (%), By End User, 2033
Figure: 377 South Korea: Highest Share (%) Segment
Figure: 378 South Korea: Net Opportunity Addition, in US$ Bn
Figure: 379 South Korea: Impact Analysis - Chart
Figure: 380 South Korea: Opportunity Assessment, By Test Method
Figure: 381 South Korea: Opportunity Assessment, By Product Type
Figure: 382 South Korea: Opportunity Assessment, By Technology
Figure: 383 South Korea: Opportunity Assessment, By Service Sourcing
Figure: 384 South Korea: Opportunity Assessment, By End User
Figure: 385 South Korea Food Safety Testing Market Share (%), By Test Method, 2024
Figure: 386 South Korea Food Safety Testing Market Share (%), By Test Method, 2033
Figure: 387 South Korea Food Safety Testing Market Share (%), By Product Type, 2024
Figure: 388 South Korea Food Safety Testing Market Share (%), By Product Type, 2033
Figure: 389 South Korea Food Safety Testing Market Share (%), By Technology, 2024
Figure: 390 South Korea Food Safety Testing Market Share (%), By Technology, 2033
Figure: 391 South Korea Food Safety Testing Market Share (%), By Service Sourcing, 2024
Figure: 392 South Korea Food Safety Testing Market Share (%), By Service Sourcing, 2033
Figure: 393 South Korea Food Safety Testing Market Share (%), By End User, 2024
Figure: 394 South Korea Food Safety Testing Market Share (%), By End User, 2033
Figure: 395 Australia & New Zealand: Highest Share (%) Segment
Figure: 396 Australia & New Zealand: Net Opportunity Addition, in US$ Bn
Figure: 397 Australia & New Zealand: Impact Analysis - Chart
Figure: 398 Australia & New Zealand: Opportunity Assessment, By Test Method
Figure: 399 Australia & New Zealand: Opportunity Assessment, By Product Type
Figure: 400 Australia & New Zealand: Opportunity Assessment, By Technology
Figure: 401 Australia & New Zealand: Opportunity Assessment, By Service Sourcing
Figure: 402 Australia & New Zealand: Opportunity Assessment, By End User
Figure: 403 Australia & New Zealand Food Safety Testing Market Share (%), By Test Method, 2024
Figure: 404 Australia & New Zealand Food Safety Testing Market Share (%), By Test Method, 2033
Figure: 405 Australia & New Zealand Food Safety Testing Market Share (%), By Product Type, 2024
Figure: 406 Australia & New Zealand Food Safety Testing Market Share (%), By Product Type, 2033
Figure: 407 Australia & New Zealand Food Safety Testing Market Share (%), By Technology, 2024
Figure: 408 Australia & New Zealand Food Safety Testing Market Share (%), By Technology, 2033
Figure: 409 Australia & New Zealand Food Safety Testing Market Share (%), By Service Sourcing, 2024
Figure: 410 Australia & New Zealand Food Safety Testing Market Share (%), By Service Sourcing, 2033
Figure: 411 Australia & New Zealand Food Safety Testing Market Share (%), By End User, 2024
Figure: 412 Australia & New Zealand Food Safety Testing Market Share (%), By End User, 2033
Figure: 413 ASEAN: Highest Share (%) Segment
Figure: 414 ASEAN: Net Opportunity Addition, in US$ Bn
Figure: 415 ASEAN: Impact Analysis - Chart
Figure: 416 ASEAN: Opportunity Assessment, By Test Method
Figure: 417 ASEAN: Opportunity Assessment, By Product Type
Figure: 418 ASEAN: Opportunity Assessment, By Technology
Figure: 419 ASEAN: Opportunity Assessment, By Service Sourcing
Figure: 420 ASEAN: Opportunity Assessment, By End User
Figure: 421 ASEAN Food Safety Testing Market Share (%), By Country, 2024
Figure: 422 ASEAN Food Safety Testing Market Share (%), By Country, 2033
Figure: 423 ASEAN Food Safety Testing Market Share (%), By Test Method, 2024
Figure: 424 ASEAN Food Safety Testing Market Share (%), By Test Method, 2033
Figure: 425 ASEAN Food Safety Testing Market Share (%), By Product Type, 2024
Figure: 426 ASEAN Food Safety Testing Market Share (%), By Product Type, 2033
Figure: 427 ASEAN Food Safety Testing Market Share (%), By Technology, 2024
Figure: 428 ASEAN Food Safety Testing Market Share (%), By Technology, 2033
Figure: 429 ASEAN Food Safety Testing Market Share (%), By Service Sourcing, 2024
Figure: 430 ASEAN Food Safety Testing Market Share (%), By Service Sourcing, 2033
Figure: 431 ASEAN Food Safety Testing Market Share (%), By End User, 2024
Figure: 432 ASEAN Food Safety Testing Market Share (%), By End User, 2033
Figure: 433 Rest of Asia Pacific: Highest Share (%) Segment
Figure: 434 Rest of Asia Pacific: Net Opportunity Addition, in US$ Bn
Figure: 435 Rest of Asia Pacific: Impact Analysis - Chart
Figure: 436 Rest of Asia Pacific: Opportunity Assessment, By Test Method
Figure: 437 Rest of Asia Pacific: Opportunity Assessment, By Product Type
Figure: 438 Rest of Asia Pacific: Opportunity Assessment, By Technology
Figure: 439 Rest of Asia Pacific: Opportunity Assessment, By Service Sourcing
Figure: 440 Rest of Asia Pacific: Opportunity Assessment, By End User
Figure: 441 Rest of Asia Pacific Food Safety Testing Market Share (%), By Test Method, 2024
Figure: 442 Rest of Asia Pacific Food Safety Testing Market Share (%), By Test Method, 2033
Figure: 443 Rest of Asia Pacific Food Safety Testing Market Share (%), By Product Type, 2024
Figure: 444 Rest of Asia Pacific Food Safety Testing Market Share (%), By Product Type, 2033
Figure: 445 Rest of Asia Pacific Food Safety Testing Market Share (%), By Technology, 2024
Figure: 446 Rest of Asia Pacific Food Safety Testing Market Share (%), By Technology, 2033
Figure: 447 Rest of Asia Pacific Food Safety Testing Market Share (%), By Service Sourcing, 2024
Figure: 448 Rest of Asia Pacific Food Safety Testing Market Share (%), By Service Sourcing, 2033
Figure: 449 Rest of Asia Pacific Food Safety Testing Market Share (%), By End User, 2024
Figure: 450 Rest of Asia Pacific Food Safety Testing Market Share (%), By End User, 2033
Figure: 451 UAE: Highest Share (%) Segment
Figure: 452 UAE: Net Opportunity Addition, in US$ Bn
Figure: 453 UAE: Impact Analysis - Chart
Figure: 454 UAE: Opportunity Assessment, By Test Method
Figure: 455 UAE: Opportunity Assessment, By Product Type
Figure: 456 UAE: Opportunity Assessment, By Technology
Figure: 457 UAE: Opportunity Assessment, By Service Sourcing
Figure: 458 UAE: Opportunity Assessment, By End User
Figure: 459 UAE Food Safety Testing Market Share (%), By Test Method, 2024
Figure: 460 UAE Food Safety Testing Market Share (%), By Test Method, 2033
Figure: 461 UAE Food Safety Testing Market Share (%), By Product Type, 2024
Figure: 462 UAE Food Safety Testing Market Share (%), By Product Type, 2033
Figure: 463 UAE Food Safety Testing Market Share (%), By Technology, 2024
Figure: 464 UAE Food Safety Testing Market Share (%), By Technology, 2033
Figure: 465 UAE Food Safety Testing Market Share (%), By Service Sourcing, 2024
Figure: 466 UAE Food Safety Testing Market Share (%), By Service Sourcing, 2033
Figure: 467 UAE Food Safety Testing Market Share (%), By End User, 2024
Figure: 468 UAE Food Safety Testing Market Share (%), By End User, 2033
Figure: 469 Saudi Arabia: Highest Share (%) Segment
Figure: 470 Saudi Arabia: Net Opportunity Addition, in US$ Bn
Figure: 471 Saudi Arabia: Impact Analysis - Chart
Figure: 472 Saudi Arabia: Opportunity Assessment, By Test Method
Figure: 473 Saudi Arabia: Opportunity Assessment, By Product Type
Figure: 474 Saudi Arabia: Opportunity Assessment, By Technology
Figure: 475 Saudi Arabia: Opportunity Assessment, By Service Sourcing
Figure: 476 Saudi Arabia: Opportunity Assessment, By End User
Figure: 477 Saudi Arabia Food Safety Testing Market Share (%), By Test Method, 2024
Figure: 478 Saudi Arabia Food Safety Testing Market Share (%), By Test Method, 2033
Figure: 479 Saudi Arabia Food Safety Testing Market Share (%), By Product Type, 2024
Figure: 480 Saudi Arabia Food Safety Testing Market Share (%), By Product Type, 2033
Figure: 481 Saudi Arabia Food Safety Testing Market Share (%), By Technology, 2024
Figure: 482 Saudi Arabia Food Safety Testing Market Share (%), By Technology, 2033
Figure: 483 Saudi Arabia Food Safety Testing Market Share (%), By Service Sourcing, 2024
Figure: 484 Saudi Arabia Food Safety Testing Market Share (%), By Service Sourcing, 2033
Figure: 485 Saudi Arabia Food Safety Testing Market Share (%), By End User, 2024
Figure: 486 Saudi Arabia Food Safety Testing Market Share (%), By End User, 2033
Figure: 487 South Africa: Highest Share (%) Segment
Figure: 488 South Africa: Net Opportunity Addition, in US$ Bn
Figure: 489 South Africa: Impact Analysis - Chart
Figure: 490 South Africa: Opportunity Assessment, By Test Method
Figure: 491 South Africa: Opportunity Assessment, By Product Type
Figure: 492 South Africa: Opportunity Assessment, By Technology
Figure: 493 South Africa: Opportunity Assessment, By Service Sourcing
Figure: 494 South Africa: Opportunity Assessment, By End User
Figure: 495 South Africa Food Safety Testing Market Share (%), By Test Method, 2024
Figure: 496 South Africa Food Safety Testing Market Share (%), By Test Method, 2033
Figure: 497 South Africa Food Safety Testing Market Share (%), By Product Type, 2024
Figure: 498 South Africa Food Safety Testing Market Share (%), By Product Type, 2033
Figure: 499 South Africa Food Safety Testing Market Share (%), By Technology, 2024
Figure: 500 South Africa Food Safety Testing Market Share (%), By Technology, 2033
Figure: 501 South Africa Food Safety Testing Market Share (%), By Service Sourcing, 2024
Figure: 502 South Africa Food Safety Testing Market Share (%), By Service Sourcing, 2033
Figure: 503 South Africa Food Safety Testing Market Share (%), By End User, 2024
Figure: 504 South Africa Food Safety Testing Market Share (%), By End User, 2033
Figure: 505 Rest of Middle East & Africa: Highest Share (%) Segment
Figure: 506 Rest of Middle East & Africa: Net Opportunity Addition, in US$ Bn
Figure: 507 Rest of Middle East & Africa: Impact Analysis - Chart
Figure: 508 Rest of Middle East & Africa: Opportunity Assessment, By Test Method
Figure: 509 Rest of Middle East & Africa: Opportunity Assessment, By Product Type
Figure: 510 Rest of Middle East & Africa: Opportunity Assessment, By Technology
Figure: 511 Rest of Middle East & Africa: Opportunity Assessment, By Service Sourcing
Figure: 512 Rest of Middle East & Africa: Opportunity Assessment, By End User
Figure: 513 Rest of Middle East & Africa Food Safety Testing Market Share (%), By Test Method, 2024
Figure: 514 Rest of Middle East & Africa Food Safety Testing Market Share (%), By Test Method, 2033
Figure: 515 Rest of Middle East & Africa Food Safety Testing Market Share (%), By Product Type, 2024
Figure: 516 Rest of Middle East & Africa Food Safety Testing Market Share (%), By Product Type, 2033
Figure: 517 Rest of Middle East & Africa Food Safety Testing Market Share (%), By Technology, 2024
Figure: 518 Rest of Middle East & Africa Food Safety Testing Market Share (%), By Technology, 2033
Figure: 519 Rest of Middle East & Africa Food Safety Testing Market Share (%), By Service Sourcing, 2024
Figure: 520 Rest of Middle East & Africa Food Safety Testing Market Share (%), By Service Sourcing, 2033
Figure: 521 Rest of Middle East & Africa Food Safety Testing Market Share (%), By End User, 2024
Figure: 522 Rest of Middle East & Africa Food Safety Testing Market Share (%), By End User, 2033
Figure: 523 Argentina: Highest Share (%) Segment
Figure: 524 Argentina: Net Opportunity Addition, in US$ Bn
Figure: 525 Argentina: Impact Analysis - Chart
Figure: 526 Argentina: Opportunity Assessment, By Test Method
Figure: 527 Argentina: Opportunity Assessment, By Product Type
Figure: 528 Argentina: Opportunity Assessment, By Technology
Figure: 529 Argentina: Opportunity Assessment, By Service Sourcing
Figure: 530 Argentina: Opportunity Assessment, By End User
Figure: 531 Argentina Food Safety Testing Market Share (%), By Test Method, 2024
Figure: 532 Argentina Food Safety Testing Market Share (%), By Test Method, 2033
Figure: 533 Argentina Food Safety Testing Market Share (%), By Product Type, 2024
Figure: 534 Argentina Food Safety Testing Market Share (%), By Product Type, 2033
Figure: 535 Argentina Food Safety Testing Market Share (%), By Technology, 2024
Figure: 536 Argentina Food Safety Testing Market Share (%), By Technology, 2033
Figure: 537 Argentina Food Safety Testing Market Share (%), By Service Sourcing, 2024
Figure: 538 Argentina Food Safety Testing Market Share (%), By Service Sourcing, 2033
Figure: 539 Argentina Food Safety Testing Market Share (%), By End User, 2024
Figure: 540 Argentina Food Safety Testing Market Share (%), By End User, 2033
Figure: 541 Brazil: Highest Share (%) Segment
Figure: 542 Brazil: Net Opportunity Addition, in US$ Bn
Figure: 543 Brazil: Impact Analysis - Chart
Figure: 544 Brazil: Opportunity Assessment, By Test Method
Figure: 545 Brazil: Opportunity Assessment, By Product Type
Figure: 546 Brazil: Opportunity Assessment, By Technology
Figure: 547 Brazil: Opportunity Assessment, By Service Sourcing
Figure: 548 Brazil: Opportunity Assessment, By End User
Figure: 549 Brazil Food Safety Testing Market Share (%), By Test Method, 2024
Figure: 550 Brazil Food Safety Testing Market Share (%), By Test Method, 2033
Figure: 551 Brazil Food Safety Testing Market Share (%), By Product Type, 2024
Figure: 552 Brazil Food Safety Testing Market Share (%), By Product Type, 2033
Figure: 553 Brazil Food Safety Testing Market Share (%), By Technology, 2024
Figure: 554 Brazil Food Safety Testing Market Share (%), By Technology, 2033
Figure: 555 Brazil Food Safety Testing Market Share (%), By Service Sourcing, 2024
Figure: 556 Brazil Food Safety Testing Market Share (%), By Service Sourcing, 2033
Figure: 557 Brazil Food Safety Testing Market Share (%), By End User, 2024
Figure: 558 Brazil Food Safety Testing Market Share (%), By End User, 2033
Figure: 559 Rest of South America: Highest Share (%) Segment
Figure: 560 Rest of South America: Net Opportunity Addition, in US$ Bn
Figure: 561 Rest of South America: Impact Analysis - Chart
Figure: 562 Rest of South America: Opportunity Assessment, By Test Method
Figure: 563 Rest of South America: Opportunity Assessment, By Product Type
Figure: 564 Rest of South America: Opportunity Assessment, By Technology
Figure: 565 Rest of South America: Opportunity Assessment, By Service Sourcing
Figure: 566 Rest of South America: Opportunity Assessment, By End User
Figure: 567 Rest of South America Food Safety Testing Market Share (%), By Test Method, 2024
Figure: 568 Rest of South America Food Safety Testing Market Share (%), By Test Method, 2033
Figure: 569 Rest of South America Food Safety Testing Market Share (%), By Product Type, 2024
Figure: 570 Rest of South America Food Safety Testing Market Share (%), By Product Type, 2033
Figure: 571 Rest of South America Food Safety Testing Market Share (%), By Technology, 2024
Figure: 572 Rest of South America Food Safety Testing Market Share (%), By Technology, 2033
Figure: 573 Rest of South America Food Safety Testing Market Share (%), By Service Sourcing, 2024
Figure: 574 Rest of South America Food Safety Testing Market Share (%), By Service Sourcing, 2033
Figure: 575 Rest of South America Food Safety Testing Market Share (%), By End User, 2024
Figure: 576 Rest of South America Food Safety Testing Market Share (%), By End User, 2033
Figure: 577 ALS: Business Revenue Segmentation, 2024
Figure: 578 ALS: Geographical Revenue Segmentation, 2024
Figure: 579 Biomerieux: Business Revenue Segmentation, 2024
Figure: 580 Biomerieux: Geographical Revenue Segmentation, 2024
Figure: 581 Eurofins Scientific: Geographical Revenue Segmentation, 2024
Figure: 582 Intertek Group plc: Business Revenue Segmentation, 2024
Figure: 583 Intertek Group plc: Geographical Revenue Segmentation, 2024
Figure: 584 Merck KgaA: Business Revenue Segmentation, 2024
Figure: 585 Merck KgaA: Geographical Revenue Segmentation, 2024
Figure: 586 SGS Société Générale de Surveillance SA: Business Revenue Segmentation, 2024
Figure: 587 SGS Société Générale de Surveillance SA: Geographical Revenue Segmentation, 2024
Figure: 588 Thermo Fisher Scientific Inc. : Business Revenue Segmentation, 2024
Figure: 589 Thermo Fisher Scientific Inc.: Geographical Revenue Segmentation, 2024
Figure: 590 TUV SUD: Business Revenue Segmentation, 2024
Figure: 591 TUV SUD: Geographical Revenue Segmentation, 2024
Figure: 592 Annexure: Global GDP, Current Prices (Billions of U.S. dollars)
Figure: 593 Annexure: Global GDP Per Capita, Current Prices (U.S. Dollars Per Capita)
Figure: 594 Annexure: World Population by Region, 2024
Figure: 595 Annexure: Population Distribution by Age Group, 2024
Figure: 596 Annexure: Share Of Consumer Expenditure Spent On Food, By Country 2022 (In %)
Figure: 597 Annexure: Average Household Expenditures on Food (In %)- 2024


Features | Type of License | ||||
Data Book | Single User |   Multi User | Corporate | ||
| e-Access | ✓ | ✓ | ✓ | ✓ | |
User Sharing | 1 User Only | 1 User Only | Up to 7 Users | Unlimited User Access | |
⨉ | ⨉ | ⨉ | ✓ | ||
Free Customization | No Free Customization | Up To 30 hrs work | Up To 60 hrs work | Up To 80 hrs work | |
Deliverable |
| ⨉ | ✓ | ✓ | ✓ |
| ✓ | ⨉ | ✓ | ✓ | |
| ⨉ | ⨉ | ⨉ | ✓ | |
Analyst Support | 2-Months Analyst Support | 4-Months Analyst Support | 7-Months Analyst Support | One Year Analyst Support | |
Free Report update in next update cycle | ⨉ | ⨉ | ⨉ | ✓ | |
Free Industry Update (Within 180 days) | ⨉ | ⨉ | ⨉ | ✓ | |
Benefit | Up to 10% off on Post Purchase | Up to 20% off on Post Purchase | Up to 30% off on Post Purchase | Up to 40% off on Post Purchase | |