Table 1:Global Immune Health Products Market Size (US$ Mn), by Source, 2018-2031
Table 2:Global Immune Health Products Market Size (US$ Mn), by Processed State, 2018-2031
Table 3:Global Immune Health Products Market Size (US$ Mn), by Form, 2018-2031
Table 4:Global Immune Health Products Market Size (US$ Mn), by Type, 2018-2031
Table 5:Global Immune Health Products Market Size (US$ Mn), by Function, 2018-2031
Table 6:Global Immune Health Products Market Size (US$ Mn), by Distribution Channel, 2018-2031
Table 7:Global Immune Health Products Market Size (US$ Mn), by Region, 2018-2031
Table 8:North America Immune Health Products Market Size (US$ Mn), by Country, 2018-2031
Table 9:North America Immune Health Products Market Size (US$ Mn), by Source, 2018-2031
Table 10:North America Immune Health Products Market Size (US$ Mn), by Processed State, 2018-2031
Table 11:North America Immune Health Products Market Size (US$ Mn), by Form, 2018-2031
Table 12:North America Immune Health Products Market Size (US$ Mn), by Type, 2018-2031
Table 13:North America Immune Health Products Market Size (US$ Mn), by Function, 2018-2031
Table 14:North America Immune Health Products Market Size (US$ Mn), by Distribution Channel, 2018-2031
Table 15:Europe Immune Health Products Market Size (US$ Mn), by Country, 2018-2031
Table 16:Europe Immune Health Products Market Size (US$ Mn), by Source, 2018-2031
Table 17:Europe Immune Health Products Market Size (US$ Mn), by Processed State, 2018-2031
Table 18:Europe Immune Health Products Market Size (US$ Mn), by Form, 2018-2031
Table 19:Europe Immune Health Products Market Size (US$ Mn), by Type, 2018-2031
Table 20:Europe Immune Health Products Market Size (US$ Mn), by Function, 2018-2031
Table 21:Europe Immune Health Products Market Size (US$ Mn), by Distribution Channel, 2018-2031
Table 22:UK Immune Health Products Market Size (US$ Mn), by Source, 2018-2031
Table 23:UK Immune Health Products Market Size (US$ Mn), by Processed Type, 2018-2031
Table 24:UK Immune Health Products Market Size (US$ Mn), by Form, 2018-2031
Table 25:UK Immune Health Products Market Size (US$ Mn), by Type, 2018-2031
Table 26:UK Immune Health Products Market Size (US$ Mn), by Function, 2018-2031
Table 27:UK Immune Health Products Market Size (US$ Mn), by Distribution Channel, 2018-2031
Table 28:Germany Immune Health Products Market Size (US$ Mn), by Source, 2018-2031
Table 29:Germany Immune Health Products Market Size (US$ Mn), by Processed Type, 2018-2031
Table 30:Germany Immune Health Products Market Size (US$ Mn), by Form, 2018-2031
Table 31:Germany Immune Health Products Market Size (US$ Mn), by Type, 2018-2031
Table 32:Germany Immune Health Products Market Size (US$ Mn), by Function, 2018-2031
Table 33:Germany Immune Health Products Market Size (US$ Mn), by Distribution Channel, 2018-2031
Table 34:France Immune Health Products Market Size (US$ Mn), by Source, 2018-2031
Table 35:France Immune Health Products Market Size (US$ Mn), by Processed Type, 2018-2031
Table 36:France Immune Health Products Market Size (US$ Mn), by Form, 2018-2031
Table 37:France Immune Health Products Market Size (US$ Mn), by Type, 2018-2031
Table 38:France Immune Health Products Market Size (US$ Mn), by Function, 2018-2031
Table 39:France Immune Health Products Market Size (US$ Mn), by Distribution Channel, 2018-2031
Table 40:Southeast Asia Immune Health Products Market Size (US$ Mn), by Source, 2018-2031
Table 41:Southeast Asia Immune Health Products Market Size (US$ Mn), by Processed Type, 2018-2031
Table 42:Southeast Asia Immune Health Products Market Size (US$ Mn), by Form, 2018-2031
Table 43:Southeast Asia Immune Health Products Market Size (US$ Mn), by Type, 2018-2031
Table 44:Southeast Asia Immune Health Products Market Size (US$ Mn), by Function, 2018-2031
Table 45:Southeast Asia Immune Health Products Market Size (US$ Mn), by Distribution Channel, 2018-2031
Table 46:Japan Immune Health Products Market Size (US$ Mn), by Source, 2018-2031
Table 47:Japan Immune Health Products Market Size (US$ Mn), by Processed Type, 2018-2031
Table 48:Japan Immune Health Products Market Size (US$ Mn), by Form, 2018-2031
Table 49:Japan Immune Health Products Market Size (US$ Mn), by Type, 2018-2031
Table 50:Japan Immune Health Products Market Size (US$ Mn), by Function, 2018-2031
Table 51:Japan Immune Health Products Market Size (US$ Mn), by Distribution Channel, 2018-2031
Table 52:China Immune Health Products Market Size (US$ Mn), by Source, 2018-2031
Table 53:China Immune Health Products Market Size (US$ Mn), by Processed Type, 2018-2031
Table 54:China Immune Health Products Market Size (US$ Mn), by Form, 2018-2031
Table 55:China Immune Health Products Market Size (US$ Mn), by Type, 2018-2031
Table 56:China Immune Health Products Market Size (US$ Mn), by Function, 2018-2031
Table 57:China Immune Health Products Market Size (US$ Mn), by Distribution Channel, 2018-2031
Table 58:Bayer AG: Financial Analysis
Table 59:Glanbia, Plc: Financial Analysis
Table 60:HerbaLife Nutrition: Financial Analysis
Table 61:DSM: Financial Analysis
Table 62:Suntory Group: Financial Analysis
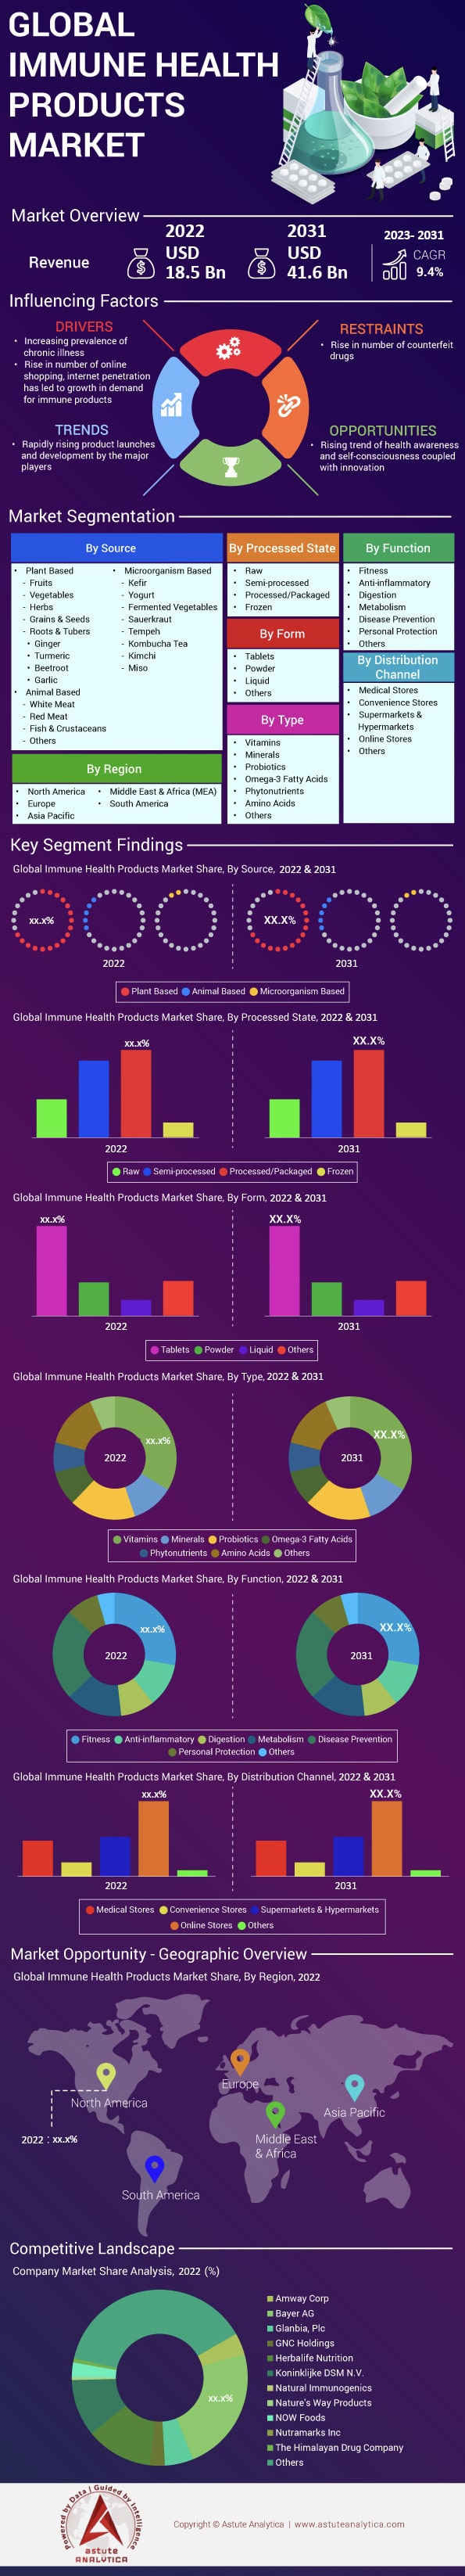
Figure1:Executive Summary: Global Immune Health Products Market Size, by Value, 2018-2031 (US$ Billion)
Figure2:Executive Summary: Global Immune Health Products Market Size, by YoY Growth, 2018-2031 (%)
Figure3:Market Share Analysis by Company, Based on Revenue (2022)
Figure4:Market Revenue Estimates and Forecast (US$ Mn), 2018-2031
Figure5:COVID-19 Impact Assessment on Market Growth Trend
Figure6:Global Immune Health Products Market, by Source, CAGR (%), 2018-2031
Figure7:Global Immune Health Products Market Share (%), by Source, 2022
Figure8:Global Immune Health Products Market Share (%), by Source, 2031
Figure9:Global Immune Health Products Market, by Processed Type, CAGR (%), 2018-2031
Figure10:Global Immune Health Products Market Share (%), by Processed State, 2022
Figure11:Global Immune Health Products Market Share (%), by Processed State, 2031
Figure12:Global Immune Health Products Market, by Form, CAGR (%), 2018-2031
Figure13:Global Immune Health Products Market Share (%), by Form, 2022
Figure14:Global Immune Health Products Market Share (%), by Form, 2031
Figure15:Global Immune Health Products Market, by Type, CAGR (%), 2018-2031
Figure16:Global Immune Health Products Market Share (%), by Type, 2022
Figure17:Global Immune Health Products Market Share (%), by Type, 2031
Figure18:Global Immune Health Products Market, by Function, CAGR (%), 2018-2031
Figure19:Global Immune Health Products Market Share (%), by Function, 2022
Figure20:Global Immune Health Products Market Share (%), by Function, 2031
Figure21:Global Immune Health Products Market, by Distribution Channel, CAGR (%), 2018-2031
Figure22:Global Immune Health Products Market Share (%), by Distribution Channel, 2022
Figure23:Global Immune Health Products Market Share (%), by Distribution Channel, 2031
Figure24:Global immune health products Market, Top Segment CAGR, 2018-2031
Figure25:Global Immune Health Products Market Share (%), by Region, 2022
Figure26:Global Immune Health Products Market Share (%), by Region, 2031
Figure27:North America Immune Health Products Market, Top Segment CAGR (%), 2018-2031
Figure28:North America Immune Health Products Market Share (%), by Country, 2022
Figure29:North America Immune Health Products Market Share (%), by Country, 2031
Figure30:North America Immune Health Products Market Share (%), by Source, 2022
Figure31:North America Immune Health Products Market Share (%), by Source, 2031
Figure32:North America Immune Health Products Market Share (%), by Processed State, 2022
Figure33:North America Immune Health Products Market Share (%), by Processed State, 2031
Figure34:North America Immune Health Products Market Share (%), by Form, 2022
Figure35:North America Immune Health Products Market Share (%), by Form, 2031
Figure36:North America Immune Health Products Market Share (%), by Type, 2022
Figure37:North America Immune Health Products Market Share (%), by Type, 2031
Figure38:North America Immune Health Products Market Share (%), by Function, 2022
Figure39:North America Immune Health Products Market Share (%), by Function, 2031
Figure40:North America Immune Health Products Market Share (%), by Distribution Channel, 2022
Figure41:North America Immune Health Products Market Share (%), by Distribution Channel, 2031
Figure42:Europe Immune Health Products Market, Top Segment CAGR (%), 2018-2031
Figure43:Europe Immune Health Products Market Share (%), by Country, 2022
Figure44:Europe Immune Health Products Market Share (%), by Country, 2031
Figure45:Europe Immune Health Products Market Share (%), by Source, 2022
Figure46:Europe Immune Health Products Market Share (%), by Source, 2031
Figure47:Europe Immune Health Products Market Share (%), by Processed State, 2022
Figure48:Europe Immune Health Products Market Share (%), by Processed State, 2031
Figure49:Europe Immune Health Products Market Share (%), by Form, 2022
Figure50:Europe Immune Health Products Market Share (%), by Form, 2031
Figure51:Europe Immune Health Products Market Share (%), by Type, 2022
Figure52:Europe Immune Health Products Market Share (%), by Type, 2031
Figure53:Europe Immune Health Products Market Share (%), by Function, 2022
Figure54:Europe Immune Health Products Market Share (%), by Function, 2031
Figure55:Europe Immune Health Products Market Share (%), by Distribution Channel, 2022
Figure56:Europe Immune Health Products Market Share (%), by Distribution Channel, 2031
Figure57:UK Immune Health Products Market, Top Segment CAGR (%), 2018-2031
Figure58:UK Immune Health Products Market Share (%), by Source, 2022
Figure59:UK Immune Health Products Market Share (%), by Source, 2031
Figure60:UK Immune Health Products Market Share (%), by Processed Type, 2022
Figure61:UK Immune Health Products Market Share (%), by Processed Type, 2031
Figure62:UK Immune Health Products Market Share (%), by Form, 2022
Figure63:UK Immune Health Products Market Share (%), by Form, 2031
Figure64:UK Immune Health Products Market Share (%), by Type, 2022
Figure65:UK Immune Health Products Market Share (%), by Type, 2031
Figure66:UK Immune Health Products Market Share (%), by Function, 2022
Figure67:UK Immune Health Products Market Share (%), by Function, 2031
Figure68:UK Immune Health Products Market Share (%), by Distribution Channel, 2022
Figure69:UK Immune Health Products Market Share (%), by Distribution Channel, 2031
Figure70:Germany Immune Health Products Market, Top Segment CAGR (%), 2018-2031
Figure71:Germany Immune Health Products Market Share (%), by Source, 2022
Figure72:Germany Immune Health Products Market Share (%), by Source, 2031
Figure73:Germany Immune Health Products Market Share (%), by Processed Type, 2022
Figure74:Germany Immune Health Products Market Share (%), by Processed Type, 2031
Figure75:Germany Immune Health Products Market Share (%), by Form, 2022
Figure76:Germany Immune Health Products Market Share (%), by Form, 2031
Figure77:Germany Immune Health Products Market Share (%), by Type, 2022
Figure78:Germany Immune Health Products Market Share (%), by Type, 2031
Figure79:Germany Immune Health Products Market Share (%), by Function, 2022
Figure80:Germany Immune Health Products Market Share (%), by Function, 2031
Figure81:Germany Immune Health Products Market Share (%), by Distribution Channel, 2022
Figure82:Germany Immune Health Products Market Share (%), by Distribution Channel, 2031
Figure83:France Immune Health Products Market, Top Segment CAGR (%), 2018-2031
Figure84:France Immune Health Products Market Share (%), by Source, 2022
Figure85:France Immune Health Products Market Share (%), by Source, 2031
Figure86:France Immune Health Products Market Share (%), by Processed Type, 2022
Figure87:France Immune Health Products Market Share (%), by Processed Type, 2031
Figure88:France Immune Health Products Market Share (%), by Form, 2022
Figure89:France Immune Health Products Market Share (%), by Form, 2031
Figure90:France Immune Health Products Market Share (%), by Type, 2022
Figure91:France Immune Health Products Market Share (%), by Type, 2031
Figure92:France Immune Health Products Market Share (%), by Function, 2022
Figure93:France Immune Health Products Market Share (%), by Function, 2031
Figure94:France Immune Health Products Market Share (%), by Distribution Channel, 2022
Figure95:France Immune Health Products Market Share (%), by Distribution Channel, 2031
Figure96:Southeast Asia Immune Health Products Market, Top Segment CAGR (%), 2018-2031
Figure97:Southeast Asia Immune Health Products Market Share (%), by Source, 2022
Figure98:Southeast Asia Immune Health Products Market Share (%), by Source, 2031
Figure99:Southeast Asia Immune Health Products Market Share (%), by Processed Type, 2022
Figure100:Southeast Asia Immune Health Products Market Share (%), by Processed Type, 2031
Figure101:Southeast Asia Immune Health Products Market Share (%), by Form, 2022
Figure102:Southeast Asia Immune Health Products Market Share (%), by Form, 2031
Figure103:Southeast Asia Immune Health Products Market Share (%), by Type, 2022
Figure104:Southeast Asia Immune Health Products Market Share (%), by Type, 2031
Figure105:Southeast Asia Immune Health Products Market Share (%), by Function, 2022
Figure106:Southeast Asia Immune Health Products Market Share (%), by Function, 2031
Figure107:Southeast Asia Immune Health Products Market Share (%), by Distribution Channel, 2022
Figure108:Southeast Asia Immune Health Products Market Share (%), by Distribution Channel, 2031
Figure109:Japan Immune Health Products Market, Top Segment CAGR (%), 2018-2031
Figure110:Japan Immune Health Products Market Share (%), by Source, 2022
Figure111:Japan Immune Health Products Market Share (%), by Source, 2031
Figure112:Japan Immune Health Products Market Share (%), by Processed Type, 2022
Figure113:Japan Immune Health Products Market Share (%), by Processed Type, 2031
Figure114:Japan Immune Health Products Market Share (%), by Form, 2022
Figure115:Japan Immune Health Products Market Share (%), by Form, 2031
Figure116:Japan Immune Health Products Market Share (%), by Type, 2022
Figure117:Japan Immune Health Products Market Share (%), by Type, 2031
Figure118:Japan Immune Health Products Market Share (%), by Function, 2022
Figure119:Japan Immune Health Products Market Share (%), by Function, 2031
Figure120:Japan Immune Health Products Market Share (%), by Distribution Channel, 2022
Figure121:Japan Immune Health Products Market Share (%), by Distribution Channel, 2031
Figure122:China Immune Health Products Market, Top Segment CAGR (%), 2018-2031
Figure123:China Immune Health Products Market Share (%), by Source, 2022
Figure124:China Immune Health Products Market Share (%), by Source, 2031
Figure125:China Immune Health Products Market Share (%), by Processed Type, 2022
Figure126:China Immune Health Products Market Share (%), by Processed Type, 2031
Figure127:China Immune Health Products Market Share (%), by Form, 2022
Figure128:China Immune Health Products Market Share (%), by Form, 2031
Figure129:China Immune Health Products Market Share (%), by Type, 2022
Figure130:China Immune Health Products Market Share (%), by Type, 2031
Figure131:China Immune Health Products Market Share (%), by Function, 2022
Figure132:China Immune Health Products Market Share (%), by Function, 2031
Figure133:China Immune Health Products Market Share (%), by Distribution Channel, 2022
Figure134:China Immune Health Products Market Share (%), by Distribution Channel, 2031
Figure135:Bayer AG: Geographical Revenue Segmentation, 2022
Figure136:Bayer AG: Business Revenue Segmentation, 2022
Figure137:Glanbia, Plc: Business Revenue Segmentation, 2022
Figure138:Glanbia, Plc: Geographical Revenue Segmentation, 2022
Figure139:HerbaLife Nutrition: Business Revenue Segmentation, 2022
Figure140:HerbaLife Nutrition: Geographical Revenue Segmentation, 2022
Figure141:DSM: Geographical Revenue Segmentation, 2022
Figure142:DSM: Business Revenue Segmentation, 2022
Figure143:Suntory Group: Business Product Revenue Segmentation, 2022
Figure144:Suntory Group: Geographical Revenue Segmentation, 2022


Features | Type of License | ||||
Data Book | Single User |   Multi User | Corporate | ||
| e-Access | ✓ | ✓ | ✓ | ✓ | |
User Sharing | 1 User Only | 1 User Only | Up to 7 Users | Unlimited User Access | |
⨉ | ⨉ | ⨉ | ✓ | ||
Free Customization | No Free Customization | Up To 30 hrs work | Up To 60 hrs work | Up To 80 hrs work | |
Deliverable |
| ⨉ | ✓ | ✓ | ✓ |
| ✓ | ⨉ | ✓ | ✓ | |
| ⨉ | ⨉ | ⨉ | ✓ | |
Analyst Support | 2-Months Analyst Support | 4-Months Analyst Support | 7-Months Analyst Support | One Year Analyst Support | |
Free Report update in next update cycle | ⨉ | ⨉ | ⨉ | ✓ | |
Free Industry Update (Within 180 days) | ⨉ | ⨉ | ⨉ | ✓ | |
Benefit | Up to 10% off on Post Purchase | Up to 20% off on Post Purchase | Up to 30% off on Post Purchase | Up to 40% off on Post Purchase | |