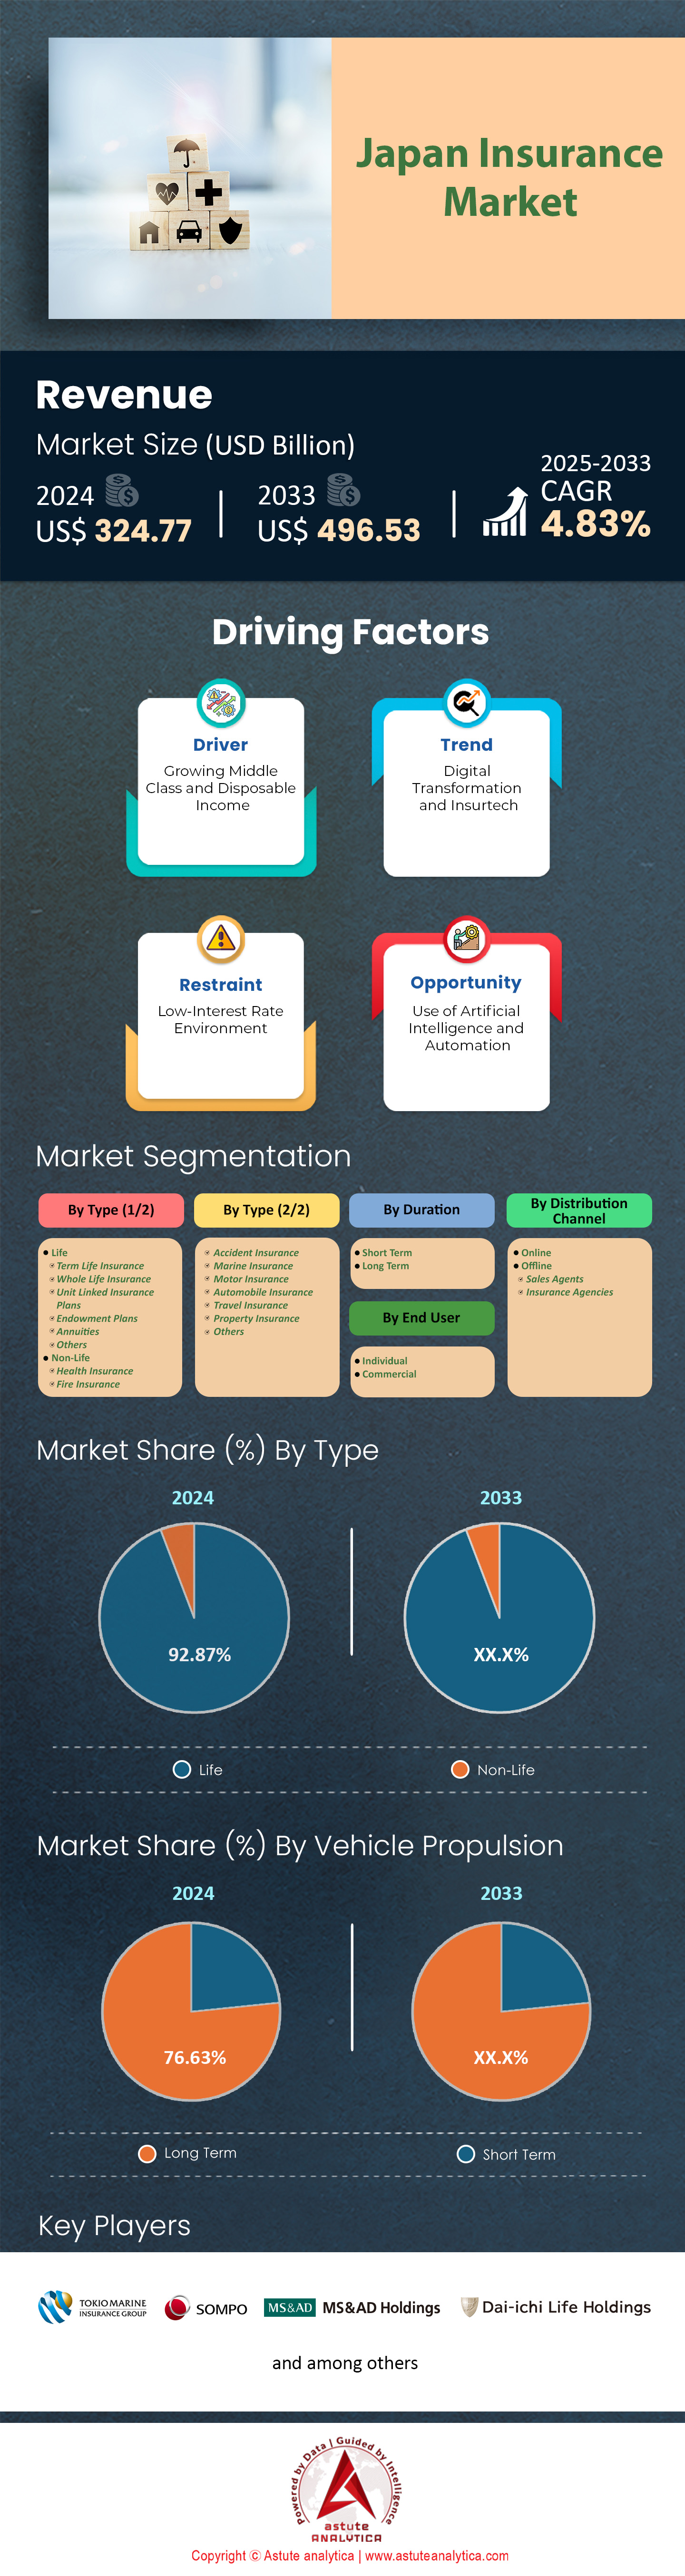
Japan Insurance Market: By Type (Life (Term Life Insurance, Whole Life Insurance, Unit Linked Insurance Plans, Endowment Plans, Annuities, Others), Non-Life (Health Insurance, Fire Insurance, Accident Insurance, Marine Insurance, Motor Insurance, Automobile Insurance, Travel Insurance, Property Insurance, Others); Duration (Short Term and Long Term); End Users (Individual and Commercial); Distribution Channel (Offline and Online); Country—Market Size, Industry Dynamics, Opportunity Analysis and Forecast for 2025–2033
- Last Updated: 08-May-2025 | | Report ID: AA05251301
Table 1 Industry Outlook: Overview Of Amount Of Policies In Force
Table 2 Pestle Impact Analysis: Political Factors
Table 3 Pestle Impact Analysis: Economic Factors
Table 4 Pestle Impact Analysis: Social Factors
Table 5 Pestle Impact Analysis: Technological Factors
Table 6 Pestle Impact Analysis: Legal Factors
Table 7 Pestle Impact Analysis: Environmental Factors
Table 8 Japan Insurance Market Size (US$ Bn), By Type, 2020-2033
Table 9 Japan Insurance Market Size (US$ Bn), By Duration, 2020-2033
Table 10 Japan Insurance Market Size (US$ Bn), By End User, 2020-2033
Table 11 Japan Insurance Market Size (US$ Bn), By Distribution Channel, 2020-2033
Table 12 AEON Allianz Life Insurance Co., Ltd.: Recent Developments
Table 13 AEON Allianz Life Insurance Co., Ltd.: Offering
Table 14 Asahi Mutual Life Insurance Co: Recent Developments
Table 15 Asahi Mutual Life Insurance Co: Offering
Table 16 Asahi Mutual Life Insurance Co: Financial Analysis
Table 17 Nippon Life Insurance: Recent Developments
Table 18 Nippon Life Insurance: Offering
Table 19 JAPAN POST INSURANCE Co., Ltd.: Recent Developments
Table 20 JAPAN POST INSURANCE Co., Ltd: Offering
Table 21 JAPAN POST INSURANCE Co., Ltd. : Financial Analysis
Table 22 Dai-ichi Life Holdings, Inc.: Recent Developments
Table 23 Dai-ichi Life Holdings, Inc.: Offering
Table 24 Dai-ichi Life Holdings, Inc. : Financial Analysis
Table 25 Meiji Yasuda Life Insurance Company: Recent Developments
Table 26 Meiji Yasuda Life Insurance Company: Offering
Table 27 Meiji Yasuda Life Insurance Company: Financial Analysis
Table 28 Chubb Insurance: Recent Developments
Table 29 Chubb Insurance: Offering
Table 30 Chubb Insurance: Financial Analysis
Table 31 Sumitomo Life: Recent Developments
Table 32 Sumitomo Life : Financial Analysis
Table 33 Tokio Marine Holdings: Recent Developments
Table 34 Tokio Marine Holdings: Offering
Table 35 Tokio Marine Holdings: Financial Analysis
Table 36 Sompo Holdings: Recent Developments
Table 37 Sompo Holdings: Offering
Table 38 Sompo Holdings: Financial Analysis
Table 39 BNP Paribas Cardif: Recent Developments
Table 40 BNP Paribas Cardif: Offering
Table 41 BNP Paribas (Parent Company): Financial Analysis
Table 42 Crédit Agricole Life Insurance Company Japan Ltd.: Offering
Table 43 Crédit Agricole Life Insurance Company Japan Ltd.: Financial Analysis
Table 44 Daido Life Insurance Company: Recent Developments
Table 45 Daido Life Insurance Company: Offering
Table 46 T&D Holdings (Parent Company): Financial Analysis
Table 47 Aflac: Offering
Table 48 Aflac Incorporated (Parent Company): Financial Analysis
Table 49 Fukoku Mutual Life Insurance Company: Offering
Table 50 Fukoku Mutual Life Insurance Company: Financial Analysis
Table 51 TAIYO LIFE INSURANCE COMPANY: Recent Developments
Table 52 TAIYO LIFE INSURANCE COMPANY: Offering
Table 53 T&D Holdings (Parent Company): Financial Analysis
Table 54 Sony Life Insurance Co., Ltd.: Recent Developments
Table 55 Sony Life Insurance Co., Ltd: Offering
Table 56 Sony Group Corporation (Parent Company): Financial Analysis
Table 57 Lifenet Insurance Company: Offering
Table 58 Lifenet Insurance Company: Financial Analysis
Table 59 Medicare Life Insurance Co., Ltd: Offering
Table 60 MS & AD Insurance Group: Recent Developments
Table 61 MS & AD Insurance Group: Offering
Table 62 MS & AD Insurance Group : Financial Analysis
Table 63 Other Prominent Players
Table 64 Annexure: Secondary Sources
Figure 1 Executive Summary: Japan Insurance Market Size and Forecast, 2020-2033 (US$ Bn)
Figure 2 Top Segments, CAGR % (2025-2033)
Figure 3 Industry Outlook: Number of Individual Insurance Policies in Force
Figure 4 Industry Outlook: Amount of Individual Insurance Policies in Force
Figure 5 Industry Outlook: Amount of Policies in Force
Figure 6 Adoption Analysis: Adoption Rate (%), By Type
Figure 7 Adoption Analysis: Revenue Comparison, By Duration (US$ Bn)
Figure 8 Driver: Japan Population Ages 65 And Above (% Of Total Population)
Figure 9 Driver: Japan Disposable Personal Income – In US$ 000’ – 2024 Monthly
Figure 10 Trend: Japan Smartphone Users – In Millions
Figure 11 Competitive Dashboard: Market Share Analysis by Company, Based on Revenue (2024)
Figure 12 Japan Insurance Market, By Type, CAGR (%), 2024-2033
Figure 13 Japan Insurance Market Share (%), By Type, 2024
Figure 14 Japan Insurance Market Share (%), By Type, 2033
Figure 15 Japan Insurance Market, By Duration, CAGR (%), 2024-2033
Figure 16 Japan Insurance Market Share (%), By Duration, 2024
Figure 17 Japan Insurance Market Share (%), By Duration, 2033
Figure 18 Japan Insurance Market, By End User, CAGR (%), 2024-2033
Figure 19 Japan Insurance Market Share (%), By End User, 2024
Figure 20 Japan Insurance Market Share (%), By End User, 2033
Figure 21 Japan Insurance Market, By Distribution Channel, CAGR (%), 2024-2033
Figure 22 Japan Insurance Market Share (%), By Distribution Channel, 2024
Figure 23 Japan Insurance Market Share (%), By Distribution Channel, 2033
Figure 24 Asahi Mutual Life Insurance Co: Business Revenue Segmentation, 2024
Figure 25 Dai-ichi Life Holdings, Inc.: Business Revenue Segmentation, 2024
Figure 26 Chubb Insurance: Business Revenue Segmentation, 2024
Figure 27 Tokio Marine Holdings: Business Revenue Segmentation, 2024
Figure 28 Sompo Holdings: Business Revenue Segmentation, 2024
Figure 29 BNP Paribas Cardif: Business Revenue Segmentation, 2024
Figure 30 Crédit Agricole Life Insurance Company Japan Ltd.: Business Revenue Segmentation, 2024
Figure 31 Crédit Agricole Life Insurance Company Japan Ltd.: Geographic Revenue Segmentation, 2024
Figure 32 Daido Life Insurance Company: Business Revenue Segmentation, 2024
Figure 33 Aflac: Business Revenue Segmentation, 2024
Figure 34 Taiyo Life Insurance Company: Business Revenue Segmentation, 2024
Figure 35 Sony Life Insurance Co., Ltd: Business Revenue Segmentation, 2024
Figure 36 Sony Life Insurance Co., Ltd: Geographical Revenue Segmentation, 2024
Figure 37 MS & AD Insurance Group: Business Revenue Segmentation, 2024
Figure 38 Annexure: Secondary Sources
Figure 39 Annexure: GDP, Current Prices (Billions of U.S. dollars)
Figure 40 Annexure: GDP Per Capita, Current Prices (U.S. Dollars Per Capita)
Figure 41 Annexure: Annexure: Population By Age Group, (In Thousands)
Figure 42 Annexure: Internet Users, As A Percentage Of Their Age Group
Figure 43 Annexure: Trends in Japan's Technology Exports and Imports by Business Enterprises (in US$)
Figure 44 Annexure: Software spending, % GDP


Features | Type of License | ||||
Data Book | Single User |   Multi User | Corporate | ||
| e-Access | ✓ | ✓ | ✓ | ✓ | |
User Sharing | 1 User Only | 1 User Only | Up to 7 Users | Unlimited User Access | |
⨉ | ⨉ | ⨉ | ✓ | ||
Free Customization | No Free Customization | Up To 30 hrs work | Up To 60 hrs work | Up To 80 hrs work | |
Deliverable |
| ⨉ | ✓ | ✓ | ✓ |
| ✓ | ⨉ | ✓ | ✓ | |
| ⨉ | ⨉ | ⨉ | ✓ | |
Analyst Support | 2-Months Analyst Support | 4-Months Analyst Support | 7-Months Analyst Support | One Year Analyst Support | |
Free Report update in next update cycle | ⨉ | ⨉ | ⨉ | ✓ | |
Free Industry Update (Within 180 days) | ⨉ | ⨉ | ⨉ | ✓ | |
Benefit | Up to 10% off on Post Purchase | Up to 20% off on Post Purchase | Up to 30% off on Post Purchase | Up to 40% off on Post Purchase | |