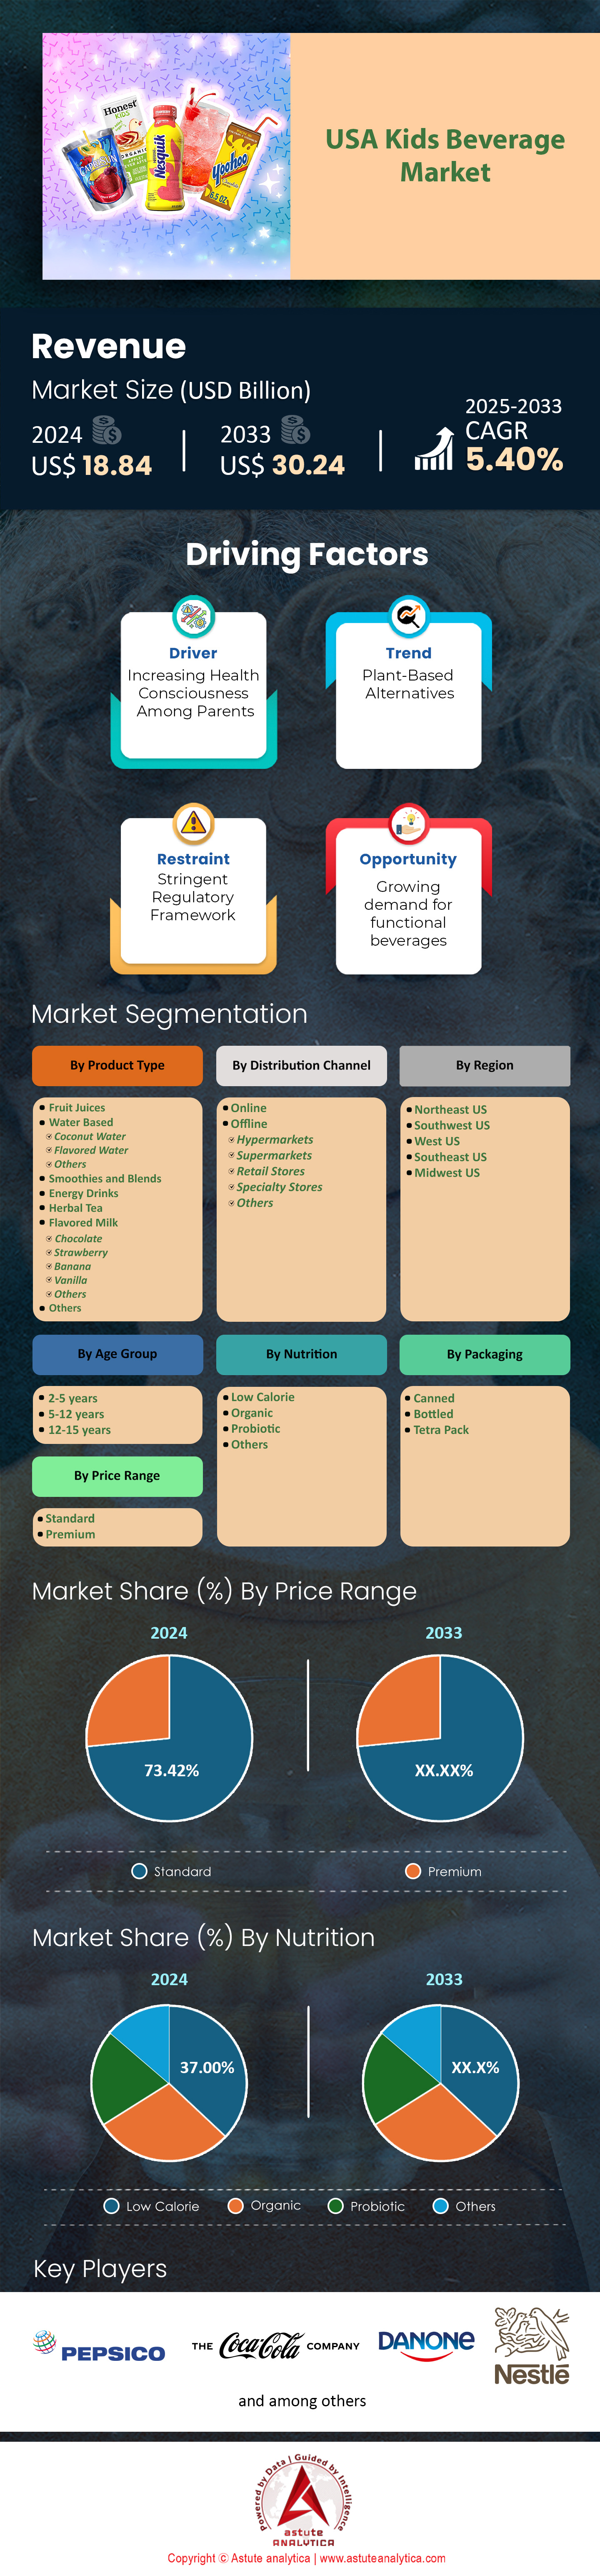
United States Kids Beverage Market: By Product Type (Fruit Juices, Water Based, Smoothies and Blends, Energy Drinks, Herbal Tea, Flavoured Milk, Others); Nutrition (Low Calorie, Organic, Probiotic, Others); Age Group (2-5 years, 5-12 years, 12-15 years); Packaging (Canned, Bottled, Teta Pack); Price Range (Standard, Premium); Distribution Channel (Online, Offline); Region—Market Forecast and Analysis for 2025-2033
- Last Updated: 04-May-2025 | | Report ID: AA0623458
Table: 1 Industry Outlook: Recommendations for Healthy Beverage Consumption, Ages 5–18 Years
Table: 2 Industry Outlook: Percentage of children aged 1–5 years who consumed sugar sweetened beverages during the preceding week, by sociodemographic characteristics —United States, 2021
Table: 3 Restraints: Stringent Regulatory Framework
Table: 4 Market Dynamics and Trends: Impact Analysis of Market Dynamics
Table: 5 Product Price Analysis: Product Type-based Price Analysis (in US$ per Unit)
Table: 6 USA Kids Beverage Market Size (US$ Bn), By Product Type, 2020-2033
Table: 7 USA Kids Beverage Market Size (US$ Bn), By Nutrition, 2020-2033
Table: 8 USA Kids Beverage Market Size (US$ Bn), By Age Group, 2020-2033
Table: 9 USA Kids Beverage Market Size (US$ Bn), By Packaging, 2020-2033
Table: 10 USA Kids Beverage Market Size (US$ Bn), By Price Range, 2020-2033
Table: 11 USA Kids Beverage Market Size (US$ Bn), By Distribution Channel, 2020-2033
Table: 12 USA Kids Beverage Market Size (US$ Bn), By Region, 2020-2033
Table: 13 Northeast US Kids Beverage Market Size (US$ Bn), By Product Type, 2020-2033
Table: 14 Northeast US Kids Beverage Market Size (US$ Bn), By Nutrition, 2020-2033
Table: 15 Northeast US Kids Beverage Market Size (US$ Bn), By Age Group, 2020-2033
Table: 16 Northeast US Kids Beverage Market Size (US$ Bn), By Packaging, 2020-2033
Table: 17 Northeast US Kids Beverage Market Size (US$ Bn), By Price Range, 2020-2033
Table: 18 Northeast US Kids Beverage Market Size (US$ Bn), By Distribution Channel, 2020-2033
Table: 19 Southwest US Kids Beverage Market Size (US$ Bn), By Product Type, 2020-2033
Table: 20 Southwest US Kids Beverage Market Size (US$ Bn), By Nutrition, 2020-2033
Table: 21 Southwest US Kids Beverage Market Size (US$ Bn), By Age Group, 2020-2033
Table: 22 Southwest US Kids Beverage Market Size (US$ Bn), By Packaging, 2020-2033
Table: 23 Southwest US Kids Beverage Market Size (US$ Bn), By Price Range, 2020-2033
Table: 24 Southwest US Kids Beverage Market Size (US$ Bn), By Distribution Channel, 2020-2033
Table: 25 West US Kids Beverage Market Size (US$ Bn), By Product Type, 2020-2033
Table: 26 West US Kids Beverage Market Size (US$ Bn), By Nutrition, 2020-2033
Table: 27 West US Kids Beverage Market Size (US$ Bn), By Age Group, 2020-2033
Table: 28 West US Kids Beverage Market Size (US$ Bn), By Packaging, 2020-2033
Table: 29 West US Kids Beverage Market Size (US$ Bn), By Price Range, 2020-2033
Table: 30 West US Kids Beverage Market Size (US$ Bn), By Distribution Channel, 2020-2033
Table: 31 Southeast US Kids Beverage Market Size (US$ Bn), By Product Type, 2020-2033
Table: 32 Southeast US Kids Beverage Market Size (US$ Bn), By Nutrition, 2020-2033
Table: 33 Southeast US Kids Beverage Market Size (US$ Bn), By Age Group, 2020-2033
Table: 34 Southeast US Kids Beverage Market Size (US$ Bn), By Packaging, 2020-2033
Table: 35 Southeast US Kids Beverage Market Size (US$ Bn), By Price Range, 2020-2033
Table: 36 Southeast US Kids Beverage Market Size (US$ Bn), By Distribution Channel, 2020-2033
Table: 37 Midwest US Kids Beverage Market Size (US$ Bn), By Product Type, 2020-2033
Table: 38 Midwest US Kids Beverage Market Size (US$ Bn), By Nutrition, 2020-2033
Table: 39 Midwest US Kids Beverage Market Size (US$ Bn), By Age Group, 2020-2033
Table: 40 Midwest US Kids Beverage Market Size (US$ Bn), By Packaging, 2020-2033
Table: 41 Midwest US Kids Beverage Market Size (US$ Bn), By Price Range, 2020-2033
Table: 42 Midwest US Kids Beverage Market Size (US$ Bn), By Distribution Channel, 2020-2033
Table: 43 Atkins Nutritionals Inc.: Products
Table: 44 Britvic PLC: Recent Developments
Table: 45 Britvic PLC: Products
Table: 46 Britvic PLC: Financial Analysis
Table: 47 Campbell Soup Company: Products
Table: 48 Campbell Soup Company: Financial Analysis
Table: 49 Danone SA: Products
Table: 50 Danone SA.: Financial Analysis
Table: 51 Groupe Lactalis: Products
Table: 52 Groupe Lactalis.: Financial Analysis
Table: 53 Honest Tea: Recent Developments
Table: 54 Honest Tea: Products
Table: 55 Kellogg Company: Recent Developments
Table: 56 Kellogg Company: Products
Table: 57 Kellogg Company: Financial Analysis
Table: 58 Keurig Dr Pepper Inc.: Recent Developments
Table: 59 Keurig Dr Pepper Inc.: Products
Table: 60 Keurig Dr Pepper Inc.: Financial Analysis
Table: 61 Kiddiwinks: Recent Developments
Table: 62 Kiddiwinks: Products
Table: 63 Kraft Heinz Company: Recent Developments
Table: 64 Kraft Heinz Company: Products
Table: 65 Kraft Heinz Company: Financial Analysis
Table: 66 Lifeway Foods Inc.,: Recent Developments
Table: 67 Lifeway Foods Inc.,: Products
Table: 68 Lifeway Foods Inc.,: Financial Analysis
Table: 69 Mondelez International Inc.: Recent Developments
Table: 70 Mondelez International Inc.: Products
Table: 71 Mondelez International Inc.: Financial Analysis
Table: 72 Nestlé S.A.: Recent Developments
Table: 73 Nestlé S.A.: Offerings
Table: 74 Nestlé S.A.: Financial Analysis
Table: 75 PepsiCo, Inc.: Recent Developments
Table: 76 PepsiCo, Inc.: Offerings
Table: 77 PepsiCo, Inc.: Financial Analysis
Table: 78 Vitaco Health (NZ) Ltd.: Offerings
Table: 79 Welch’s: Offerings
Table: 80 Other Prominent Players
Figure: 1 Executive Summary: USA Kids Beverage Market Size and Forecast, 2020-2033 (US$ Bn)
Figure: 2 Industry Outlook: USA Export destinations of "Fruit or nut juices, 2023, (in US$ Bn)
Figure: 3 Industry Outlook: USA Importers of "Fruit or nut juice, 2023, (in US$ Bn)
Figure: 4 Industry Outlook: 2017–2020 beverage consumption among children
Figure: 5 Consumer Behavior Analysis: Preferred By Product Type
Figure: 6 Consumer Behavior Analysis: Preferred By Age Group
Figure: 7 Consumer Behavior Analysis: Preferred By Price Range
Figure: 8 Consumer Behavior Analysis: Preferred By Distribution Channel
Figure: 9 Consumer Behavior Analysis: Preferred By Packaging
Figure: 10 Driver: Seven states had youth obesity rates, 2022-2023
Figure: 11 Trends: Average weekly expenditure shares of milk products, 2022
Figure: 12 Covid -19 Impact & Recovery: USA Kids Beverage Market, Covid-19 Impact & Recovery, 2020-2033 Y-o-Y (%)
Figure: 13 Competitive Dashboard: Market Share Analysis, By Company, Based on Revenue (2024)
Figure: 14 USA Kids Beverage Market, By Product Type, CAGR (%), 2024-2033
Figure: 15 USA Kids Beverage Market Share (%), By Product Type, 2024
Figure: 16 USA Kids Beverage Market Share (%), By Product Type, 2033
Figure: 17 USA Kids Beverage Market, By Nutrition, CAGR (%), 2024-2033
Figure: 18 USA Kids Beverage Market Share (%), By Nutrition, 2024
Figure: 19 USA Kids Beverage Market Share (%), By Nutrition, 2033
Figure: 20 USA Kids Beverage Market, By Age Group, CAGR (%), 2024-2033
Figure: 21 USA Kids Beverage Market Share (%), By Age Group, 2024
Figure: 22 USA Kids Beverage Market Share (%), By Age Group, 2033
Figure: 23 USA Kids Beverage Market, By Packaging, CAGR (%), 2024-2033
Figure: 24 USA Kids Beverage Market Share (%), By Packaging, 2024
Figure: 25 USA Kids Beverage Market Share (%), By Packaging, 2033
Figure: 26 USA Kids Beverage Market, By Price Range, CAGR (%), 2024-2033
Figure: 27 USA Kids Beverage Market Share (%), By Price Range, 2024
Figure: 28 USA Kids Beverage Market Share (%), By Price Range, 2033
Figure: 29 USA Kids Beverage Market, By Distribution Channel, CAGR (%), 2024-2033
Figure: 30 USA Kids Beverage Market Share (%), By Distribution Channel, 2024
Figure: 31 USA Kids Beverage Market Share (%), By Distribution Channel, 2033
Figure: 32 USA Kids Beverage Market, By Region, CAGR (%), 2024-2033
Figure: 33 USA Kids Beverage Market Share (%), By Region, 2024
Figure: 34 USA Kids Beverage Market Share (%), By Region, 2033
Figure: 35 Northeast US: Highest Share (%) Segment
Figure: 36 Northeast US: Net Opportunity Addition, in US$ Bn
Figure: 37 Northeast US: Impact Analysis - Chart
Figure: 38 Northeast US: Opportunity Assessment, By Product Type
Figure: 39 Northeast US: Opportunity Assessment, By Nutrition
Figure: 40 Northeast US: Opportunity Assessment, By Age Group
Figure: 41 Northeast US: Opportunity Assessment, By Packaging
Figure: 42 Northeast US: Opportunity Assessment, By Price Range
Figure: 43 Northeast US: Opportunity Assessment, By Distribution Channel
Figure: 44 Northeast US Kids Beverage Market Share (%), By Product Type, 2024
Figure: 45 Northeast US Kids Beverage Market Share (%), By Product Type, 2033
Figure: 46 Northeast US Kids Beverage Market Share (%), By Nutrition, 2024
Figure: 47 Northeast US Kids Beverage Market Share (%), By Nutrition, 2033
Figure: 48 Northeast US Kids Beverage Market Share (%), By Age Group, 2024
Figure: 49 Northeast US Kids Beverage Market Share (%), By Age Group, 2033
Figure: 50 Northeast US Kids Beverage Market Share (%), By Packaging, 2024
Figure: 51 Northeast US Kids Beverage Market Share (%), By Packaging, 2033
Figure: 52 Northeast US Kids Beverage Market Share (%), By Price Range, 2024
Figure: 53 Northeast US Kids Beverage Market Share (%), By Price Range, 2033
Figure: 54 Northeast US Kids Beverage Market Share (%), By Distribution Channel, 2024
Figure: 55 Northeast US Kids Beverage Market Share (%), By Distribution Channel, 2033
Figure: 56 Southwest US: Highest Share (%) Segment
Figure: 57 Southwest US: Net Opportunity Addition, in US$ Bn
Figure: 58 Southwest US: Impact Analysis - Chart
Figure: 59 Southwest US: Opportunity Assessment, By Product Type
Figure: 60 Southwest US: Opportunity Assessment, By Nutrition
Figure: 61 Southwest US: Opportunity Assessment, By Age Group
Figure: 62 Southwest US: Opportunity Assessment, By Packaging
Figure: 63 Southwest US: Opportunity Assessment, By Price Range
Figure: 64 Southwest US: Opportunity Assessment, By Distribution Channel
Figure: 65 Southwest US Kids Beverage Market Share (%), By Product Type, 2024
Figure: 66 Southwest US Kids Beverage Market Share (%), By Product Type, 2033
Figure: 67 Southwest US Kids Beverage Market Share (%), By Nutrition, 2024
Figure: 68 Southwest US Kids Beverage Market Share (%), By Nutrition, 2033
Figure: 69 Southwest US Kids Beverage Market Share (%), By Age Group, 2024
Figure: 70 Southwest US Kids Beverage Market Share (%), By Age Group, 2033
Figure: 71 Southwest US Kids Beverage Market Share (%), By Packaging, 2024
Figure: 72 Southwest US Kids Beverage Market Share (%), By Packaging, 2033
Figure: 73 Southwest US Kids Beverage Market Share (%), By Price Range, 2024
Figure: 74 Southwest US Kids Beverage Market Share (%), By Price Range, 2033
Figure: 75 Southwest US Kids Beverage Market Share (%), By Distribution Channel, 2024
Figure: 76 Southwest US Kids Beverage Market Share (%), By Distribution Channel, 2033
Figure: 77 West US: Highest Share (%) Segment
Figure: 78 West US: Net Opportunity Addition, in US$ Bn
Figure: 79 West US: Impact Analysis - Chart
Figure: 80 West US: Opportunity Assessment, By Product Type
Figure: 81 West US: Opportunity Assessment, By Nutrition
Figure: 82 West US: Opportunity Assessment, By Age Group
Figure: 83 West US: Opportunity Assessment, By Packaging
Figure: 84 West US: Opportunity Assessment, By Price Range
Figure: 85 West US: Opportunity Assessment, By Distribution Channel
Figure: 86 West US Kids Beverage Market Share (%), By Product Type, 2024
Figure: 87 West US Kids Beverage Market Share (%), By Product Type, 2033
Figure: 88 West US Kids Beverage Market Share (%), By Nutrition, 2024
Figure: 89 West US Kids Beverage Market Share (%), By Nutrition, 2033
Figure: 90 West US Kids Beverage Market Share (%), By Age Group, 2024
Figure: 91 West US Kids Beverage Market Share (%), By Age Group, 2033
Figure: 92 West US Kids Beverage Market Share (%), By Packaging, 2024
Figure: 93 West US Kids Beverage Market Share (%), By Packaging, 2033
Figure: 94 West US Kids Beverage Market Share (%), By Price Range, 2024
Figure: 95 West US Kids Beverage Market Share (%), By Price Range, 2033
Figure: 96 West US Kids Beverage Market Share (%), By Distribution Channel, 2024
Figure: 97 West US Kids Beverage Market Share (%), By Distribution Channel, 2033
Figure: 98 Southeast US: Highest Share (%) Segment
Figure: 99 Southeast US: Net Opportunity Addition, in US$ Bn
Figure: 100 Southeast US: Impact Analysis - Chart
Figure: 101 Southeast US: Opportunity Assessment, By Product Type
Figure: 102 Southeast US: Opportunity Assessment, By Nutrition
Figure: 103 Southeast US: Opportunity Assessment, By Age Group
Figure: 104 Southeast US: Opportunity Assessment, By Packaging
Figure: 105 Southeast US: Opportunity Assessment, By Price Range
Figure: 106 Southeast US: Opportunity Assessment, By Distribution Channel
Figure: 107 Southeast US Kids Beverage Market Share (%), By Product Type, 2024
Figure: 108 Southeast US Kids Beverage Market Share (%), By Product Type, 2033
Figure: 109 Southeast US Kids Beverage Market Share (%), By Nutrition, 2024
Figure: 110 Southeast US Kids Beverage Market Share (%), By Nutrition, 2033
Figure: 111 Southeast US Kids Beverage Market Share (%), By Age Group, 2024
Figure: 112 Southeast US Kids Beverage Market Share (%), By Age Group, 2033
Figure: 113 Southeast US Kids Beverage Market Share (%), By Packaging, 2024
Figure: 114 Southeast US Kids Beverage Market Share (%), By Packaging, 2033
Figure: 115 Southeast US Kids Beverage Market Share (%), By Price Range, 2024
Figure: 116 Southeast US Kids Beverage Market Share (%), By Price Range, 2033
Figure: 117 Southeast US Kids Beverage Market Share (%), By Distribution Channel, 2024
Figure: 118 Southeast US Kids Beverage Market Share (%), By Distribution Channel, 2033
Figure: 119 Midwest US: Highest Share (%) Segment
Figure: 120 Midwest US: Net Opportunity Addition, in US$ Bn
Figure: 121 Midwest US: Impact Analysis - Chart
Figure: 122 Midwest US: Opportunity Assessment, By Product Type
Figure: 123 Midwest US: Opportunity Assessment, By Nutrition
Figure: 124 Midwest US: Opportunity Assessment, By Age Group
Figure: 125 Midwest US: Opportunity Assessment, By Packaging
Figure: 126 Midwest US: Opportunity Assessment, By Price Range
Figure: 127 Midwest US: Opportunity Assessment, By Distribution Channel
Figure: 128 Midwest US Kids Beverage Market Share (%), By Product Type, 2024
Figure: 129 Midwest US Kids Beverage Market Share (%), By Product Type, 2033
Figure: 130 Midwest US Kids Beverage Market Share (%), By Nutrition, 2024
Figure: 131 Midwest US Kids Beverage Market Share (%), By Nutrition, 2033
Figure: 132 Midwest US Kids Beverage Market Share (%), By Age Group, 2024
Figure: 133 Midwest US Kids Beverage Market Share (%), By Age Group, 2033
Figure: 134 Midwest US Kids Beverage Market Share (%), By Packaging, 2024
Figure: 135 Midwest US Kids Beverage Market Share (%), By Packaging, 2033
Figure: 136 Midwest US Kids Beverage Market Share (%), By Price Range, 2024
Figure: 137 Midwest US Kids Beverage Market Share (%), By Price Range, 2033
Figure: 138 Midwest US Kids Beverage Market Share (%), By Distribution Channel, 2024
Figure: 139 Midwest US Kids Beverage Market Share (%), By Distribution Channel, 2033
Figure: 140 Britvic PLC: Business Revenue Segmentation, 2024
Figure: 141 Britvic PLC: Geographical Revenue Segmentation, 2024
Figure: 142 Campbell Soup Company: Business Revenue Segmentation, 2024
Figure: 143 Danone SA: Geographical Revenue Segmentation, 2024
Figure: 144 Groupe Lactalis: Business Revenue Segmentation, 2023
Figure: 145 Groupe Lactalis: Geographical Revenue Segmentation, 2023
Figure: 146 Kellogg Company: Business Revenue Segmentation, 2024
Figure: 147 Kellogg Company: Geographical Revenue Segmentation, 2024
Figure: 148 Keurig Dr Pepper Inc.: Business Revenue Segmentation, 2024
Figure: 149 Keurig Dr Pepper Inc.: Geographical Revenue Segmentation, 2024
Figure: 150 Kraft Heinz Company: Business Revenue Segmentation, 2024
Figure: 151 Kraft Heinz Company: Geographical Revenue Segmentation, 2024
Figure: 152 Lifeway Foods Inc.,: Business Revenue Segmentation, 2024
Figure: 153 Mondelez International Inc.: Business Revenue Segmentation, 2024
Figure: 154 Mondelez International Inc.: Geographical Revenue Segmentation, 2024
Figure: 155 Nestlé S.A.: Business Revenue Segmentation, 2024
Figure: 156 Nestlé S.A.: Geographical Revenue Segmentation, 2024
Figure: 157 PepsiCo, Inc.: Business Revenue Segmentation, 2024
Figure: 158 PepsiCo, Inc.: Geographical Revenue Segmentation, 2024


Features | Type of License | ||||
Data Book | Single User |   Multi User | Corporate | ||
| e-Access | ✓ | ✓ | ✓ | ✓ | |
User Sharing | 1 User Only | 1 User Only | Up to 7 Users | Unlimited User Access | |
⨉ | ⨉ | ⨉ | ✓ | ||
Free Customization | No Free Customization | Up To 30 hrs work | Up To 60 hrs work | Up To 80 hrs work | |
Deliverable |
| ⨉ | ✓ | ✓ | ✓ |
| ✓ | ⨉ | ✓ | ✓ | |
| ⨉ | ⨉ | ⨉ | ✓ | |
Analyst Support | 2-Months Analyst Support | 4-Months Analyst Support | 7-Months Analyst Support | One Year Analyst Support | |
Free Report update in next update cycle | ⨉ | ⨉ | ⨉ | ✓ | |
Free Industry Update (Within 180 days) | ⨉ | ⨉ | ⨉ | ✓ | |
Benefit | Up to 10% off on Post Purchase | Up to 20% off on Post Purchase | Up to 30% off on Post Purchase | Up to 40% off on Post Purchase | |