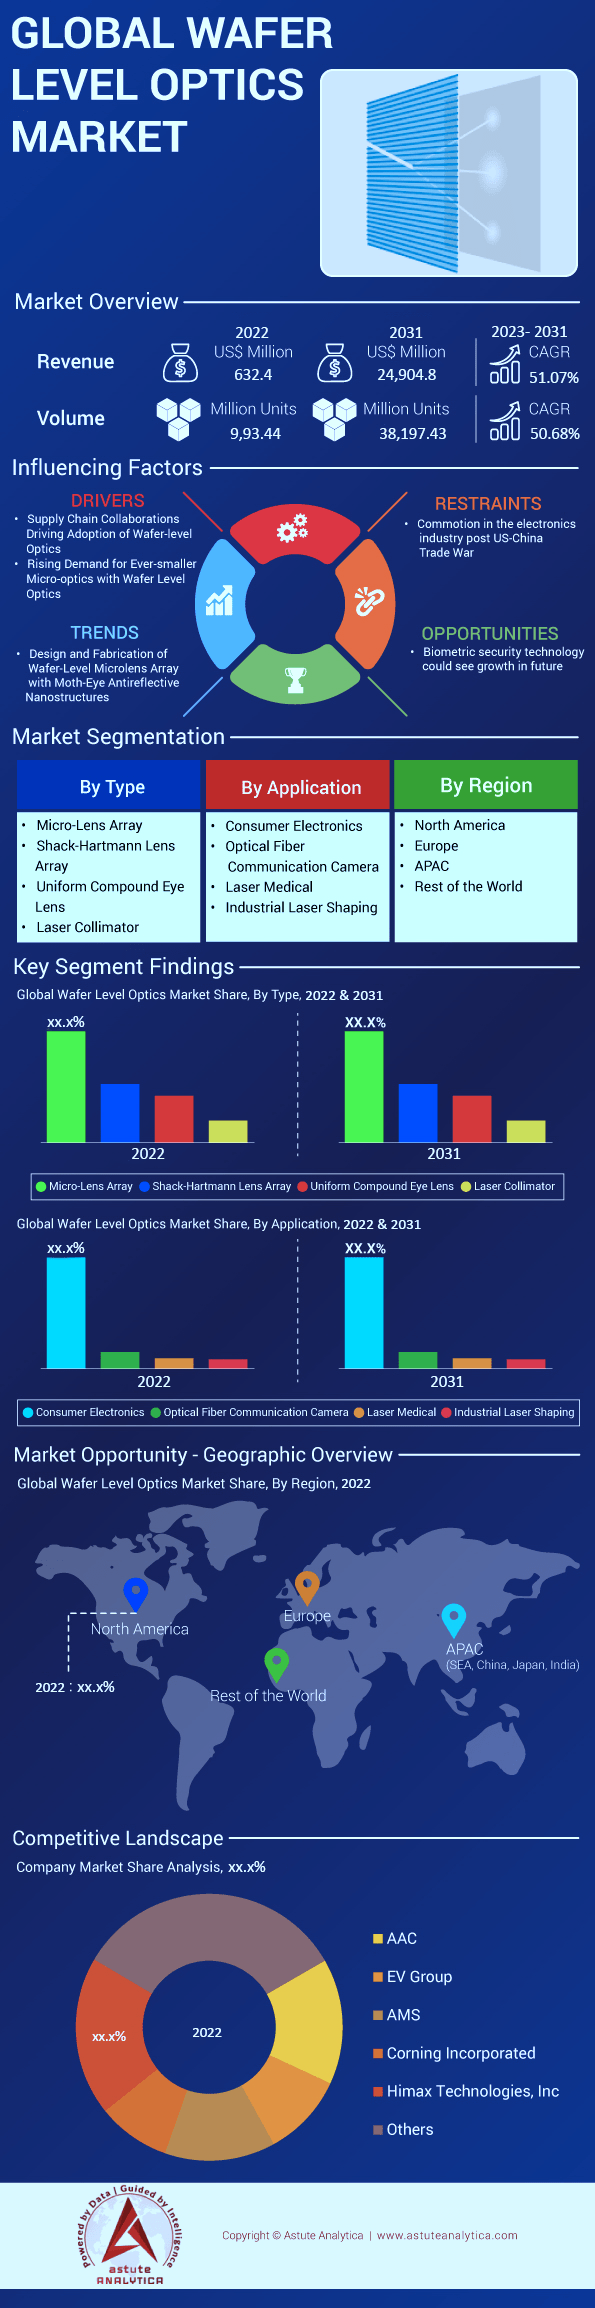
Global Wafer Level Optics Market: By Type (Micro-Lens Array, Shack-Hartmann Lens Array, Uniform Compound Eye Lens, Laser Collimator, Infrared Sensor); Application (Automotive Front-Lights, Light Carpets, Optical Diffusers, Medical Imaging, Consumer Electronics, Optical Fiber Communication Camera, Industrial Laser Shaping); and Region—Industry Dynamics, Market Size and Opportunity Forecast Until 2031
- Last Updated: 28-Mar-2023 | | Report ID: AA0322168
Table 1:Global Wafer Level Optics Market Size (US$ Mn), By Type, 2018-2031
Table 2:Global Wafer Level Optics Market Size (US$ Mn), By Application, 2018-2031
Table 3:Global Wafer Level Optics Market Size (Mn Units), By Region, 2018-2031
Table 4:Global Wafer Level Optics Market Size (US$ Mn), By Region, 2018-2031
Table 5:Global Wafer Level Optics Market Size (Mn Units), By Type, 2018-2031
Table 6:Global Wafer Level Optics Market Size (US$ Mn), By Type, 2018-2031
Table 7:Global Wafer Level Optics Market Size (Mn Units), By Application, 2018-2031
Table 8:Global Wafer Level Optics Market Size (US$ Mn), By Application, 2018-2031
Table 9:North America Wafer Level Optics Market Size (Mn Units), By Type, 2018-2031
Table 10:North America Wafer Level Optics Market Size (US$ Mn), By Type, 2018-2031
Table 11:North America Wafer Level Optics Market Size (Mn Units), By Application, 2018-2031
Table 12:North America Wafer Level Optics Market Size (US$ Mn), By Application, 2018-2031
Table 13:Europe Wafer Level Optics Market Size (Mn Units), By Type, 2018-2031
Table 14:Europe Wafer Level Optics Market Size (US$ Mn), By Type, 2018-2031
Table 15:Europe Wafer Level Optics Market Size (Mn Units), By Application, 2018-2031
Table 16:Europe Wafer Level Optics Market Size (US$ Mn), By Application, 2018-2031
Table 17:China Wafer Level Optics Market Size (Mn Units), By Type, 2018-2031
Table 18:China Wafer Level Optics Market Size (US$ Mn), By Type, 2018-2031
Table 19:China Wafer Level Optics Market Size (Mn Units), By Application, 2018-2031
Table 20:China Wafer Level Optics Market Size (US$ Mn), By Application, 2018-2031
Table 21:Japan Wafer Level Optics Market Size (Mn Units), By Type, 2018-2031
Table 22:Japan Wafer Level Optics Market Size (US$ Mn), By Type, 2018-2031
Table 23:Japan Wafer Level Optics Market Size (Mn Units), By Application, 2018-2031
Table 24:Japan Wafer Level Optics Market Size (US$ Mn), By Application, 2018-2031
Table 25:SEA Wafer Level Optics Market Size (Mn Units), By Type, 2018-2031
Table 26:SEA Wafer Level Optics Market Size (US$ Mn), By Type, 2018-2031
Table 27:SEA Wafer Level Optics Market Size (Mn Units), By Application, 2018-2031
Table 28:SEA Wafer Level Optics Market Size (US$ Mn), By Application, 2018-2031
Table 29:India Wafer Level Optics Market Size (Mn Units), By Type, 2018-2031
Table 30:India Wafer Level Optics Market Size (US$ Mn), By Type, 2018-2031
Table 31:India Wafer Level Optics Market Size (Mn Units), By Application, 2018-2031
Table 32:India Wafer Level Optics Market Size (US$ Mn), By Application, 2018-2031
Table 33:AMS AG: Financial Analysis
Table 34:Himax Technologies, Inc.: Financial Analysis
Table 35:Corning Inc.: Financial Analysis
Figure1:Global Wafer Level Optics (WLO) Market Size in Value Growth Rate: Market Revenue Estimates and Forecast (US$ Mn), 2018-2031
Figure2:Global Wafer Level Optics (WLO) Market Size in Volume Growth Rate: Market Volume Estimates and Forecast (Mn Units), 2018-2031
Figure3:Global Wafer Level Optics Market, Top Segment CAGR (%), 2022-2031
Figure4:Global Wafer Level Optics Market Share (%), by region, 2022
Figure5:Global Wafer Level Optics Market Share (%), by region, 2031
Figure6:Competitive Dashboard: Market Share Analysis, by Company, Based on Revenue (2022)
Figure7:Competitive Dashboard: Company Market Share Analysis
Figure8:Global Wafer Level Optics Market, By Type, CAGR (%), 2022-2031
Figure9:Global Wafer Level Optics Market Share (%), by Type, 2022
Figure10:Global Wafer Level Optics Market Share (%), by Type, 2031
Figure11:Global Wafer Level Optics Market, By Operation Type, CAGR (%), 2022-2031
Figure12:Global Wafer Level Optics Market Share (%), by Application, 2022
Figure13:Global Wafer Level Optics Market Share (%), by Application, 2031
Figure14:North America Wafer Level Optics Market, Top Segment CAGR (%), 2022-2031
Figure15:North America Wafer Level Optics Market Share (%), by Type, 2022
Figure16:North America Wafer Level Optics Market Share (%), by Type, 2031
Figure17:North America Wafer Level Optics Market Share (%), by Application, 2022
Figure18:North America Wafer Level Optics Market Share (%), by Application, 2031
Figure19:Europe Wafer Level Optics Market, Top Segment CAGR (%), 2022-2031
Figure20:Europe Wafer Level Optics Market Share (%), by Type, 2022
Figure21:Europe Wafer Level Optics Market Share (%), by Type, 2031
Figure22:Europe Wafer Level Optics Market Share (%), by Application, 2022
Figure23:Europe Wafer Level Optics Market Share (%), by Application, 2031
Figure24:China Wafer Level Optics Market, Top Segment CAGR (%), 2022-2031
Figure25:China Wafer Level Optics Market Share (%), by Type, 2022
Figure26:China Wafer Level Optics Market Share (%), by Type, 2031
Figure27:China Wafer Level Optics Market Share (%), by Application, 2022
Figure28:China Wafer Level Optics Market Share (%), by Application, 2031
Figure29:Japan Wafer Level Optics Market, Top Segment CAGR (%), 2022-2031
Figure30:Japan Wafer Level Optics Market Share (%), by Type, 2022
Figure31:Japan Wafer Level Optics Market Share (%), by Type, 2031
Figure32:Japan Wafer Level Optics Market Share (%), by Application, 2022
Figure33:Japan Wafer Level Optics Market Share (%), by Application, 2031
Figure34:SEA Wafer Level Optics Market, Top Segment CAGR (%), 2022-2031
Figure35:SEA Wafer Level Optics Market Share (%), by Type, 2022
Figure36:SEA Wafer Level Optics Market Share (%), by Type, 2031
Figure37:SEA Wafer Level Optics Market Share (%), by Application, 2022
Figure38:SEA Wafer Level Optics Market Share (%), by Application, 2031
Figure39:India Wafer Level Optics Market, Top Segment CAGR (%), 2022-2031
Figure40:India Wafer Level Optics Market Share (%), by Type, 2022
Figure41:India Wafer Level Optics Market Share (%), by Type, 2031
Figure42:India Wafer Level Optics Market Share (%), by Application, 2022
Figure43:India Wafer Level Optics Market Share (%), by Application, 2031
Figure44:AMS AG: Business Revenue Segmentation, 2022
Figure45:AMS AG: Geographical Revenue Segmentation, 2022
Figure46:Himax Technologies, Inc.: Business Revenue Segmentation, 2022
Figure47:Himax Technologies, Inc.: Geographical Revenue Segmentation, 2022
Figure48:Corning Inc.: Business Revenue Segmentation, 2022
Figure49:Corning Inc.: Geographical Revenue Segmentation, 2022
Figure50:Wafer Level Optics (WLO) Manufacturing Cost Analysis: Price trend of poly-silicon, 2021
Figure51:Wafer Level Optics (WLO) Manufacturing Cost Analysis: Proportion of Manufacturing Cost Structure
Figure52:COVID-19 Impact Assessment on Market Growth Trend: Analysis


Features | Type of License | ||||
Data Book | Single User |   Multi User | Corporate | ||
| e-Access | ✓ | ✓ | ✓ | ✓ | |
User Sharing | 1 User Only | 1 User Only | Up to 7 Users | Unlimited User Access | |
⨉ | ⨉ | ⨉ | ✓ | ||
Free Customization | No Free Customization | Up To 30 hrs work | Up To 60 hrs work | Up To 80 hrs work | |
Deliverable |
| ⨉ | ✓ | ✓ | ✓ |
| ✓ | ⨉ | ✓ | ✓ | |
| ⨉ | ⨉ | ⨉ | ✓ | |
Analyst Support | 2-Months Analyst Support | 4-Months Analyst Support | 7-Months Analyst Support | One Year Analyst Support | |
Free Report update in next update cycle | ⨉ | ⨉ | ⨉ | ✓ | |
Free Industry Update (Within 180 days) | ⨉ | ⨉ | ⨉ | ✓ | |
Benefit | Up to 10% off on Post Purchase | Up to 20% off on Post Purchase | Up to 30% off on Post Purchase | Up to 40% off on Post Purchase | |