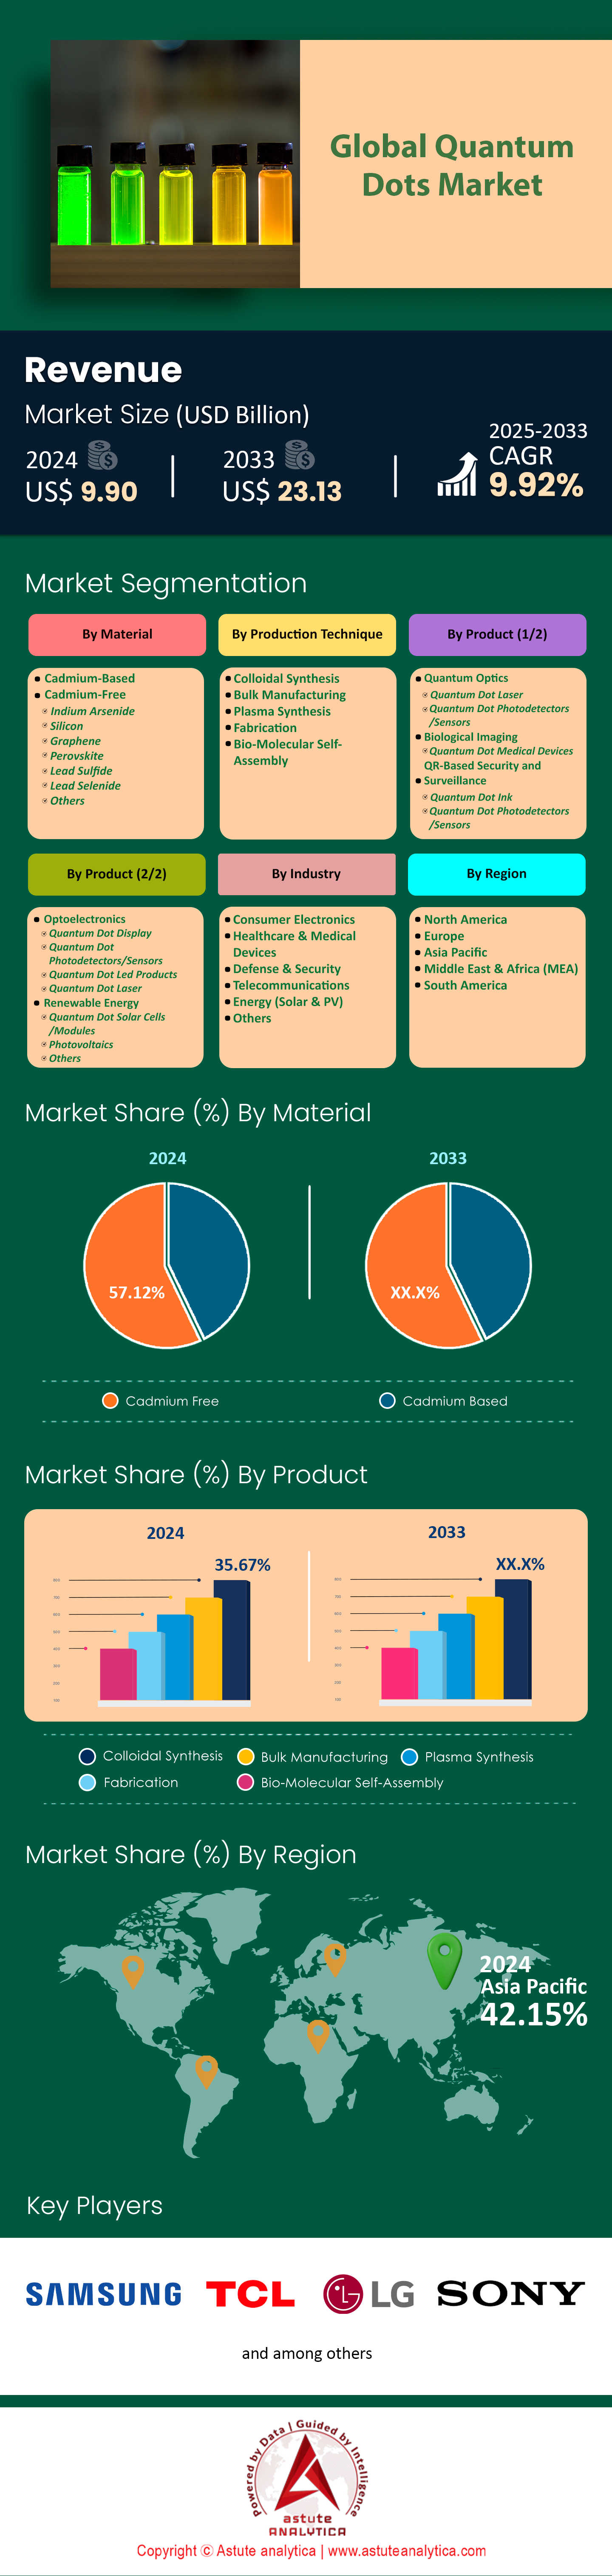
-->
24/7 Customer Support
1.1. Research Objective
1.2. Product Overview
1.3. Market Segmentation
2.1. Qualitative Research2.1.1. Primary & Secondary Sources
2.2. Quantitative Research2.2.1. Primary & Secondary Sources
2.3. Breakdown of Primary Research Respondents, By Region
2.4. Assumption for the Study
2.5. Market Size Estimation
2.6. Data Triangulation
Executive Summary: Global Quantum Dots Market
4.1. Industry Value Chain Analysis4.1.1. Material Provider 4.1.2. Manufacturer4.1.3. Distributor 4.1.4. End Users
4.2. Industry Outlook4.2.1. Comparative Overview: QDs vs Conventional Phosphors4.2.2. Case Studies4.2.2.1. Quantum-Dot-Based Displays4.2.2.2. QDs in TV Display Technologies
4.3. PESTLE Analysis
4.4. Porter's Five Forces Analysis4.4.1. Bargaining Power of Suppliers4.4.2. Bargaining Power of Buyers4.4.3. Threat of Substitutes4.4.4. Threat of New Entrants4.4.5. Degree of Competition
4.5. Market Dynamics and Trends4.5.1. Growth Drivers 4.5.2. Challenges4.5.3. Opportunities4.5.4. Key Trends
4.6. Market Growth and Outlook4.6.1. Market Revenue Estimates and Forecast (US$ Bn), 2020-20334.6.2. Price Trend Analysis
4.7. Competition Dashboard4.7.1. Market Concentration Rate4.7.2. Company Market Share Analysis (Value %), 20244.7.3. Competitor Mapping
4.8. Actionable Insights (Analyst's Recommendations)
5.1. Key Insights
5.2. Market Size and Forecast, 2020-2033 (US$ Bn)5.2.1. Cadmium-Based5.2.2. Cadmium-Free5.2.2.1. Indium Arsenide5.2.2.2. Silicon5.2.2.3. Graphene5.2.2.4. Perovskite5.2.2.5. Lead Sulfide 5.2.2.6. Lead Selenide5.2.2.7. Others
6.1. Key Insights
6.2. Market Size and Forecast, 2020-2033 (US$ Bn)6.2.1. Colloidal Synthesis6.2.2. Bulk Manufacturing6.2.3. Plasma Synthesis6.2.4. Fabrication6.2.5. Bio-Molecular Self-Assembly
7.1. Key Insight
7.2. Market Size and Forecast, 2020-2033 (US$ Bn)7.2.1 Quantum Optics7.2.1.1. Quantum Dot Laser 7.2.1.2. Quantum Dot Photodetectors/Sensors7.2.2 Biological Imaging7.2.2.1. Quantum Dot Medical Devices7.2.3 QR-Based Security and Surveillance7.2.3.1 Quantum Dot Ink7.2.3.2 Quantum Dot Photodetectors/Sensors7.2.4 Optoelectronics7.2.4.1 Quantum Dot Display7.2.4.2 Quantum Dot Photodetectors/Sensors7.2.4.3 Quantum Dot Led Products7.2.4.4 Quantum Dot Laser7.2.5 Renewable Energy7.2.5.1 Quantum Dot Solar Cells /Modules7.2.5.2 Photovoltaics7.2.6 Others
8.1. Key Insights
8.2. Market Size and Forecast, 2020-2033 (US$ Bn)8.2.1. Consumer Electronics8.2.2. Healthcare & Medical Devices8.2.3. Defense & Security8.2.4. Telecommunications8.2.5. Energy (Solar & PV)8.2.6. Others
9.1. Key Insights
9.2. Market Size and Forecast, 2020-2033 (US$ Bn)9.2.1. North America9.2.1.1. U.S.9.2.1.2. Canada9.2.1.3. Mexico9.2.2. Asia Pacific9.2.2.1. China9.2.2.2. Japan9.2.2.3. South Korea9.2.2.4. India9.2.2.5. Singapore9.2.2.6. Malaysia9.2.2.7. Thailand9.2.2.8. Australia9.2.2.9. Vietnam9.2.2.10. Indonesia9.2.2.11. Philippines9.2.2.12. New Zealand9.2.2.13. Rest of Asia Pacific9.2.3. Europe9.2.3.1. Germany9.2.3.2. France9.2.3.3. United Kingdom9.2.3.4. Italy9.2.3.5. Spain9.2.3.6. Netherlands9.2.3.7. Rest of Europe9.2.4. South America9.2.4.1. Brazil9.2.4.2. Argentina9.2.4.3. Rest of South America9.2.5. Middle East & Africa9.2.5.1. United Arab Emirates (UAE)9.2.5.2. Saudi Arabia9.2.5.3. South Africa9.2.5.4. Rest of Middle East and Africa
10.1. Key Insights
10.2. Market Size and Forecast, 2020-2033 (US$ Bn)10.2.1. By Material10.2.2. By Production Technique10.2.3. By Product10.2.4. By Industry10.2.5. By Country
11.1. Key Insights
11.2. Market Size and Forecast, 2020-2033 (US$ Bn)11.2.1. By Material11.2.2. By Production Technique11.2.3. By Product11.2.4. By Industry11.2.5. By Country
12.1. Key Insights
12.2. Market Size and Forecast, 2020-2033 (US$ Bn)12.2.1. By Material12.2.2. By Production Technique12.2.3. By Product12.2.4. By Industry12.2.5. By Country
13.1 Key Insights
13.2 Market Size and Forecast, 2020-2033 (US$ Bn)13.2.1 By Material13.2.2 By Production Technique13.2.3 By Product13.2.4 By Industry13.2.5 By Country
14.1 Key Insights
14.2 Market Size and Forecast, 2020-2033 (US$ Bn)14.2.1 By Material14.2.2. By Production Technique14.2.3. By Product14.2.4. By Industry14.2.5. By Country
15.1. Agilent Technologies, Inc. 15.2. TCL Group15.3. Luminus, Inc.15.4. Samsung Electronics Co. Ltd15.5. Nanoco Group plc15.6. LG Electronics15.7. Quantum Materials Corporation15.8. Sony Group Corporation15.9. VueReal15.10. Shoei Chemical, Inc.15.11. Other Prominent Players
16.1. List of Secondary Sources16.2. Key Country Markets - Macro Economic Outlook/ Indicators
✓
User Sharing
1 User Only
Up to 7 Users
Unlimited User Access
Print
⨉
Free Customization
No Free Customization
Up To 30 hrs work
Up To 60 hrs work
Up To 80 hrs work
Deliverable Format
PDF
Excel
Power Point (PPT)
Analyst Support
2-Months Analyst Support
4-Months Analyst Support
7-Months Analyst Support
One Year Analyst Support
Free Report update in next
update cycle
Free Industry Update
(Within 180 days)
Benefit
Up to 10% off on Post Purchase
Up to 20% off on Post Purchase
Up to 30% off on Post Purchase
Up to 40% off on Post Purchase
We use Cookies×
to improve your experience.