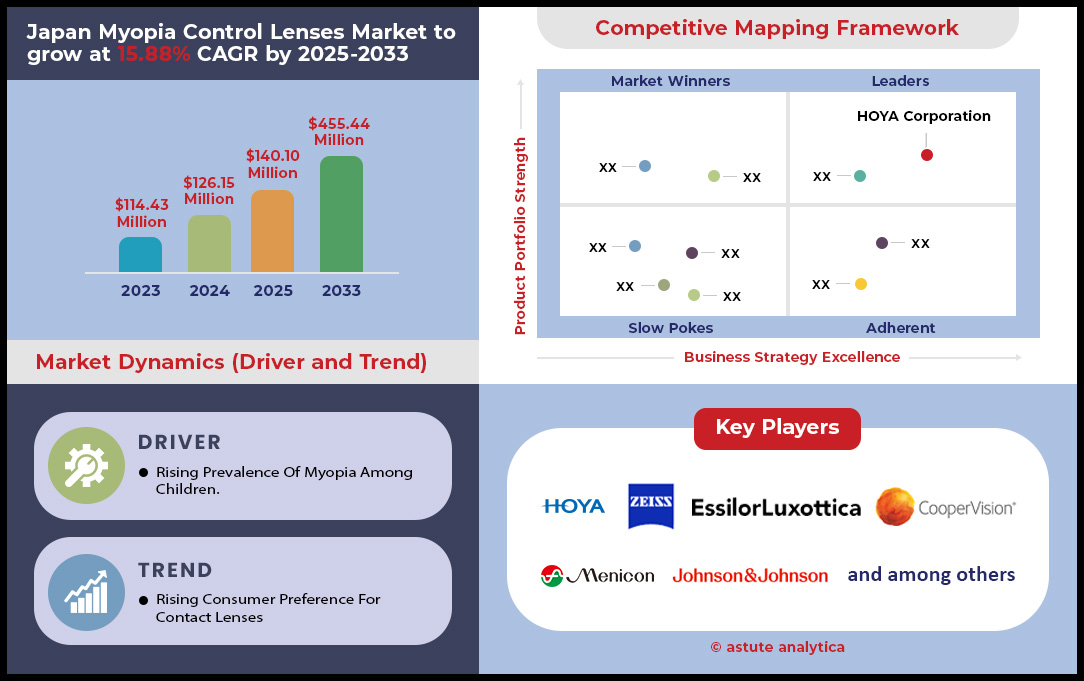
日本近视控制镜头市场:按产品类型(眼镜镜头和隐形眼镜);晶状体类型(多焦点透镜,正差异镜片,双重焦点镜头,周围散热器镜头); Material (Soft Contact Lenses (Silicone Hydrogel, Hydrogel), Rigid Gas Permeable (RGP) Lenses, Polycarbonate & High-Index Plastic (for Spectacle Lenses); Age Group (Children and Adults); Sales Channel (Eyeglass Clinic, Eyewear Retailers, Online Retail)–Market Size, Industry Dynamics, Opportunity Analysis and Forecast for 2025–2033
- 上次更新:MAR-2025 | 格式:|报告ID:AA03251252 | 交货:立即访问
![pdf]()
![微软幻灯片软件]()
![卓越]()


Table 1 Pestle Impact Analysis: Political Factors
Table 2 Pestle Impact Analysis: Economic Factors
Table 3 Pestle Impact Analysis: Social Factors
Table 4 Pestle Impact Analysis: Technological Factors
Table 5 Pestle Impact Analysis: Environmental Factors
Table 6 Pestle Impact Analysis: Legal Factors
Table 7 Product Price Analysis: By Lens Type-based Price Analysis
Table 8 Competitive Dashboard: Competitor Mapping & Benchmarking
Table 9 Japan Myopia Control Lenses Market Size (US$ Mn), By Product Type, 2020-2033
Table 10 Japan Myopia Control Lenses Market Size (000' Units), By Product Type, 2020-2033
Table 11 Japan Myopia Control Lenses Market Size (US$ Mn), By Lens Type, 2020-2033
Table 12 Japan Myopia Control Lenses Market Size (000' Units), By Lens Type, 2020-2033
Table 13 Japan Myopia Control Lenses Market Size (US$ Mn), By Material, 2020-2033
Table 14 Japan Myopia Control Lenses Market Size (000' Units), By Material, 2020-2033
Table 15 Japan Myopia Control Lenses Market Size (US$ Mn), By Age Group, 2020-2033
Table 16 Japan Myopia Control Lenses Market Size (000' Units), By Age Group, 2020-2033
Table 17 Japan Myopia Control Lenses Market Size (US$ Mn), By Sales Channel, 2020-2033
Table 18 Japan Myopia Control Lenses Market Size (000' Units), By Sales Channel, 2020-2033
Table 19 Essilor International: Recent Developments
Table 20 Essilor International: Offering
Table 21 EssilorLuxottica: Financial Analysis
Table 22 Johnson & Johnson Vision: Product
Table 23 Johnson & Johnson (Parent Company) : Financial Analysis
Table 24 CooperVision Group: Product
Table 25 The Cooper Companies, Inc. (Parent Company) : Financial Analysis
Table 26 Hoya Corporation:最新发展
表27 Hoya Corporation:发表
表28 Hoya Corporation:财务分析
表29 Carl Zeiss AG:最新进展
:产品
表31 Carl Zeiss
AG:
AG:财务分析表32 Bausch + Lomb
Inc
.。有限公司:最新进展表36 Menicon Co. Ltd。:产品
表37 Menicon Co. Ltd.:
财务分析
Seed Co.,Ltd。:产品
表
39
Seed Co. Inc。:发行表45 Menicon Co.,Ltd:财务分析
表46其他杰出参与者
表47附件:次要来源
Figure 1 Executive Summary: Japan Myopia Control Lenses Market Revenue (US$ Mn), 2020-2033
Figure 2 Executive Summary: Japan Myopia Control Lenses Market Volume ( 000' Units), 2020-2033
Figure 3 Executive Summary: Japan Myopia Control Lenses Market, By Product Type
Figure 4 Executive Summary: Japan Myopia Control Lenses Market, By Lens Type
Figure 5 Executive Summary: Japan Myopia Control Lenses Market, By Material
Figure 6 Executive Summary: Japan Myopia Control Lenses Market, By Age Group
Figure 7 Executive Summary: Japan Myopia Control Lenses Market, By Sales Channel
Figure 8 Industry Outlook: Japan Export and Import Value of Eyewear Frames, 2022
Figure 9 Industry Outlook: Japan Healthcare Expenditure (% of GDP)
Figure 10 Industry Outlook: Japan Healthcare Expenditure Per Capita – US$ )
Figure 11 Industry Outlook: Prevalence of Myopia in Fujian, By Gender – Japan (in%)-2020
图12驱动因素:儿童近视的患病率(百分比)-2021
图13机会:日本消费者在2024年的消费者支出(十亿美元)
图14机会:日本的出口和进口价值:眼镜的进出口价值:2022年
眼镜的出口和进口价值,2022图15趋势
:日本的出口和进口价值的进出口价值和进口价值,与日本的股票分析:2022年
的股票数17
按产品类型,CAGR(%),2024-2033图18日本近视控制镜头市场份额(%),按产品类型,2024
图19日本近视控制镜头市场份额(%),按产品类型,2033
图20日本近视控制镜片市场,按镜头类型,镜头(%),
Myopia Contrans Market type 2 22
日本Myopia Contrans Market(2024-2033)。近视控制镜头市场份额(%),镜头类型,2033
图23日本近视控制镜片市场,材料,CAGR(%),2024-2033,2024-2033
图24日本近视控制镜头市场份额(%),材料,2024
图25日本近视镜头市场份额(%),材料,材料
26日本Myopia Myopia Contress Market,age 202,
图
27 Japan Myopia Control Lenses Market Share (%), By Age Group, 2024 Figure 28 Japan Myopia Control Lenses Market Share (%), By Age Group, 2033
Figure 29 Japan Myopia Control Lenses Market, By Sales Channel, CAGR (%), 2024-2033
Figure 30 Japan Myopia Control Lenses Market Share (%), By Sales Channel, 2024
Figure 31 Japan Myopia Control Lenses Market Share (%), By Sales Channel, 2033
Figure 32 Essilor International: Business Revenue Segmentation, 2024
Figure 33 Essilor International: Geographical Revenue Segmentation, 2024
Figure 34 Johnson & Johnson Vision: Business Revenue Segmentation, 2024
Figure 35 Johnson & Johnson Vision: Geographical Revenue Segmentation, 2024
Figure 36 CooperVision Group: Business Revenue Segmentation, 2024
Figure 37 CooperVision Group:Geographical Revenue Segmentation, 2024
Figure 38 Hoya Corporation:业务收入细分,2024
图39 Hoya Corporation:地理收入细分,2024
图40 Carl Zeiss AG:业务收入分段,2024
图41 Carl Zeiss AG:Carl Zeiss AG:地理收入分段,
2024图42 Bausch + Loomb Incmement Incmement Incmement + Baus Incement + Baus + Baus + Baus Incementing + Baus + 43 Babimement Incemptation + Baus + 43 Figuny Incementation +
43 22 2243 2243 Revenue Segmentation, 2024
Figure 44 Menicon Co. Ltd.: Geographical Revenue Segmentation, 2024
Figure 45 Menicon Co. Ltd.: Geographical Revenue Segmentation, 2024
Figure 46 Alcon Inc.: Business Revenue Segmentation, 2024
Figure 47 Alcon Inc.: Geographical Revenue Segmentation, 2024
Figure 48 Alpha Corporation Inc.: Business Revenue Segmentation, 2024
图49 Alpha Corporation Inc。:地理收入细分,2024
图50附件:数据
图51附件:日本宏观经济前景/指标
图52附件:日本宏观经济前景/指标/指标


特征 | 许可证类型 | ||||
数据手册 | 单用户 |   多用户 | 公司的 | ||
| 电子访问 | ✓ | ✓ | ✓ | ✓ | |
用户分享 | 仅限 1 个用户 | 仅限 1 个用户 | 最多 7 个用户 | 无限制的用户访问 | |
打印 | ⨉ | ⨉ | ⨉ | ✓ | |
免费定制 | 没有免费定制 | 长达 30 小时的工作时间 | 工作时间长达 60 小时 | 工作时间长达 80 小时 | |
交付 |
| ⨉ | ✓ | ✓ | ✓ |
| ✓ | ⨉ | ✓ | ✓ | |
| ⨉ | ⨉ | ⨉ | ✓ | |
分析师支持 | 2 个月分析师支持 | 4 个月分析师支持 | 7 个月分析师支持 | 一年分析师支持 | |
下次免费报告更新 更新周期 | ⨉ | ⨉ | ⨉ | ✓ | |
免费行业更新 (180天内) | ⨉ | ⨉ | ⨉ | ✓ | |
益处 | 购买后最高可享受 10% 折扣 | 购买后高达 20% 折扣 | 购买后高达 30% 折扣 | 购买后高达 40% 折扣 | |