Kambodschanisches Biermarkt: Nach Biersorte (Lager, Ale, Stout, Weizenbier, Sonstige); Verpackungsart (Flasche, Dose, PET); Brauereityp (Großbrauerei, Mikrobrauerei, Craft-Brauerei); Vertriebskanal (Online und Offline) – Marktgröße, Branchendynamik, Chancenanalyse und Prognose für 2025–2033
- Letzte Aktualisierung: 04. März 2025 | | Bericht-ID: AA0124728
Tabelle 1: Marktdynamik und -trends: Wirkungsanalyse der Marktdynamik
Tabelle 2: Produktpreisanalyse: Preisanalyse nach Produkttyp
Tabelle 3: Wettbewerbsübersicht: Wettbewerberanalyse und Benchmarking
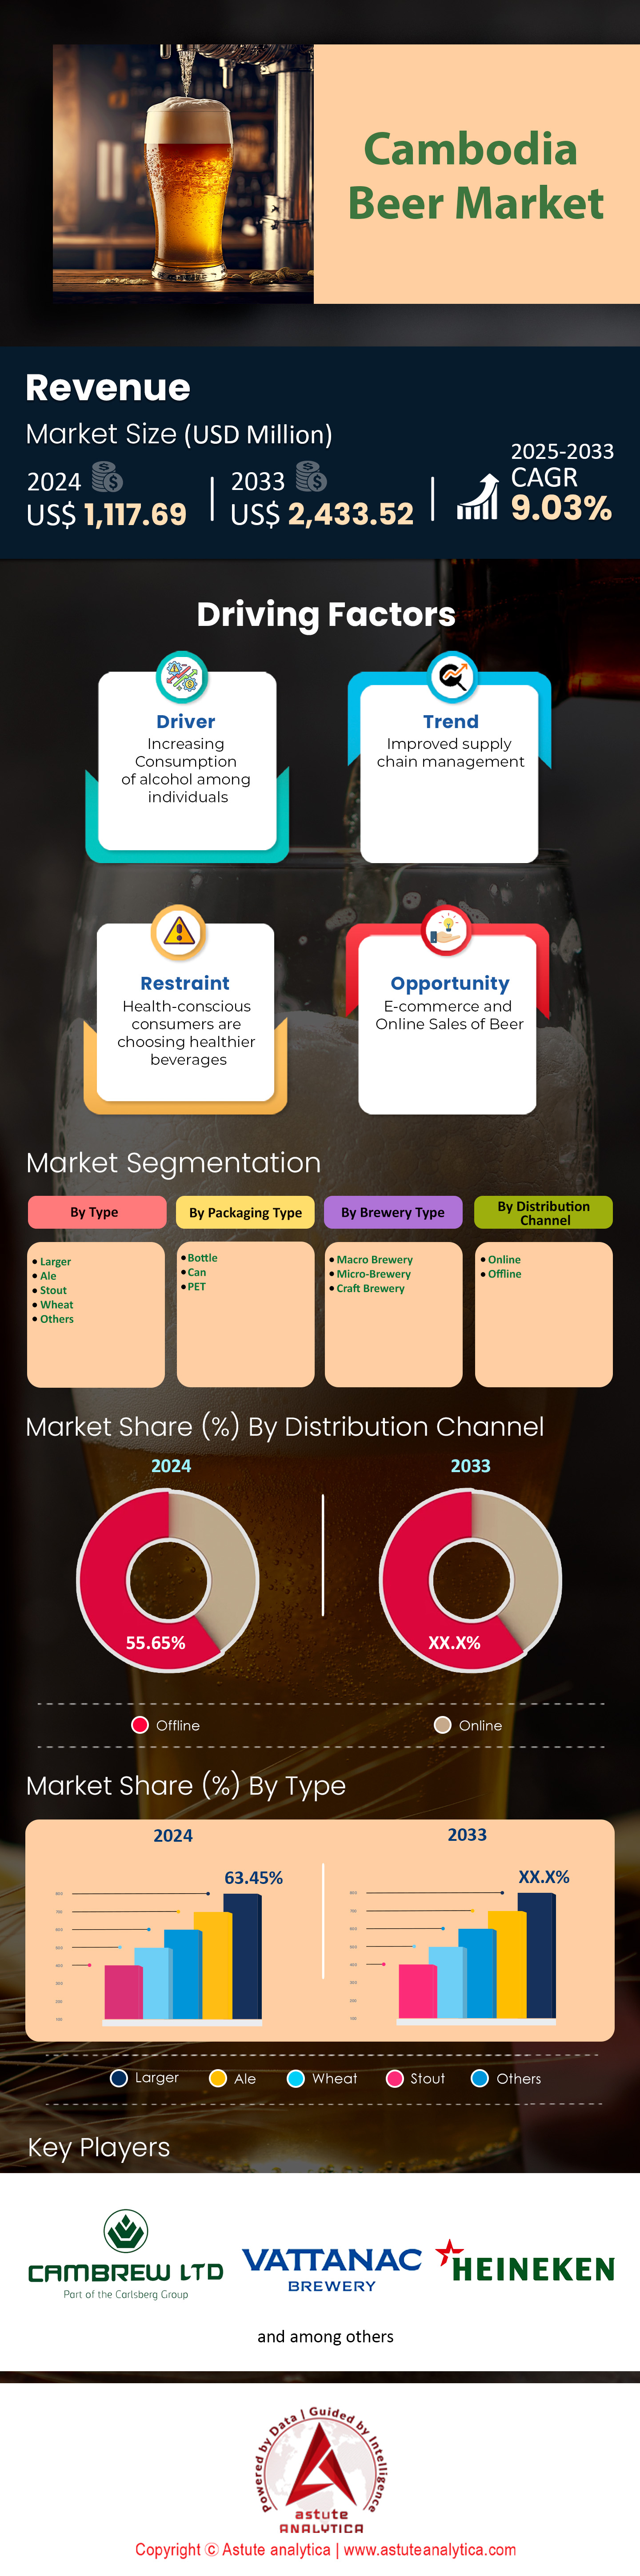
Tabelle 4: Marktgröße für Bier in Kambodscha (Mio. US$), nach Biertyp, 2020–2033
Tabelle 5: Marktgröße für Bier in Kambodscha (Mio. Liter), nach Biertyp, 2020–2033 Tabelle 6
: Marktgröße für Bier in Kambodscha (Mio. US$), nach Verpackungsart, 2020–2033 Tabelle 7
: Marktgröße für Bier in Kambodscha (Mio. Liter), nach Verpackungsart, 2020–2033
Tabelle 8: Marktgröße für Bier in Kambodscha (Mio. US$), nach Brauereityp, 2020–2033
Tabelle 9: Marktgröße für Bier in Kambodscha (Mio. US$), nach Brauereityp, 2020–2033
Tabelle 10: Marktgröße für Bier in Kambodscha (Mio. US$), nach Vertriebskanal, 2020–2033
Tabelle 11: Marktgröße für Bier in Kambodscha Größe (Mio. Liter), nach Vertriebskanal, 2020–2033
Tabelle 12: Anheuser-Busch Companies LLC: Aktuelle Entwicklungen
Tabelle 13: Anheuser-Busch Companies LLC: Produkte
Tabelle 14: Anheuser-Busch Companies LLC: Finanzanalyse
Tabelle 15: Carlsberg Breweries A/S: Aktuelle Entwicklungen
Tabelle 16: Carlsberg Breweries A/S: Produkte
Tabelle 17: Carlsberg Breweries A/S: Finanzanalyse
Tabelle 18: Heineken International BV: Aktuelle Entwicklungen
Tabelle 19: Heineken International BV: Produkte
Tabelle 20: Heineken International BV: Finanzanalyse
Tabelle 21: Khmer Beverages: Aktuelle Entwicklungen
Tabelle 22: Khmer Beverages: Produkte
Tabelle 23: Molson Coors Beverage Company: Produkte
Tabelle 24: Molson Coors Beverage Company: Finanzanalyse
Tabelle 25: The Boston Beer Company Inc.: Produkte
Tabelle 26: The Boston Beer Company Inc.: Finanzanalyse
Tabelle 27: Brewerkz Brewing Co. Produkttabelle
: 28 Cambrew Ltd.: Aktuelle Entwicklungen
Tabelle: 29 Cambrew Ltd.: Produkte
Tabelle: 30 Vattanac Brewer: Produkte
Tabelle: 31 Weitere bedeutende Akteure
Abbildung 1: Zusammenfassung: Umsatz des kambodschanischen Biermarktes, 2020–2033 (Mio. US$)
Abbildung 2: Zusammenfassung: Absatzmenge des kambodschanischen Biermarktes, 2020–2033 (Mio. Liter)
Abbildung 3: Branchenausblick: Weltweiter Bierkonsum nach Regionen im Jahr 2022
Abbildung 4: Branchenausblick: Die weltweit größten Brauereien nach Produktionsmenge in Mio. Hektolitern
Abbildung 5: Branchenausblick: Bierkonsum nach Ländern im Jahr 2024 (Mio. Liter/Kopf)
Abbildung 6: Branchenausblick: Bierkonsum pro Kopf in verschiedenen Ländern im Jahr 2021 (kg/Kopf)
Abbildung 7: Branchenausblick: Die 10 Länder mit dem höchsten Bierkonsum im Jahr 2021 (pro 1000 Tonnen)
Abbildung 8: Adoptionsanalyse: Adoptionsrate (%) nach Biersorte
Abbildung 9: Adoptionsanalyse: Kambodschanischer Biermarkt, jährliche Veränderung (%), 2020–2033
Abbildung 10: Adoption Analyse: Umsatzvergleich nach Verpackungsart (in Mio. US$)
Abbildung 11: Treiber: Bierkonsum pro Kopf in Kambodscha, 2019–2021 (in Mio. Litern)
Abbildung 12: Treiber: Alkoholkonsum: Frauen (nach Altersgruppe) 2021–22
Abbildung 13: Treiber: Alkoholkonsum: Männer (nach Altersgruppe) 2021–22
Abbildung 14: Auswirkungen und Erholung von Covid-19: Kambodschanischer Biermarkt, Auswirkungen und Erholung von Covid-19, jährliche Veränderung (%), 2020–2033
Abbildung 15: Wettbewerbsübersicht: Marktanteilsanalyse nach Unternehmen, basierend auf dem Umsatz (2024)
Abbildung 16: Kambodschanischer Biermarkt nach Sorte, CAGR (%), 2024–2033
Abbildung 17: Marktanteil des kambodschanischen Biermarktes (%), nach Sorte, 2024
Abbildung 18: Marktanteil des kambodschanischen Biermarktes (%), nach Sorte, 2033
Abbildung 19: Kambodschanischer Biermarkt nach Verpackung Typ, CAGR (%), 2024–2033
Abbildung: 20 Marktanteil Kambodschas Bier (%), nach Verpackungsart, 2024
Abbildung: 21 Marktanteil Kambodschas Bier (%), nach Verpackungsart, 2033
Abbildung: 22 Kambodschanischer Biermarkt, nach Brauereityp, CAGR (%), 2024–2033
Abbildung: 23 Marktanteil Kambodschas Bier (%), nach Brauereityp, 2024
Abbildung: 24 Marktanteil Kambodschas Bier (%), nach Brauereityp, 2033
Abbildung: 25 Kambodschanischer Biermarkt, nach Vertriebskanal, CAGR (%), 2024–2033
Abbildung: 26 Marktanteil Kambodschas Bier (%), nach Vertriebskanal, 2024
Abbildung: 27 Marktanteil Kambodschas Bier (%), nach Vertriebskanal, 2033
Abbildung: 28 Anheuser-Busch Companies LLC: Geografische Umsatzsegmentierung, 2024
Abbildung: 29 Carlsberg Brauereien A/S: Umsatzsegmentierung nach Geschäftsfeld, 2024
Abbildung: 30 Carlsberg Brauereien A/S: Umsatzsegmentierung nach Region, 2024
Abbildung: 31 Heineken International BV: Umsatzsegmentierung nach Region, 2024
Abbildung: 32 Molson Coors Beverage Company: Umsatzsegmentierung nach Region, 2024


Merkmale | Lizenzart | ||||
Datenbuch | Einzelbenutzer |   Mehrere Benutzer | Unternehmen | ||
| E-Zugang | ✓ | ✓ | ✓ | ✓ | |
Benutzerfreigabe | Nur für 1 Benutzer | Nur für 1 Benutzer | Bis zu 7 Benutzer | Unbegrenzter Benutzerzugriff | |
⨉ | ⨉ | ⨉ | ✓ | ||
Kostenlose Anpassung | Keine kostenlose Anpassung | Bis zu 30 Stunden Arbeit | Bis zu 60 Stunden Arbeit | Bis zu 80 Arbeitsstunden | |
Lieferformat |
| ⨉ | ✓ | ✓ | ✓ |
| ✓ | ⨉ | ✓ | ✓ | |
| ⨉ | ⨉ | ⨉ | ✓ | |
Analystenunterstützung | 2 Monate Analystenunterstützung | 4 Monate Analystenunterstützung | 7 Monate Analystenunterstützung | Ein Jahr Analystenbetreuung | |
Kostenloses Bericht-Update im nächsten Aktualisierungszyklus | ⨉ | ⨉ | ⨉ | ✓ | |
Kostenloses Branchen-Update (Innerhalb von 180 Tagen) | ⨉ | ⨉ | ⨉ | ✓ | |
Nutzen | Bis zu 10 % Rabatt nach dem Kauf | Bis zu 20 % Rabatt nach dem Kauf | Bis zu 30 % Rabatt nach dem Kauf | Bis zu 40 % Rabatt nach dem Kauf | |