Market Scenario
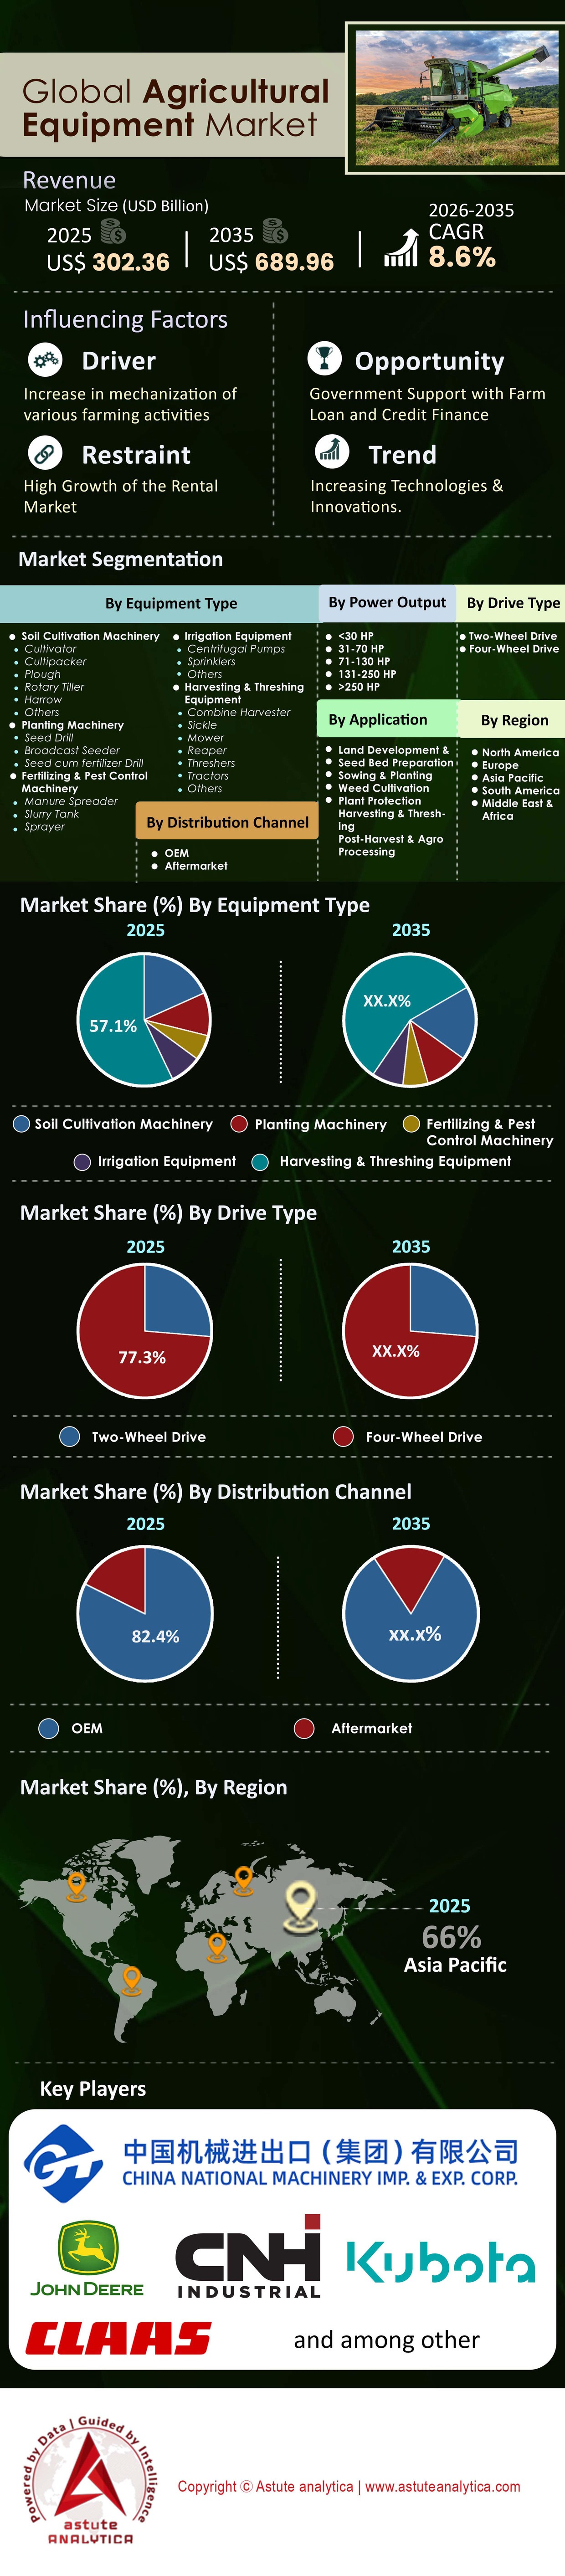
Agriculture equipment market was valued at US$ 302.36 billion in 2025 and is projected to reach a market valuation of US$ 689.96 billion by 2035 at a CAGR of 8.6% during the forecast period 2026-2035.
As of early 2026, the global agriculture equipment market has transitioned from a phase of pure mechanization to an era defined by digital integration and autonomy.
While the headline growth appears steady, the underlying value drivers have shifted dramatically. In 2025, for the first time, software, sensors, and precision technology accounted for over 18% of the total bill of materials (BOM) in high-horsepower tractors, up from just 8% in 2020.
Critical Strategic Takeaways for 2026:
- The Replacement Cycle: North American and European markets are in a "super-cycle" of fleet replacement, driven not by wear-and-tear, but by the obsolescence of non-connected machinery.
- The Energy Dilemma: While electrification is surging in the <75 HP compact segment, the heavy-duty sector (>150 HP) is pivoting toward Renewable Diesel and Hydrogen combustion, rejecting full EV due to battery density weight penalties.
- Inventory Normalization: The supply chain volatility of 2022-2024 has stabilized. Dealer inventory levels are back to pre-pandemic norms (approx. 20-22% stock-to-sales ratio), signaling a return to a buyer-driven market.
- By power output, 71-130 HP segment of the global agriculture equipment market accounted for 44.6% revenue share.
- Based on drive type, two-wheel drive equipment, which made up an impressive 77.3% share.
- By Application, harvest and threshing machinery is the most popular segment in the global agriculture equipment market, with a whopping 33% of the total revenue.
- By Region, Asia Pacific controls the largest 66% market share.
To Get more Insights, Request A Free Sample
Macro-Economic Factors: Which Forces Are Shaping Supply Chains in 2026?
Three macro-economic levers are currently dictating market pricing and availability:
- Commodity Price Volatility: With wheat and corn prices stabilizing in late 2025 after the geopolitical spikes of previous years, farmer net income has normalized. However, input costs (fertilizer, seeds) remain high, pushing farmers toward machinery that guarantees yield efficiency over raw horsepower.
- Interest Rates & Financing: High global interest rates (hovering around 4-6% in key Western markets) have dampened pure CAPEX spending. This has given rise to aggressive subsidized financing from OEM captives (e.g., John Deere Financial, CNH Industrial Capital) to move inventory.
- The "China + 1" Manufacturing Shift: Supply chain resilience strategies have reshaped production. By 2025, India and Vietnam have seen a 15% increase in component manufacturing for global OEMs, reducing reliance on Chinese casting and hydraulic exports.
Technology Deep Dive: Is Precision Agriculture the New Standard or Still Niche?
Precision agriculture is no longer a premium add-on, it is the standard operating procedure (SOP) for commercial farming.
- Connectivity penetration: As of 2025, 70% of new tractors sold in North America and Europe >100 HP are "factory-connected" via JDLink, AFS Connect, or similar telematics.
- Variable Rate Technology (VRT): Adoption has crossed the chasm. VRT for seeding and fertilizing is now used on 55% of acreage in the US Corn Belt. The driver is cost reduction; VRT reduces fertilizer waste by an estimated 15-20%.
- See & Spray Technologies: The deployment of AI-driven computer vision sprayers (identifying weeds vs. crops in real-time) has disrupted the sprayer market. This technology reduces herbicide use by up to 70%, creating a massive ROI justification for the high upfront equipment cost.
Market Dynamics: What Fuels the Market and What Holds It Back?
Primary Drivers:
- Global Labor Crisis: The average age of farmers in the US is 58; in Japan, it is 67. The labor pool is shrinking. Automation is not a luxury; it is an existential necessity to maintain output.
- Food Security Mandates: Governments in India and China are heavily subsidizing mechanization to ensure domestic food security, driving volume growth in the APAC region.
Primary Restraints:
- Right-to-Repair Friction: Litigation and legislation regarding the farmer's right to repair software-locked machinery continue to create friction between OEMs and customers, occasionally delaying purchase decisions in favor of older, mechanical models.
- Cost of Ownership: The price of a flagship combine harvester has crossed the $1 Million threshold. This capital intensity creates high barriers to entry for small-to-mid-sized operations.
How Is the Tractor Segment Evolving Beyond Horsepower?
Tractors remain the powerhouse of the agricultural equipment market, accounting for 40-45% of total market value. However, the segmentation is categorized into:
- < 40 HP (Compact/Utility): This segment is volume-driven, led by hobby farmers and landscaping in the West, and primary agriculture in India. Growth Strategy: Electrification. This segment is rapidly transitioning to EV due to low torque requirements and short run times.
- 40 – 100 HP (Mid-Range): The "workhorse" segment. Growth is flat in developed markets but surging in Brazil and Southeast Asia as farmers upgrade from manual labor.
- >100 HP (Row Crop/High Horsepower): This segment generates the highest margins. The focus here is Autonomy Level 3 (driver in the cab, but hands-off). In 2025, 4WD articulated tractors saw a 6% sales bump in North America due to soil compaction concerns, driving demand for track-system tractors (e.g., Case IH Quadtrac).
Why Demand for Combine Harvester is On the Rise After Tractors?
The global combine harvester market is highly consolidated. Innovations in 2025 focus on automation of machine settings. The agricultural equipment market is witnessing a shift toward Class 8, 9, and 10 combines. As farms consolidate, the window for harvesting narrows, necessitating machines with massive throughput capacities.
- Auto-Threshing: Modern combines use cameras and sensors to automatically adjust concave clearance and fan speed 50 times per second to minimize grain loss.
- The Used Market Anomaly: Due to the skyrocketing price of new combines, the secondary market for high-hour combines has seen value retention improve by 12% year-over-year.
How Are Smart Implements Changing Crop Processing in Agricultural Equipment Market?
The tractor is just the power source, the implement does the work.
- Smart Planters: High-speed planting technology (planting at 10mph vs. traditional 5mph) without sacrificing accuracy is driving upgrades. Electric-drive meters have replaced hydraulic drives, offering row-by-row shutoffs to prevent double planting.
- Drone Sprayers: In APAC (specifically China and Japan), agriculture drones have cannibalized the market for boom sprayers in rice paddies. In 2025, agricultural drone sales in Asia outpaced ground sprayer growth by a factor of 3:1.
The Electrification & Alternative Fuels Landscape: Are Electric Tractors Ready?
This is the most debated topic in the agricultural equipment market. The 2025 consensus is clear: One fuel does not fit all.
- Battery Electric (BEV): Dominating the <75 HP segment (vineyards, orchards, hobby farms). Monarch Tractor and Kubota have gained significant traction here.
- Methane/Biogas: New Holland has successfully commercialized the T6 Methane Power tractor. This fits the "Energy Independent Farm" model, where dairy farms convert manure to fuel.
- Hydrogen/Renewable Diesel: For 200+ HP machines working 14-hour days during harvest, batteries are too heavy. OEMs like JCB and Cummins are betting on Hydrogen combustion engines as the zero-carbon solution for heavy ag.
Competitive Landscape: Who Leads the Global Agricultural Equipment Market
The market is an oligopoly dominated by the "Big Four," but the moat is changing.
- John Deere: The undisputed leader in tech. Their strategy is to monetize software (SaaS for farming). They are targeting 10% of revenue from recurring software subscriptions by 2030.
- CNH Industrial (Case IH / New Holland): the company has strong focus on alternative fuels (Methane) and autonomy through their acquisition of Raven Industries.
- AGCO (Fendt / Massey Ferguson): Fendt is positioning itself as the "Premium/Luxury" tech leader, capturing high-end market share in North America agricultural equipment market.
- Kubota: Dominating the compact segment and aggressively investing in robotics and autonomous fruit picking startups.
Disruptors: Stakeholders in the market will have to keep an eye on Mahindra & Mahindra. Already the volume leader, they are aggressively expanding their global footprint and tech stack through acquisitions in Turkey and Finland.
Pricing Trends & Ownership Models: How Are Models Shifting from CAPEX to OPEX?
As of early 2026, the traditional "Cash or Loan" purchase model is being disrupted in the global agricultural equipment market.
- Leasing Surge: Operating leases now account for 35% of new equipment transactions in the US, up from 25% five years ago. Farmers prefer to return the asset after 3 years to avoid technology obsolescence.
- Pay-Per-Acre Models: Some OEMs are piloting models where the farmer pays a lower upfront cost for the machine but pays a "per-acre" fee to unlock high-level features like autonomy or VRT.
- Used Equipment Pricing: The spread between new and used prices has widened. A 5-year-old tractor is now 60% of the price of a new one (historically 70-75%), reflecting the premium placed on new software capabilities.
Segmental Analysis of the Agricultural Equipment Market
By Power Output, Mid-Range Versatility Driving Dominance in Modern Farm Consolidation
The 71-130 HP segment commands the market with over 44.6% market share by striking an optimal balance between power and versatility, making it the preferred choice for mixed-farming operations globally. This power range effectively bridges the gap between compact utility tractors and high-horsepower row-crop machines, addressing the needs of consolidating farms in Europe and North America that require multi-functional equipment for both tillage and livestock tasks.
According to John Deere’s 2024 Annual Report, the "Small Ag & Turf" segment, which heavily relies on this horsepower class, generated $10.97 billion in net sales, underscoring its immense revenue contribution despite broader market headwinds. Farmers favor this segment for its ability to handle heavier implements than compact tractors while maintaining better fuel economy than high-HP models.
The sustained demand is further evidenced by manufacturers pivoting toward "utility-plus" models that integrate precision technology previously reserved for larger machines, ensuring this segment remains the volume and revenue anchor of the industry.
By Drive Type, Cost-Effective Two-Wheel Drive Solutions Securing Emerging Market Hegemony
Two-wheel drive (2WD) tractors retain an overwhelming 77.3% market share due to their cost-effectiveness and specific suitability for the soil conditions and crop types prevalent in high-volume markets like India and China. While 4WD offers better traction, the 2WD configuration remains the economic backbone for millions of smallholder farmers in Asia Pacific who operate on flat terrain and require affordable mechanization. Mahindra & Mahindra, the world’s largest tractor manufacturer by volume and a dominant 2WD player, reported sales of 378,386 units in FY2024, validating the sheer scale of this segment’s demand.
Furthermore, the simplicity of 2WD engineering translates to lower maintenance costs, a critical decision factor for developing economies. Data from the Federation of Automobile Dealers Associations (FADA) indicates that India alone, primarily a 2WD market, saw retail tractor sales reach 894,112 units in 2024, proving that despite technological advancements in 4WD, the 2WD segment remains the undisputed volume leader.
Customize This Report + Validate with an Expert
Access only the sections you need—region-specific, company-level, or by use-case.
Includes a free consultation with a domain expert to help guide your decision.
By Application, Harvesting and threshing machinery Captures the Largest Market Share
Harvesting and threshing machinery captures the highest 33% revenue share primarily because it addresses the agricultural sector's most critical pain point: the chronic global labor shortage. As rural populations migrate to urban centers, farmers are forced to substitute manual labor with high-capacity combines and forage harvesters to ensure food security. These machines represent high-value capital investments, significantly inflating segmental revenue compared to lower-cost tillage implements.
Even amidst cyclical downturns, the strategic importance of this machinery is visible; for instance, while CNH Industrial reported a 33% drop in North American combine demand in late 2024, the segment remains the revenue heavyweight due to high unit costs. The push for autonomy is strongest here, as efficiency in the harvest window is non-negotiable for preserving crop value.
To Understand More About this Research: Request A Free Sample
Regional Analysis: Where Is the Demand Saturation Point in North America & Europe?
North America is the Second Largest Agricultural Equipment Market
Status: Mature, Replacement Market.
The regional market size reached $45.2 billion in 2025 (AEM data), but growth slowed to 2.1% YoY amid high inventory levels and farmer debt at 15-year highs ($500B+ outstanding).
- Key Trend: Dealership consolidation accelerates. "Mom and Pop" dealers have declined 35% since 2020 (AGCO/John Deere reports), replaced by mega-groups like Titan Machinery (50+ locations). This boosts aftermarket service revenue (up 12% YoY) but erodes pricing power, with average tractor discounts hitting 18-22% in 2025.
- Regulation: Fully integrated Tier 4 Final/Tier 5 emissions. Compliance is near-universal (98% fleet penetration), shifting demand to retrofits and electric/hybrid prototypes; however, saturation looms as 70% of tractors are now post-2015 models needing minimal upgrades.
- Saturation Signals: Precision ag adoption plateaus at 65% (Farm Journal Pulse), with used equipment sales surging 25% YoY—pointing to a replacement cycle peak by 2027 unless AI-autonomous tech (e.g., John Deere's See & Spray) sparks greenfield demand.
Europe Position is Driven By Technology & Regulation
Market valued at $38.7 billion in 2025 (Statista), fueled by CAGR of 4.5% through 2035, led by robotics (15% share).
- EU "Farm to Fork" Strategy: Mandates 50% pesticide cut by 2030 and 25% organic farming expansion, boosting mechanical weeding robots (market up 28% YoY to €1.2B) and ultra-precision sprayers (e.g., Bosch/AMAzone systems with 90% chemical savings). Subsidies via CAP (Common Agricultural Policy) total €8B annually, but dependency risks backlash if yields drop 5-10% as projected.
- Key Trend: Autonomy and sustainability tech dominance. Robotic spot-spraying adoption hit 22% in Western Europe (vs. 8% East), driven by firms like AGCO's Fendt Xaver; however, high CAPEX (€200K+ per unit) limits scale to large farms (>500 ha).
- Regulation Nuances: Stage V emissions + EED (Energy Efficiency Directive) enforce electrification; 40% of new tractors now hybrid/electric.
- Saturation Signals: High-density regions (Netherlands, Germany) show 75% precision tech penetration, with fleet renewal slowing (avg. age 12 years). Demand may cap at 3% growth post-2028 without broader AI integration or Eastern EU catch-up..
Why Is Asia-Pacific the Engine of Volume Growth?
India:
Volume Leader: India remains the world's largest tractor market by unit volume, selling over 900,000 units annually. The market is dominated by cost-effective, mechanical tractors (30-50 HP). However, "Tractor-as-a-Service" (TaaS) rentals are exploding, allowing poor farmers to access machinery without ownership.
China:
The government's push for land consolidation (turning small plots into cooperatives) is rapidly increasing the average horsepower demand. Domestic brands (YTO, Lovol) are aggressive, but premium Western brands still hold sway for high-tech harvesting.
Future Outlook (2026-2035): What Does the Future of Agricultural Equipment Market Look Like?
Looking toward 2035, the morphology of farm equipment will change fundamentally.
- Swarm Robotics: We predict a partial pivot away from "Monster Machinery." Instead of one 500 HP tractor compressing the soil, farms will utilize "swarms" of five 100 HP autonomous units working in concert. This reduces soil compaction and risk (if one breaks, the fleet keeps working).
- The Operator-Less Farm: By 2030, fully autonomous tillage and grain cart operations will be legal and insured in major Western markets.
- Data as the Crop: The data harvested by the machine will eventually become as valuable as the crop itself, sold to commodity traders, insurers, and agronomists.
Analyst at Astute Analytica recommends that stakeholders should stop viewing this as a machinery market and start viewing it as a Robotics and SaaS market. The winners of the next decade will not be those with the strongest engines, but those with the smartest neural networks.
Top Players in Global Agriculture equipment market
- AGCO Corporation
- Bellota
- China National Machinery Industry Corporation Ltd.
- CLAAS KGaA MBH
- CNH Industrial N.V.
- Deere & Company
- Escorts Limited
- Horsch Maschinen GmbH
- J.C. Bamford Excavators Ltd.
- Kubota Corporation
- Mahindra & Mahindra Ltd.
- MARUYAMA MFg., Co.Inc.
- Maschio Gaspardo S.P.A.
- Mater Macc S.p.A.
- Morris Industries Ltd.
- SDF S.p.A.
- TAFE
- Valmont Industries, Inc.
- Other Prominent Players
Market Segmentation Overview
By Equipment Type
- Soil Cultivation Machinery
- Cultivator
- Cultipacker
- Plough
- Rotary Tiller
- Harrow
- Others
- Planting Machinery
- Seed Drill
- Broadcast Seeder
- Seed cum fertilizer Drill
- Fertilizing & Pest Control Machinery
- Manure Spreader
- Slurry Tank
- Sprayer
- Irrigation Equipment
- Centrifugal Pumps
- Sprinklers
- Others
- Harvesting & Threshing Equipment
- Combine Harvester
- Sickle
- Mower
- Reaper
- Threshers
- Tractors
- Others
By Power Output
- <30 HP
- 31-70 HP
- 71-130 HP
- 131-250 HP
- >250 HP
By Drive Type
- Two-Wheel Drive
- Four-Wheel Drive
By Application
- Land Development & Seed Bed Preparation
- Sowing & Planting
- Weed Cultivation
- Plant Protection
- Harvesting & Threshing
- Post-Harvest & Agro Processing
By Distribution Channel
- OEM
- Aftermarket
By Region
- North America
- The U.S.
- Canada
- Mexico
- Europe
- The UK
- Germany
- France
- Italy
- Spain
- Poland
- Russia
- Belgium
- Rest of Europe
- Asia Pacific
- China
- India
- Japan
- Australia & New Zealand
- South Korea
- ASEAN
- Thailand
- Singapore
- Vietnam
- Indonesia
- Malaysia
- Philippines
- Rest of ASEAN
- Rest of Asia Pacific
- Middle East & Africa (MEA)
- UAE
- Saudi Arabia
- South Africa
- Rest of MEA
- South America
- Argentina
- Brazil
- Rest of South America
FREQUENTLY ASKED QUESTIONS
Valued at US$ 302.36 billion in 2025, it's projected to reach US$ 689.96 billion by 2035, growing at a CAGR of 8.6% (2026-2035), fueled by precision tech and APAC volume.
The 71-130 HP segment holds 44.6% revenue share, balancing versatility for mixed farming with fuel efficiency, ideal for consolidating farms in Europe and North America.
2WD claims 77.3% share due to cost-effectiveness and suitability for flat terrains in high-volume APAC markets like India, where Mahindra sold 378k units in FY2024.
This 33% revenue leader addresses labor shortages via high-capacity automation; combines now auto-adjust 50x/second to cut grain loss, justifying $1M+ prices.
APAC holds 66% share, with India's 900k+ annual tractor sales via TaaS models and China's land consolidation boosting HP demand for premium harvesting tech.
The agricultural equipment market likely to shift to swarm robotics, operator-less farms, and SaaS (e.g., John Deere's 10% revenue target).
LOOKING FOR COMPREHENSIVE MARKET KNOWLEDGE? ENGAGE OUR EXPERT SPECIALISTS.
SPEAK TO AN ANALYST
.svg)


Features | Type of License | ||||
Data Book | Single User |   Multi User | Corporate | ||
| e-Access | ✓ | ✓ | ✓ | ✓ | |
User Sharing | 1 User Only | 1 User Only | Up to 7 Users | Unlimited User Access | |
⨉ | ⨉ | ⨉ | ✓ | ||
Free Customization | No Free Customization | Up To 30 hrs work | Up To 60 hrs work | Up To 80 hrs work | |
Deliverable |
| ⨉ | ✓ | ✓ | ✓ |
| ✓ | ⨉ | ✓ | ✓ | |
| ⨉ | ⨉ | ⨉ | ✓ | |
Analyst Support | 2-Months Analyst Support | 4-Months Analyst Support | 7-Months Analyst Support | One Year Analyst Support | |
Free Report update in next update cycle | ⨉ | ⨉ | ⨉ | ✓ | |
Free Industry Update (Within 180 days) | ⨉ | ⨉ | ⨉ | ✓ | |
Benefit | Up to 10% off on Post Purchase | Up to 20% off on Post Purchase | Up to 30% off on Post Purchase | Up to 40% off on Post Purchase | |