Market Scenario
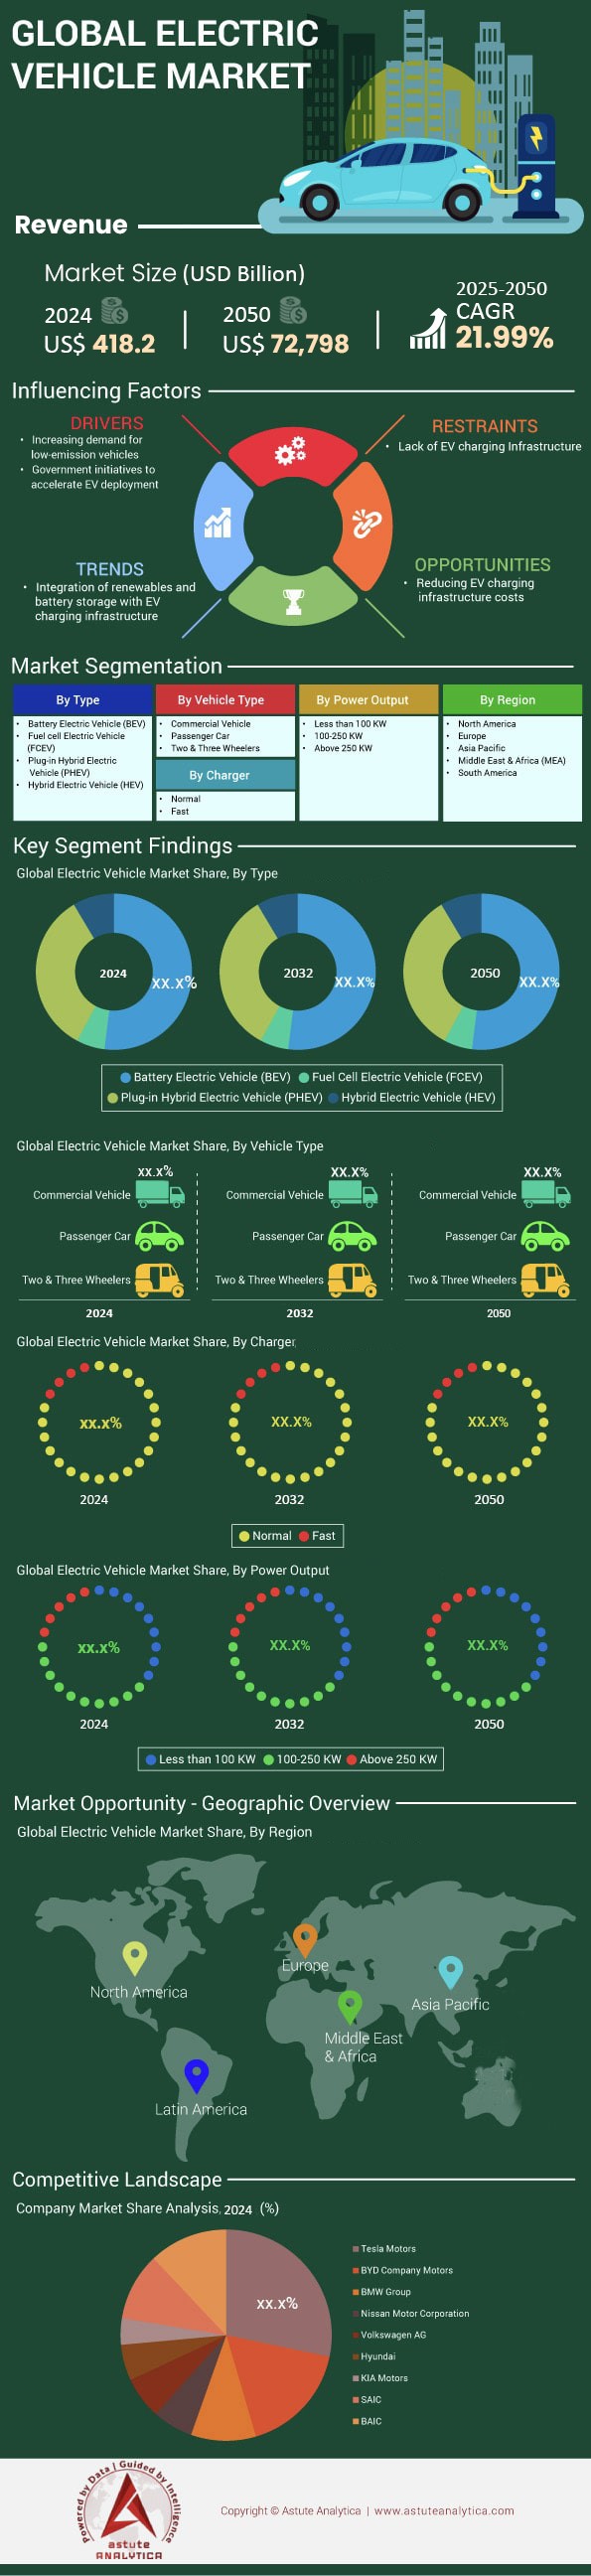
Electric vehicle market was valued at US$ 646.7 billion in 2025 and is estimated to witness a major leap forward in revenue to US$ 72,798 billion by 2050. The market is registering a CAGR of 21.99% during the forecast period 2026-2050.
Key Findings in Electric Vehicle Market
- By Type: Battery Electric Vehicles Control Over 52% Market Share.
- By Vehicle Type: Passenger Cars Control Over 53% of Electric Vehicle Market Share.
- By Power Output: 100–250 KW Holds Over 41.8% Market Share.
- By Charger: Normal Chargers Take Up Over 87.5% Share
- By Region: Asia Pacific Command Over 50% Market Valuation
As we close the books on 2025 and enter Q1 2026, the global Electric Vehicle (EV) market has fundamentally shifted from a "hype cycle" to a phase of industrial rationalization. The era of speculative valuations for pre-revenue startups is over; the current market is defined by unit economics, manufacturing efficiency, and ruthless price competition.
Total global sales volumes hit 17.8 million units, representing a 21.4% market penetration of all new passenger vehicles sold worldwide. While this falls slightly short of the hyper-aggressive forecasts made in 2021, it represents a robust CAGR of nearly 22% over the last three years.
The "Two-Track" Growth Reality:
Astute Analytica’s recent analysis observe a distinct decoupling in electric vehicle market velocity:
- China: Has reached "Early Majority" saturation with 42% of new car sales being electric, driven by domestic fierce competition.
- West (US/EU): Growth has stabilized at a slower CAGR of 16%, hampered by high interest rates and the withdrawal of purchasing subsidies in key markets like Germany and the UK.
The metric to watch in 2026 is no longer just "sales growth," but "inventory turnover." Days Sales of Inventory (DSI) for EVs in the US has crept up to 92 days, indicating that production is temporarily outpacing demand at current price points.
To Get more Insights, Request A Free Sample
How do fluctuating interest rates and geopolitical trade tensions specifically impact EV affordability and OEM profit margins?
The correlation between Federal Reserve/ECB interest rates and EV adoption has proven to be stronger than initial elasticity models predicted in the electric vehicle market. With auto loan rates averaging 7.8% in the US and 6.5% in the Eurozone throughout 2025, the monthly payment for an average EV ($48,000) became 22% more expensive than in 2022. This capital cost has disproportionately hurt "mass-market" adoption, forcing OEMs to slash prices to maintain volume, thereby eroding gross margins from a healthy 15-20% down to single digits for legacy automakers.
Geopolitical Trade Friction:
The trade landscape in the electric vehicle market has fragmented into protectionist blocs.
- The "Fortress Europe" Strategy: The EU’s anti-subsidy investigation into Chinese EVs resulted in definitive tariffs ranging from 10% to 25%. However, Chinese OEMs like BYD and SAIC have countered this by establishing local manufacturing hubs in Hungary and Spain, effectively bypassing tariffs by "localizing" assembly.
- US FEOC Rules: The Inflation Reduction Act’s "Foreign Entity of Concern" (FEOC) rules have officially kicked in (Jan 1, 2025), disqualifying vehicles with battery components from China. This has temporarily reduced the list of tax-credit-eligible vehicles to fewer than 15 models, creating a short-term demand air pocket in the US market.
Where are the Diverging Growth Rates Between Saturated Markets Like Norway and Emerging Opportunities In Southeast Asia and India?
While Western media focuses on the "cooling" of EV demand, the Global South is experiencing an electrification explosion, albeit in different form factors across the electric vehicle market.
The Divergence Matrix:
- Mature Markets (Norway, Netherlands, China Tier-1 Cities): These regions have passed the inflection point. Growth is now driven by replacement cycles rather than new adoption. The battle here is for brand loyalty and software services.
- Stalling Markets (USA, Germany): Here, the "Early Adopters" (tech-savvy, wealthy) are fully saturated. The market is struggling to cross the chasm to the "Early Majority" due to the lack of affordable models in the $25,000 range.
- Hyper-Growth Markets (India, ASEAN, Brazil): This is the highest alpha sector in the electric vehicle market. India’s EV adoption is not led by Tesla, but by 2-wheelers and 3-wheelers, which now constitute 55% of their respective segments. In Thailand and Indonesia, Chinese OEMs have captured 80% of the passenger EV market, leveraging the ASEAN-China Free Trade Area to flood the market with sub-$20,000 models.
Why Has The Industry Aggressively Pivoted Toward Lithium Iron Phosphate (LFP) Chemistry Over Nickel Manganese Cobalt (NMC) Variants?
If 2020-2024 was the era of "Range at all costs," 2026 is the era of "Cost per kWh." The most significant technical shift in the electric vehicle market is the dominance of LFP (Lithium Iron Phosphate) batteries.
Chemistry Market Share (Q1 2026):
- LFP: 58% (Up from 30% in 2022).
- NMC/NCA: 38% (Down from 65% in 2022).
- Sodium-Ion: 4% (Emerging).
The Granular Economics of the Electric Vehicle Market:
LFP batteries, while less energy-dense (approx. 160-170 Wh/kg vs. NMC’s 250+ Wh/kg), have achieved a pack-level cost of $75/kWh, crossing the critical affordability threshold. They are free from Cobalt (expensive, unethical supply chain) and Nickel (volatile pricing). For standard-range vehicles (up to 300 miles/480 km), LFP is now the undeniable standard in the electric vehicle market.
Astute Analytica study finds that the emergence of LMFP (Lithium Manganese Iron Phosphate) is the bridge technology to watch. By adding manganese to the LFP cathode, manufacturers are achieving a 15% voltage boost (and thus range) without sacrificing the cost benefits of the phosphate structure.
What are the Critical Upstream Bottlenecks in Lithium Refining and Cathode Processing that Threaten Electric Vehicle Market?
The narrative of "Lithium Shortage" has shifted to "Processing Choke-points." The electric vehicle market currently have sufficient raw spodumene and brine extraction capacity coming online in Australia, Chile, and Argentina. The bottleneck is refining.
The Midstream Imbalance:
As of 2026, China still controls 72% of global lithium refining capacity and 90% of anode (graphite) processing.
- North America: despite the Battery Belt boom, US refining capacity is lagging 3 years behind gigafactory cell production capacity. This forces US cell makers to ship raw ore to China for processing and then import the active material back, adding logistics costs and carbon footprint.
- Graphite Crisis: China’s export controls on graphite (implemented late 2023) are still creating supply friction in the electric vehicle market. This has accelerated the push toward Silicon-doped anodes, which not only improve charging speed but reduce reliance on graphite.
How Does the Disparity Between Public Charging Uptime Reliability and Rapid Charger Deployment Speeds Affect Consumer Confidence Levels?
"Range Anxiety" in the electric vehicle market has been replaced by "Charger Anxiety." The physical number of plugs is growing, but the Quality of Service (QoS) remains the industry's Achilles heel.
Infrastructure Data Points:
- Deployment Ratio: Global average is 1 public charger per 14 EVs (Goal is 1:10).
- Reliability Scores: In the US, non-Tesla public charging networks report an average uptime of only 78% (meaning 1 in 5 attempts fails). In contrast, the Tesla Supercharger network (now open to most OEMs via NACS adapters) maintains 99.9% uptime.
The DC Fast Charging Economics in the Electric Vehicle Market:
The deployment of Level 3 DC Fast Chargers (150kW+) faces a "demand charge" problem. Utility companies charge operators based on peak usage. For a station to be profitable, it needs high utilization (20%+). Most rural stations sit at <5% utilization, making them financial black holes without government OPEX subsidies.
Which Legacy Automotive Manufacturers are Successfully Bridging the Profitability Gap Against Pure-Play Electric Vehicle Disruptors Like Tesla and BYD?
The "Valley of Death" for legacy auto is wide. Comparing Gross Margins on EV-only divisions reveals the disparity in the electric vehicle market:
- Tesla/BYD: ~18-22% Gross Margin (Vertical Integration advantages).
- Legacy Leaders (Hyundai/Kia, BMW): ~4-8% Gross Margin (Approaching breakeven).
- Legacy Laggards (Ford, GM, VW): Negative Margins (Loss of $2,000 - $10,000 per vehicle sold).
The legacy winners (Hyundai/Kia) succeeded by building dedicated EV platforms (E-GMP) early, rather than retrofitting ICE chassis. They also secured battery joint ventures faster than their American/German counterparts. The laggards are now scaling back 2030 targets, shifting capital back to Hybrid (HEV) and Plug-in Hybrid (PHEV) interim solutions to fund the transition.
How Will the Implementation of Euro 7 Standards and EPA Tailpipe Restrictions Legally Force Fleet Electrification Timelines in the Electric Vehicle Market?
Regulations are the floor, not the ceiling.
- Euro 7 (Effective Late 2026/2027): While watered down regarding tailpipe emissions, the strict regulations on brake and tire particle emissions disproportionately affect heavy EVs. However, the corporate fleet emission targets remain the primary driver.
- US EPA Standards: The requirement for a 50% reduction in fleet-wide emissions by 2032 makes it mathematically impossible for OEMs to comply without a sales mix of at least 60% EVs. Failure to comply results in billions in fines, which acts as a "shadow tax" on ICE vehicle sales, effectively forcing OEMs to price ICE cars higher to subsidize their EV losses.
Why is the Total Cost Of Ownership (TCO) Parity Arriving Faster For Last-Mile Delivery Electric Vans Than For Heavy-Duty Long-Haul Trucking?
Commercial electrification in the global electric vehicle market is bifurcated by physics and logistics.
Last-Mile Victory:
Electric Delivery Vans (EDVs) have achieved TCO parity with diesel in 2024. This is mainly attributed to high idle times, predictable short routes (<100 miles), and regenerative braking in stop-go traffic make EDVs superior. In line with this, fleet operators like Amazon and DHL are scaling these rapidly because the ROI is under 3 years.
Long-Haul Struggle is Real in Electric Vehicle Market:
Class 8 Heavy Duty trucks face a Gravimetric Energy Density problem. To haul 500 miles, an electric truck needs a battery so heavy it reduces the payload capacity by 4,000-5,000 lbs, destroying the unit economics of freight.
- Forecast: Long-haul will likely fracture into Hydrogen Fuel Cell (FCEV) for 800km+ routes and Megawatt Charging System (MCS) BEVs for shorter, regional hub-to-hub transport.
At What Specific Point Does the Decline in Battery Pack Costs Allow Electric Vehicles To Achieve Sticker Price Parity With Internal Combustion Engines?
The electric vehicle market "Holy Grail" is $100/kWh at the pack level.
- Current Status (Feb 2026): LFP packs are trading at roughly USD 95/kWh (volume weighted average), while NMC packs are at USD 120/kWh.
- The Sticker Price Lag: Despite battery costs falling, sticker price parity is delayed by high insurance premiums and repair costs. However, in the compact segment (B-Segment), Chinese imports have already achieved parity. In the US, parity for mid-sized SUVs is projected for 2027, largely contingent on the localization of the supply chain to avoid tariffs.
What Capacity Challenges Does the Electrical Grid Face and How Can Vehicle-To-Grid (V2G) Technologies Mitigate Peak Load Stress?
If 50% of cars are electric, global electricity demand increases by roughly 12-15%. The generation capacity exists; the transmission and distribution (T&D) capacity does not.
The Local Transformer Crisis:
Neighborhood transformers, designed for 50 years ago, cannot handle clusters of EVs charging at Level 2 (7-11kW) simultaneously between 6 PM and 9 PM.
The V2G Solution:
Vehicle-to-Grid is moving from pilot to policy. With the implementation of ISO 15118-20 standards, EVs act as Virtual Power Plants (VPP).
A fleet of 10,000 electric school buses (with huge 200kWh batteries) sitting idle in summer can power a small city. Utilities are beginning to pay EV owners dynamic rates to discharge power during peak hours, turning the EV from a liability into a grid asset.
What Are the Overlooked Geopolitical and Technological Risks that Could Derail Current Electric Vehicle Adoption Forecasts For the Next Decade?
While the trend is upward, the path is fragile in global electric vehicle market.
- China Decoupling: If geopolitical tensions escalate to a total ban on Chinese EV components, Western OEMs would face a "production cliff." It would take 5-7 years to rebuild the supply chain, stalling adoption.
- Solid State Disappointment: The electric vehicle market has priced in the arrival of Solid State Batteries (SSB) by 2028-2030. If technical hurdles regarding dendrite formation and interface resistance are not solved, the expected leap in range and safety will not happen, potentially plateauing consumer interest.
- Right-Wing Populism: Political shifts in the US and Europe toward anti-ESG agendas could lead to the repeal of 2035 ICE bans, removing the regulatory "stick" driving the industry.
Segmental Analysis of the Electric Vehicle Market
By Type: Battery Electric Vehicles (BEVs) Control Over 52% Market Share
While the headline figure stands at just over 52%, the real story lies in the battery chemistry war driving this dominance. BEVs are steadily eroding the transitional appeal of Plug-in Hybrid Electric Vehicles (PHEVs), particularly in mature markets like Northern Europe and China.
The dominance of BEVs is increasingly powered by Lithium Iron Phosphate (LFP) batteries. Unlike the Nickel Manganese Cobalt (NMC) cells used in premium performance vehicles, LFP batteries have captured nearly 40-50% of the standard-range BEV market. This shift is driven by cost parity, LFP packs are roughly 20-30% cheaper to produce, enabling mass-market models like the Tesla Model 3 RWD and BYD Atto 3 to anchor this 52% share.
The "Over 52%" share is a floor, not a ceiling. As LFP technology improves energy density, BEVs will likely push this share toward 65% by 2027, relegating PHEVs to niche long-haul applications.
By Vehicle Type: Passenger Cars Control Over 53% of Electric Vehicle Market Share
The "Passenger Car" segment is technically broad, but the 53% market share highlights a specific trend: the cannibalization of sedans by Electric SUVs and Crossovers. In many data sets, "passenger cars" excludes light commercial vehicles (LCVs) and heavy trucks, but within this passenger bucket, the traditional sedan is losing ground.
The passenger car segment in the electric vehicle market is heavily skewed by the "C-segment" crossover, which balances interior utility with aerodynamic efficiency. For instance, the Tesla Model Y—technically a passenger crossover—outsells traditional electric sedans by a margin of nearly 2:1 in key regions. Furthermore, this 53% share is being fortified by the fleet and "company car" tax incentives in Europe (e.g., Germany’s Dienstwagen taxation), where electric passenger cars are mathematically the most viable option for corporate fleets compared to their ICE counterparts.
The passenger segment is not growing uniformly, it is growing vertically in the C-SUV and D-SUV categories, while electric hatchbacks (A/B-segment) remain supply-constrained outside of China.
By Power Output: 100–250 kW Holds Over 41.8% Market Share
This specific power band (approximately 134 hp to 335 hp) is the electric vehicle market’s "Goldilocks Zone." It represents the perfect equilibrium between manufacturing cost, insurance affordability, and consumer expectation for "instant torque."
Vehicles with <100 kW (e.g., Dacia Spring) are often perceived as underpowered for highway merging, while those >250 kW (e.g., Dual-Motor Performance variants) command high insurance premiums and require expensive cooling systems. The 100–250 kW segment captures the highest volume because it covers the single-motor configurations of the world's best-selling EVs, including the Volkswagen ID.4, Hyundai Ioniq 5, and the base Tesla Model 3. This power output is sufficient to deliver 0-60 mph times in the 6-8 second range—fast enough to feel "electric" but efficient enough to maximize range.
The 100-250 kw segment is expected to maintain dominance in the years to come as manufacturers are software-locking motors to stay within this bracket to reduce warranty claims and preserve battery longevity.
Customize This Report + Validate with an Expert
Access only the sections you need—region-specific, company-level, or by use-case.
Includes a free consultation with a domain expert to help guide your decision.
By Charger: Normal Chargers Take Up Over 87.5% Share
Despite the media hype around 350 kW DC hyper-chargers, the backbone of the electric vehicle market ecosystem is AC Level 2 charging (Normal Chargers). The 87.5% market share reflects the reality that EV fueling is primarily a "dwell-time" activity, not a "fill-up" activity.
The segment is mainly dominated by 7 kW to 22 kW AC chargers installed in homes, workplaces, and retail destinations. The hidden driver here is the "Overnight Charging" behavior pattern. As a result, grid operators prefer this segment as it allows for load balancing without the massive infrastructure upgrades required for DC fast charging. Furthermore, the cost disparity is massive in the electric vehicle market: a commercial DC fast charger can cost $50,000+ to install, whereas a networked AC commercial charger is often under $5,000. This economic reality ensures AC chargers will continue to scale 10x faster than public DC chargers.
The 87.5% share verifies that "Range Anxiety" is being solved not just by faster charging, but by ubiquitous slow charging. The future growth in this segment will be driven by smart-charging (V1G) capabilities that allow utilities to manage peak loads.
To Understand More About this Research: Request A Free Sample
Regional Analysis of the Electric Vehicle Market
Asia Pacific: The Global Hegemon (Dominant ~50% Share)
The Asia Pacific region has cemented its status as the "Center of Gravity" for the EV industry, accounting for nearly 60% of total global EV sales and over 50% of the standing fleet. This dominance is not monolithic, it is a dual-engine growth story.
- China: The electric vehicle market in the country has evolved from subsidy-dependence to organic, ruthless competition. With domestic penetration clearing 40%, the narrative is now "export-led growth." Chinese OEMs, facing a brutal price war at home (where margins are often <2%), are using the APAC region as a release valve for excess capacity.
- Emerging APAC (India & ASEAN): India remains the "sleeping giant" waking up. While passenger EV adoption hovers at 4-5%, the electrification of the "last mile" is near-total. Electric 2-wheelers and 3-wheelers (rickshaws) constitute 55% of new sales in their segments. Meanwhile, Thailand and Indonesia have become the manufacturing beachheads for Chinese firms (BYD, Great Wall Motor) looking to circumvent Western tariffs, creating a robust, low-cost regional supply chain completely independent of the West.
Europe: The Regulatory-Driven Stagnation
Europe presents a fractured landscape in the electric vehicle market. The region remains the second-largest market but faces headwinds that have slowed growth to single digits in Q1 2026.
- The "Germany Effect": The abrupt removal of purchase subsidies has caused a temporary collapse in private demand in Europe’s largest auto market, exposing the reality that EVs are still price-sensitive.
- The Fleet Savior: Demand is currently sustained by the corporate channel. Salary sacrifice schemes and favorable Benefit-in-Kind (BiK) taxation rates in the UK and France mean that 65% of new EVs in Europe are registered to businesses, not individuals. The looming 2035 ICE ban keeps the long-term trajectory locked in, but the short-term is volatile as legacy OEMs struggle to match the price points of imported Teslas and Chinese models.
North America: The Policy-Incentivized Bifurcation
North America electric vehicle market lags behind China and Northern Europe in penetration (roughly 12-14%) but leads in average transaction price and battery size.
- The IRA Moat: The Inflation Reduction Act has successfully re-shored manufacturing, creating a "Battery Belt" from Michigan to Georgia. However, the strict "Foreign Entity of Concern" rules have temporarily limited consumer choice by disqualifying many affordable models from tax credits.
- Segment skew: Unlike APAC’s demand for small city cars, North American demand is heavily skewed toward e-SUVs and Pickups (e.g., Rivian, Ford Lightning, Cybertruck). This creates a unique challenge: the region needs significantly more energy-dense batteries and higher-power charging infrastructure (350kW+) to satisfy the thirst of these heavy vehicles, making the infrastructure rollout more capital-intensive than in Europe or Asia.
Top Companies in the Electric Vehicle Market:
- Tesla Motors
- BMW Group
- Nissan Motor Corporation
- Toyota Motor Corporation
- Volkswagen AG
- General Motors
- Daimler AG
- Energica Motor Company S.p.A.
- BYD Company Motors
- Ford Motor Company
- Zhejiang Geely Holding Group
- Tata Motors Limited
- Mahindra & Mahindra Limited
- MG Motor India
- Olectra Greentech Ltd.
- JBM Auto Limited
- Other Prominent Players
Market Segmentation Overview:
By Type:
- Battery electric vehicle (BEV)
- Fuel cell electric vehicle (FCEV)
- Plug-in hybrid electric vehicle (PHEV)
- Hybrid electric vehicle (HEV)
By Vehicle Type:
- Commercial Vehicle
- Passenger Car
- Two & Three Wheelers
By Charger:
- Normal
- Fast
By Power Output:
- Less than 100 KW
- 100-250 KW
- Above 250 KW
By Region:
- North America
- The U.S.
- Canada
- Mexico
- Europe
- Western Europe
- The UK
- Germany
- France
- Italy
- Spain
- Rest of Western Europe
- Eastern Europe
- Poland
- Russia
- Rest of Eastern Europe
- Western Europe
- Asia Pacific
- China
- India
- Japan
- Australia & New Zealand
- South Korea
- ASEAN
- Rest of Asia Pacific
- ASEAN
- Indonesia
- Malaysia
- Philippines
- Thailand
- Vietnam
- Singapore
- Cambodia
- Rest of ASEAN
- Middle East & Africa (MEA)
- Saudi Arabia
- South Africa
- UAE
- Rest of MEA
- South America
- Argentina
- Brazil
- Rest of South America
REPORT SCOPE
| Report Attribute | Details |
|---|---|
| Market Size Value in 2025 | US$ 646.7 Bn |
| Expected Revenue in 2050 | US$ 72,798 Bn |
| Historic Data | 2022-2024 |
| Base Year | 2025 |
| Forecast Period | 2026-2050 |
| Unit | Value (USD Bn) |
| CAGR | 21.99% |
| Segments covered | By Type, By Vehicle Type, By Charger, By Power Output, By Region |
| Key Companies | Tesla Motors, BMW Group, Nissan Motor Corporation, Toyota Motor Corporation, Volkswagen AG, General Motors, Daimler AG, Energica Motor Company S.p.A., BYD Company Motors, Ford Motor Company, Zhejiang Geely Holding Group, Tata Motors Limited, Mahindra & Mahindra Limited, MG Motor India, Olectra Greentech Ltd., JBM Auto Limited, Other Prominent Players |
| Customization Scope | Get your customized report as per your preference. Ask for customization |
FREQUENTLY ASKED QUESTIONS
By 2050, the global EV market to reach maturity with annual valuation exceeding USD 72.80 Trillion. Volume plateaus at 90-100 million units annually, aligning with population replacement. Revenue shifts: 40% from software services, autonomous MaaS, and battery recycling.
Yes. LFP packs handle 3,000-5,000 cycles, at 250-mile range, that's 750,000-1.2 million miles—beyond chassis life. Modern liquid-cooled packs degrade <10% after 150,000 miles, unlike early Nissan Leaf issues.
EVs have 30-40% higher upfront emissions from batteries. Break-even at 15,000-20,000 miles; over 200,000 miles, EVs emit 60-70% less CO2 than ICE, even on partial grids.
BEVs win passenger cars (70-80% efficient vs. hydrogen's 30%). Hydrogen niches in heavy trucking for >800km routes, if green H2 drops below $4/kg.
Early EVs depreciate faster due to battery fears. By 2028, with health certificates and transferable FSD licenses, electric vehicle market hold value better than ICE amid regulations.
Yes, via smart charging/TOU/V2G. Peak load—not total energy—is key; EVs stabilize grids by storing solar daytime and discharging evenings as distributed batteries.
LOOKING FOR COMPREHENSIVE MARKET KNOWLEDGE? ENGAGE OUR EXPERT SPECIALISTS.
SPEAK TO AN ANALYST
.svg)


Features | Type of License | ||||
Data Book | Single User |   Multi User | Corporate | ||
| e-Access | ✓ | ✓ | ✓ | ✓ | |
User Sharing | 1 User Only | 1 User Only | Up to 7 Users | Unlimited User Access | |
⨉ | ⨉ | ⨉ | ✓ | ||
Free Customization | No Free Customization | Up To 30 hrs work | Up To 60 hrs work | Up To 80 hrs work | |
Deliverable |
| ⨉ | ✓ | ✓ | ✓ |
| ✓ | ⨉ | ✓ | ✓ | |
| ⨉ | ⨉ | ⨉ | ✓ | |
Analyst Support | 2-Months Analyst Support | 4-Months Analyst Support | 7-Months Analyst Support | One Year Analyst Support | |
Free Report update in next update cycle | ⨉ | ⨉ | ⨉ | ✓ | |
Free Industry Update (Within 180 days) | ⨉ | ⨉ | ⨉ | ✓ | |
Benefit | Up to 10% off on Post Purchase | Up to 20% off on Post Purchase | Up to 30% off on Post Purchase | Up to 40% off on Post Purchase | |