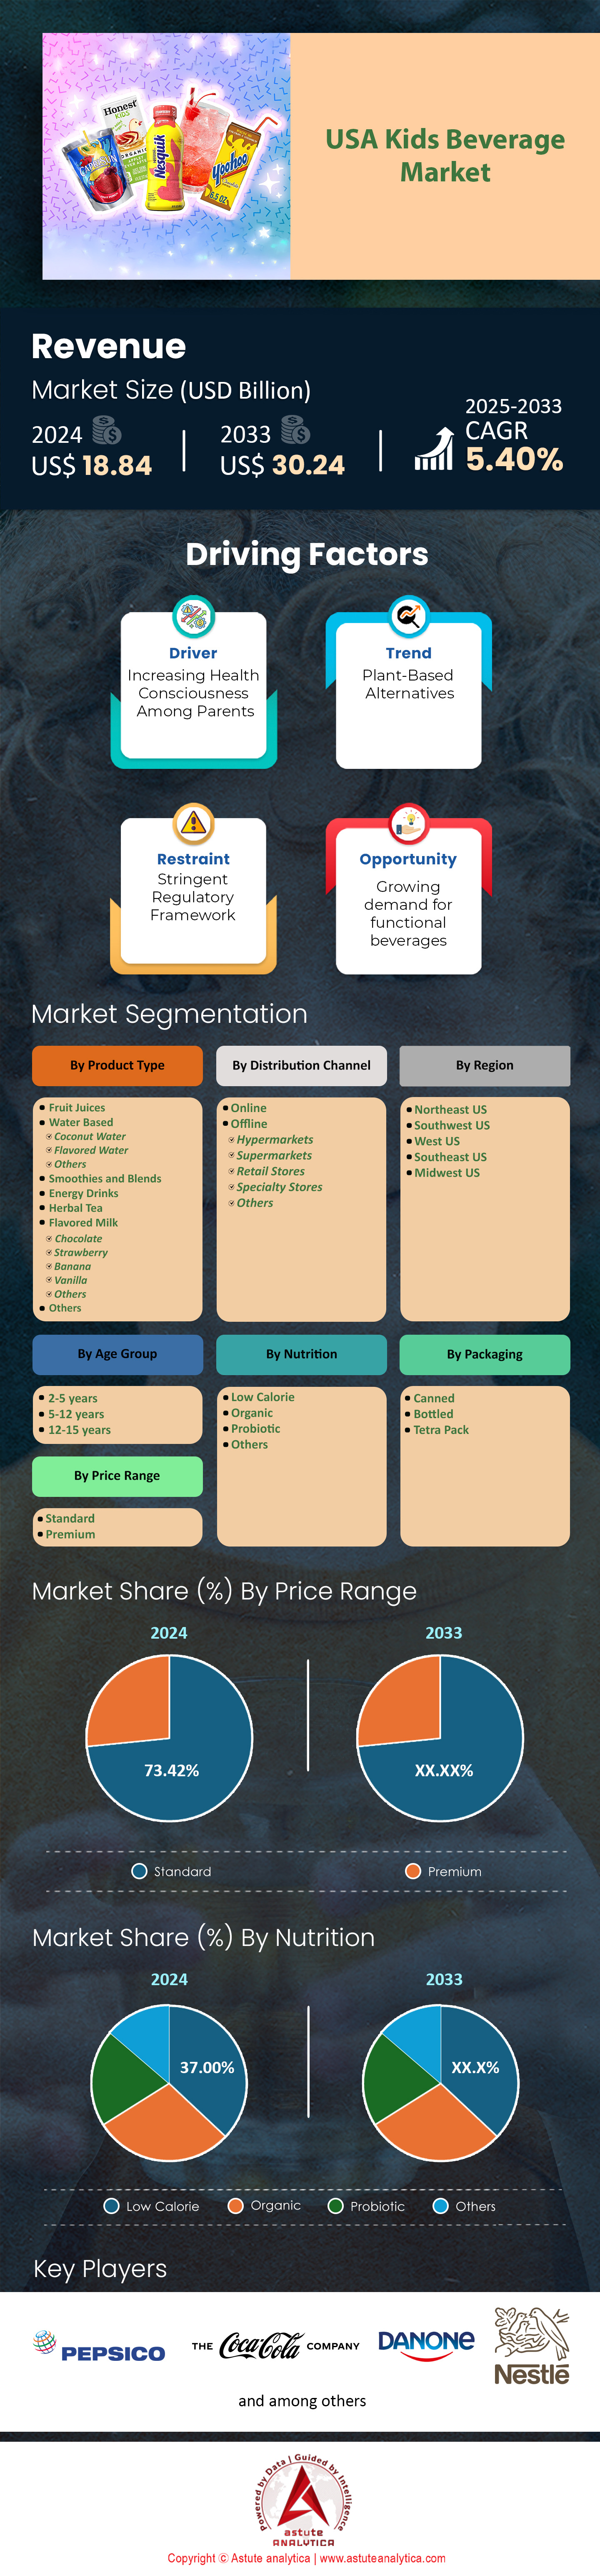
美国儿童饮料市场:按产品类型(果汁、水基饮料、冰沙和混合饮料、能量饮料、花草茶、风味牛奶、其他);营养成分(低卡路里、有机、益生菌、其他);年龄段(2-5岁、5-12岁、12-15岁);包装(罐装、瓶装、泰特袋);价格范围(标准、高端);分销渠道(线上、线下);区域——2025-2033年市场预测与分析
- 最后更新日期:2025年5月4日 | | 报告编号:AA0623458
表1:行业展望:5-18岁人群健康饮料消费建议;
表2:行业展望:美国1-5岁儿童上周含糖饮料消费百分比(按社会人口特征划分,2021年)
;表3:制约因素:严格的监管框架
;表4:市场动态与趋势:市场动态影响分析
;表5:产品价格分析:基于产品类型的价格分析(美元/单位);
表6:2020-2033年美国儿童饮料市场规模(十亿美元),按产品类型划分;
表7:2020-2033年美国儿童饮料市场规模(十亿美元),按营养成分划分;
表8:2020-2033年美国儿童饮料市场规模(十亿美元),按年龄组划分;
表9:2020-2033年美国儿童饮料市场规模(十亿美元),按包装方式划分。 2020-2033年
美国儿童饮料市场规模(十亿美元),按价格区间划分;表10:2020-2033年
美国儿童饮料市场规模(十亿美元),按分销渠道划分;表11:2020-2033年
美国儿童饮料市场规模(十亿美元),按地区划分;表12:2020-2033年美国
东北部儿童饮料市场规模(十亿美元),按产品类型划分;表13:2020-2033年美国东北部儿童
饮料市场规模(十亿美元),按营养成分划分;表14:2020-2033年美国东北部儿童
饮料市场规模(十亿美元),按年龄组划分;表15:2020-2033年美国东北部儿童饮料市场规模(十亿美元
),按包装划分;表17:2020-2033年美国东北部儿童饮料市场规模(十亿美元),按包装
划分。美国儿童饮料市场规模(亿美元),按价格区间划分,2020-2033年
表18 美国东北部儿童饮料市场规模(亿美元),按分销渠道划分,2020-2033年
表19 美国西南部儿童饮料市场规模(亿美元),按产品类型划分,2020-2033年
表20 美国西南部儿童饮料市场规模(亿美元),按营养成分划分,2020-2033年
表21 美国西南部儿童饮料市场规模(亿美元),按年龄组划分,2020-2033年
表22 美国西南部儿童饮料市场规模(亿美元),按包装划分,2020-2033年
表23 美国西南部儿童饮料市场规模(亿美元),按价格区间划分,2020-2033年
表24 美国西南部儿童饮料市场规模(亿美元),按分销渠道划分,2020-2033年;
表25:美国西部儿童饮料市场规模(十亿美元)
表26:美国西部儿童饮料市场规模(十亿美元),
;表27:美国西部儿童饮料市场规模(十亿美元),按营养成分划分,2020-2033年;
表28:美国西部儿童饮料市场规模(十亿美元),按年龄组划分,2020-2033年;表
29:美国西部儿童饮料市场规模(十亿美元),按包装划分,2020-2033年;
表30:美国西部儿童饮料市场规模(十亿美元),按价格范围划分,2020-2033年;
表31:美国东南部儿童饮料市场规模(十亿美元),按产品类型划分,2020-2033年。
表32:美国东南部儿童饮料市场规模(亿美元),按营养成分划分,2020-2033年;
表33:美国东南部儿童饮料市场规模(亿美元),按年龄组划分,2020-2033年;
表34:美国东南部儿童饮料市场规模(亿美元),按包装类型划分,2020-2033年;
表35:美国东南部儿童饮料市场规模(亿美元),按价格区间划分,2020-2033年;
表36:美国东南部儿童饮料市场规模(亿美元),按分销渠道划分,2020-2033年;
表37:美国中西部儿童饮料市场规模(亿美元),按产品类型划分,2020-2033年;
表38:美国中西部儿童饮料市场规模(亿美元),按营养成分划分,2020-2033年;
表39:美国中西部儿童饮料市场规模(十亿美元),按年龄组划分,2020-2033
年表:40 美国中西部儿童饮料市场规模(十亿美元),按包装划分,2020-2033
年表:41 美国中西部儿童饮料市场规模(十亿美元),按价格范围划分,2020-2033
年表:42 美国中西部儿童饮料市场规模(十亿美元),按分销渠道划分,2020-2033
年表:43 Atkins Nutritionals Inc.:产品
表:44 Britvic PLC:近期发展
表:45 Britvic PLC:产品
表:46 Britvic PLC:财务分析
表:47 Campbell Soup Company:产品
表:48 Campbell Soup Company:财务分析
表:49 Danone SA:产品
表:50 Danone SA:财务分析
表:51 Groupe Lactalis:产品
表:52 Groupe Lactalis:财务分析
表:53 Honest Tea:近期发展
表:54 Honest Tea:产品
表:55 家乐氏公司:近期发展
表:56 家乐氏公司:产品
表:57 家乐氏公司:财务分析
表:58 Keurig Dr Pepper Inc.:近期发展
表:59 Keurig Dr Pepper Inc.:产品
表:60 Keurig Dr Pepper Inc.:财务分析
表:61 Kiddiwinks:近期发展
表:62 Kiddiwinks:产品
表:63 卡夫亨氏公司:近期发展
表:64 卡夫亨氏公司:产品
表:65 卡夫亨氏公司:财务分析
表:66 Lifeway Foods Inc.:近期发展
表:67 Lifeway Foods Inc.:产品
表:68 Lifeway Foods Inc.:财务分析
表:69 亿滋国际公司:近期发展
表:70 亿滋国际公司:产品
表: 71 亿滋国际公司:财务分析
表:72 雀巢公司:近期发展
表:73 雀巢公司:产品/服务
表:74 雀巢公司:财务分析
表:75 百事公司:近期发展
表:76 百事公司:产品/服务
表:77 百事公司:财务分析
表:78 Vitaco Health (NZ) Ltd.:产品/服务
表:79 Welch's:产品/服务
表:80 其他主要参与者
图1:执行摘要:美国儿童饮料市场规模及预测,2020-2033年(十亿美元)
图2:行业展望:2023年美国“果汁或坚果汁”出口目的地(十亿美元)
图3:行业展望:2023年美国“果汁或坚果汁”进口国(十亿美元)
图4:行业展望:2017-2020年儿童饮料消费情况
图5:消费者行为分析:按产品类型划分的偏好
图6:消费者行为分析:按年龄段划分的偏好
图7:消费者行为分析:按价格范围划分的偏好
图8:消费者行为分析:按分销渠道划分的偏好
图9:消费者行为分析:按包装划分的偏好
图10:驱动因素:七个州的青少年肥胖率,2022-2023年
图11:趋势:2022年乳制品平均每周支出份额
图12:新冠疫情的影响及复苏:美国儿童饮料市场新冠疫情影响及复苏,2020-2033 年同比(%)
图 13:竞争格局概览:市场份额分析,按公司划分,基于收入(2024 年)
图 14:美国儿童饮料市场,按产品类型划分,复合年增长率(%),2024-2033 年
图 15:美国儿童饮料市场份额(%),按产品类型划分,2024 年
图 16:美国儿童饮料市场份额(%),按产品类型划分,2033 年
图 17:美国儿童饮料市场,按营养成分划分,复合年增长率(%),2024-2033 年
图 18:美国儿童饮料市场份额(%),按营养成分划分,2024 年
图 19:美国儿童饮料市场份额(%),按营养成分划分,2033 年
图 20:美国儿童饮料市场,按年龄组划分,复合年增长率(%),2024-2033 年
图 21:美国儿童饮料市场份额(%),按年龄组划分;
图22:2024年美国儿童饮料
图23:2033年美国儿童饮料市场份额(%),按年龄组划分;图24:2024-2033年
美国儿童饮料市场份额(%),按包装划分;
图25:2024年美国儿童饮料市场份额(%),按包装划分;
图26:2033年美国儿童饮料市场份额(%),按包装划分;
图27:2024-2033年美国儿童饮料市场份额(%),按价格范围划分;
图28:2024年美国儿童饮料市场份额(%),按价格范围划分;
图29:2033年美国儿童饮料市场份额(%),按分销渠道划分;
图30:2024-2033年美国儿童饮料市场份额(%),按分销渠道划分。2024年
美国儿童饮料市场份额(%),按分销渠道划分;
图32:2024-2033年美国儿童饮料市场,按地区划分,复合年增长率(%);
图33:2024年美国儿童饮料市场份额(%),按地区划分;
图34:2033年美国儿童饮料市场份额(%),按地区划分;
图35:美国东北部:最高市场份额(%)细分市场
;图36:美国东北部:净新增机会(单位:十亿美元);
图37:美国东北部:影响分析图表;
图38:美国东北部:机会评估,按产品类型
划分;图39:美国东北部:机会评估,按营养成分
划分;图40:美国东北部:机会评估,按年龄组划分
;图41:美国东北部:机会评估,按包装划分
;图42:美国东北部:机会评估,按价格范围划分
图 43:美国东北部:机会评估(按分销渠道划分)
图 44:美国东北部儿童饮料市场份额(%)(按产品类型划分),2024 年
图 45:美国东北部儿童饮料市场份额(%)(按产品类型划分),2033 年
图 46:美国东北部儿童饮料市场份额(%)(按营养成分划分),2024 年
图 47:美国东北部儿童饮料市场份额(%)(按营养成分划分),2033 年
图 48:美国东北部儿童饮料市场份额(%)(按年龄组划分),2024 年
图 49:美国东北部儿童饮料市场份额(%)(按年龄组划分),2033 年
图 50:美国东北部儿童饮料市场份额(%)(按包装划分),2024 年
图 51:美国东北部儿童饮料市场份额(%)(按包装划分),2033 年
图 52:美国东北部儿童饮料市场份额(%)(按价格范围划分)53
:美国东北部儿童饮料市场份额(%),按价格区间划分;
图54:美国东北部儿童饮料市场份额(%),按分销渠道划分;
图55:美国东北部儿童饮料市场份额(%),按分销渠道划分;
图56:美国西南部:市场份额最高细分市场;
图57:美国西南部:净新增机会(单位:十亿美元);
图58:美国西南部:影响分析图表;图
59:美国西南部:机会评估,按产品类型划分
;图60:美国西南部:机会评估,按营养成分划分
;图61:美国西南部:机会评估,按年龄组划分
;图62:美国西南部:机会评估,按包装
划分;图63:美国西南部:机会评估,按价格区间划分
;图64:美国西南部:机会评估,按分销渠道划分;
图65美国西南部儿童饮料市场份额(%),按产品类型划分,2024 年,
图 66;美国西南部儿童饮料市场份额(%),按产品类型划分,2033 年,
图 67;美国西南部儿童饮料市场份额(%),按营养成分划分,2024 年,
图 68;美国西南部儿童饮料市场份额(%),按营养成分划分,2033 年,
图 69;美国西南部儿童饮料市场份额(%),按年龄组划分,2024 年,
图 70;美国西南部儿童饮料市场份额(%),按年龄组划分,2033 年,
图 71;美国西南部儿童饮料市场份额(%),按包装划分,2024 年,
图 72;美国西南部儿童饮料市场份额(%),按包装划分,2033 年,
图 73;美国西南部儿童饮料市场份额(%),按价格范围划分,2024 年,
图 74;美国西南部儿童饮料市场份额(%),按价格范围划分,2024 年,图 75。75
:2024年美国西南部儿童饮料市场份额(%),按分销渠道划分;
图76:2033年美国西南部儿童饮料市场份额(%),按分销渠道划分;
图77:美国西部:最高市场份额(%)细分市场
;图78:美国西部:净新增机会,单位:十亿美元;
图79:美国西部:影响分析图表;
图80:美国西部:机会评估,按产品类型
划分;图81:美国西部:机会评估,按营养成分划分
;图82:美国西部:机会评估,按年龄组划分
;图83:美国西部:机会评估,按包装划分
;图84:美国西部:机会评估,按价格范围划分
;图85:美国西部:机会评估,按分销渠道
;图86:2024年美国西部儿童饮料市场份额(%),按产品类型划分;
图87:2024年美国西部儿童饮料市场份额(%),按产品类型划分,2033年;
图88:美国西部儿童饮料市场份额
图89:美国西部儿童饮料市场份额(%),
;图90:美国西部儿童饮料市场份额(%),按年龄组划分,2024年;
图91:美国西部儿童饮料市场份额(%),按年龄组划分,2033年;
图92:美国西部儿童饮料市场份额(%),按包装划分,2024年
;图93:美国西部儿童饮料市场份额(%),按包装划分,2033年;
图94:美国西部儿童饮料市场份额(%),按价格范围划分,2024年;
图95:美国西部儿童饮料市场份额(%),按价格范围划分,2033年;
图96:美国西部儿童饮料市场份额(%),按分销渠道划分,2024年;
图97:美国西部儿童饮料市场份额(%)细分市场
图98:美国东南部:最高份额
;图99:美国东南部:净新增机会(十亿美元
;图100:美国东南部:影响分析图表;
图101:美国东南部:机会评估(按产品类型);图102:美国东南部:机会评估(
按营养成分);图103:美国东南部:机会评估(按
年龄组);图104:美国东南部:机会评估(
美国东南部:
;图105:
;图106:美国东南部:机会评估(按分销渠道)
;图107:美国东南部儿童饮料市场份额(%)(按产品类型,2024年);
图108:美国东南部儿童饮料市场份额(%)(按产品类型,2033年);
图109:美国东南部儿童饮料市场份额(%)(按营养成分,2024年)。
图110:2033年美国东南部儿童饮料市场份额(%),按营养成分划分;
图111:2024年美国东南部儿童饮料市场份额(%),按年龄组划分;
图112:2033年美国东南部儿童饮料市场份额(%),按年龄组划分;
图113:2024年美国东南部儿童饮料市场份额(%),按包装类型划分;
图114:2033年美国东南部儿童饮料市场份额(%),按包装类型划分;
图115:2024年美国东南部儿童饮料市场份额(%),按价格区间划分;
图116:2033年美国东南部儿童饮料市场份额(%),按价格区间划分;
图117:2024年美国东南部儿童饮料市场份额(%),按分销渠道划分;
图118:2033年美国东南部儿童饮料市场份额(%),按分销渠道划分;
图119:美国中西部地区:市场份额最高(%)图
120:美国中西部:净新增机会(单位:十亿美元)
图121:美国中西部:影响分析 - 图表
图122:美国中西部:按产品类型划分的机会评估
图123:美国中西部:按营养成分划分的机会评估
图124:美国中西部:按年龄段划分的机会评估
图125:美国中西部:按包装划分的机会评估
图126:美国中西部:按价格范围划分的机会评估
图127:美国中西部:按分销渠道划分的机会评估
图128:2024年美国中西部儿童饮料市场份额(%)(按产品类型划分)
图129:2033年美国中西部儿童饮料市场份额(%)(按产品类型划分)
图130:2024年美国中西部儿童饮料市场份额(%)(按营养成分划分)
图131:美国中西部儿童饮料市场按营养成分划分的市场份额(%),2033 年
图:132;按年龄组划分的美国中西部儿童饮料市场份额(%),2024 年
图:133;按年龄组划分的美国中西部儿童饮料市场份额(%),2033 年
图:134;按包装划分的美国中西部儿童
饮料市场份额(%),2024 年图:135;按包装划分的美国中西部儿童饮料市场份额(%),2033 年
图:136;按价格范围划分的美国
中西部儿童饮料市场份额(%),2024 年图:137;按价格范围划分的美国中西部儿童饮料市场份额(%),2033 年
图:138;按分销渠道划分的美国中西部儿童饮料市场份额(%),2024 年
图:139;按分销渠道划分的美国中西部儿童饮料市场份额(%),2033 年
图:140;Britvic PLC:业务收入细分图
图141 Britvic PLC:2024年地域收入细分;
142 Campbell Soup Company:2024年业务收入细分;
图143 Danone SA:2024年地域收入细分;
图144 Groupe Lactalis:2023年业务收入细分;
图145 Groupe Lactalis:2023年地域收入细分;
图146 Kellogg Company:2024年业务收入细分;
147 Kellogg Company:2024年地域收入细分;
图148 Keurig Dr Pepper Inc.:2024年业务收入细分;
图149 Keurig Dr Pepper Inc.:2024年地域收入细分;
图150 Kraft Heinz Company: 2024年业务收入细分
图:151 卡夫亨氏公司:2024年地域收入细分
图:152 Lifeway Foods Inc.:2024年业务收入细分图:
153 亿滋国际公司:2024年业务收入细分图
:154 亿滋国际公司:2024年地域收入细分图
:155 雀巢公司:2024年业务收入细分图
:156 雀巢公司:2024年地域收入细分
图:157 百事公司:2024年业务收入细分
图:158 百事公司:2024年地域收入细分图


特征 | 许可证类型 | ||||
数据手册 | 单用户 |   多用户 | 公司的 | ||
| 电子访问 | ✓ | ✓ | ✓ | ✓ | |
用户共享 | 仅限1位用户 | 仅限1位用户 | 最多 7 位用户 | 无限制用户访问 | |
打印 | ⨉ | ⨉ | ⨉ | ✓ | |
免费定制 | 不提供免费定制服务 | 最多工作30小时 | 最多工作 60 小时 | 最多工作80小时 | |
交付物 |
| ⨉ | ✓ | ✓ | ✓ |
| ✓ | ⨉ | ✓ | ✓ | |
| ⨉ | ⨉ | ⨉ | ✓ | |
分析支持 | 2 个月分析师支持 | 4个月分析师支持 | 7 个月分析师支持 | 一年分析师支持 | |
免费报告更新即将发布 更新周期 | ⨉ | ⨉ | ⨉ | ✓ | |
免费行业动态 (180天内) | ⨉ | ⨉ | ⨉ | ✓ | |
益处 | 购买后最高可享 10% 折扣 | 购买后最高可享20%折扣 | 购买后最高可享30%折扣 | 购买后最高可享 40% 折扣 | |