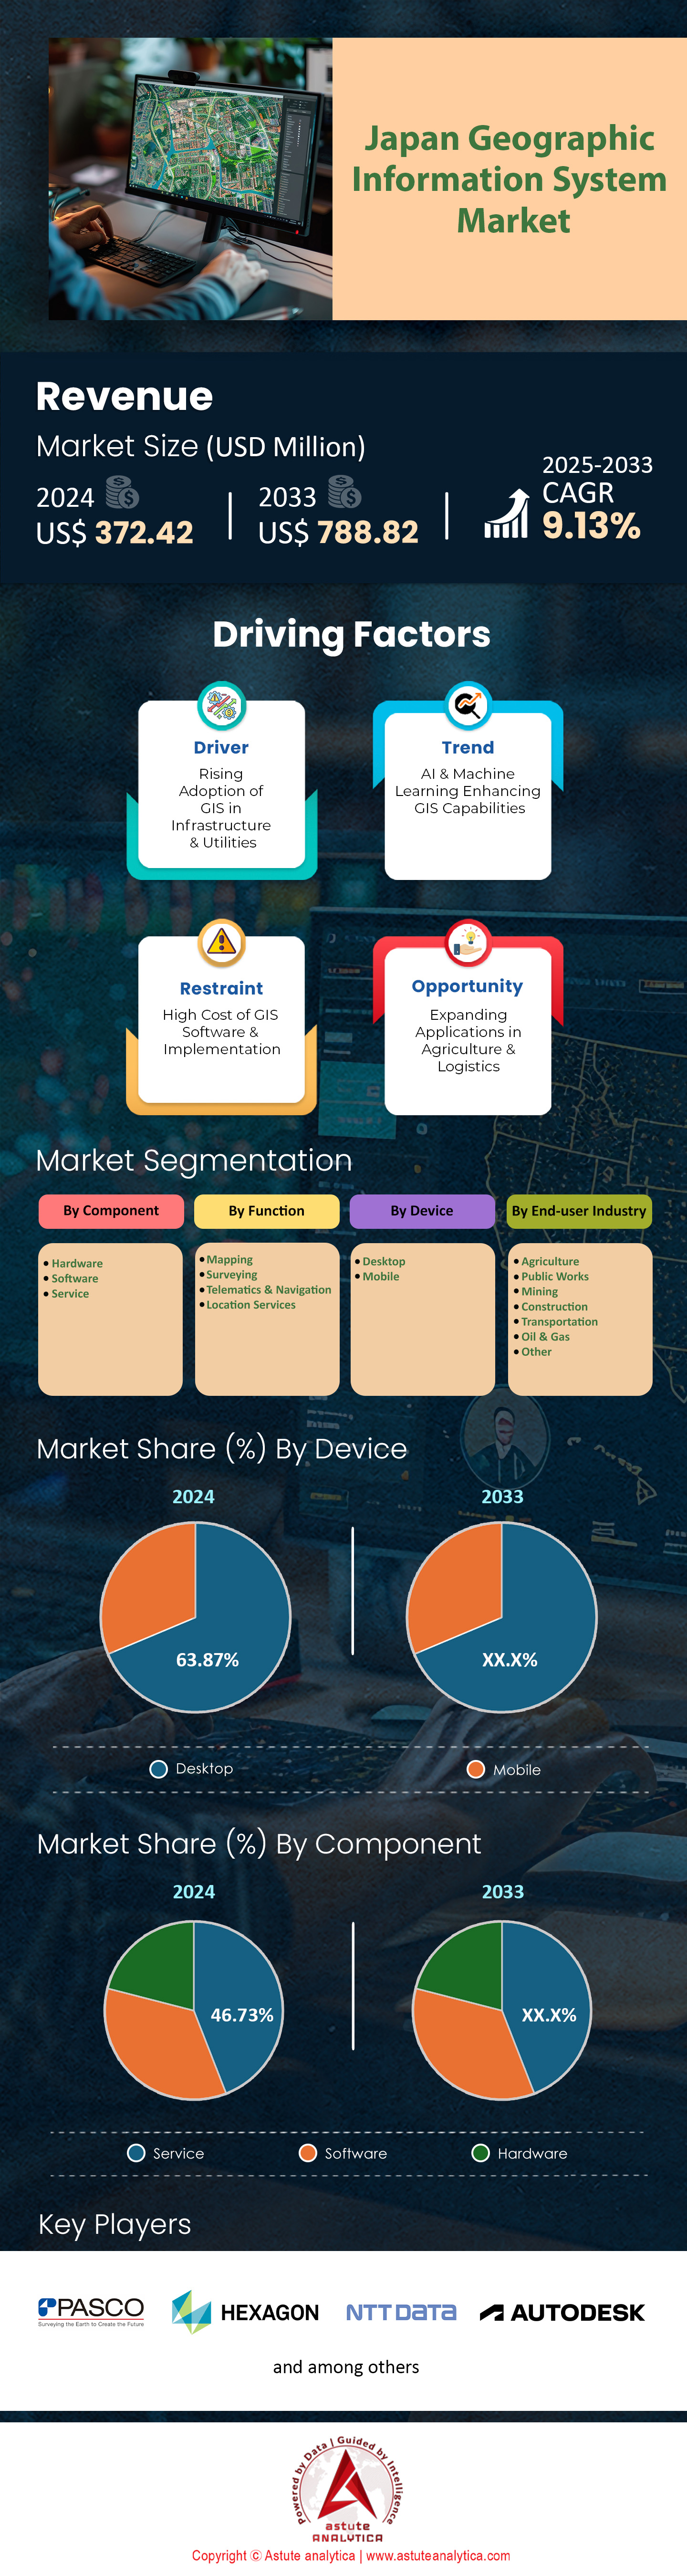
Marché du système d'information géographique du Japon: par composant (matériel, logiciel, service); Fonction (cartographie, arpentage, télématique et navigation, services de localisation); Appareil (bureau et mobile); Industrie de l'utilisation finale (agriculture, travaux publics, mines, construction, transport, pétrole et gaz, autres); Pays - Taille du marché, dynamique de l'industrie, analyse des opportunités et prévisions pour 2025-2033
- Dernière mise à jour : 12 mars 2025 | | ID du rapport : AA03251229
Tableau: 1 Pestle Impact Analysis: Facteurs politiques
Tableau
: 2 Pestle Analyse
de
l'
impact
:
économiques Table Taille du marché du système d'information géographique (US $ MN), par
composant
,
2020-2033
Table MN
)
,
par
région
,
2020-2033 Table
:
Analyse financière
:
25 Caliper
Corporation : Offrande
Table Sources secondaires
Figure: 1 Résumé de l'exécutif: Japan Geographic Information System (SIG) Market (US $ MN), 2020-2033
Figure: 2 Dynamique du marché: Moteur: Mélange de technologie au Japon
: 3 Dynamique du marché: Opportunité: Japon Arable Land (MN Hectares)
: 4 Dynamique du marché: Tendances: R&D Fonds dépensés par le gouvernement japonais sur AI
Figure: 5 CONCATRIENTATION DES DISHING
ANALYS Marché, par composant, CAGR (%), 2024-2033 Figure: 7 Part de marché du système d'information géographique du Japon (%), par composant, 2024
Figure: 8
Market du système d'information géographique du Japon (%), par composant, 2033
9 Japan Geographic Information System Market Information System Market Shared
(%) (%), Par fonction, 2033 Figure: 12 Japan Geographic Information System Market, par Device, CAGR (%), 2024-2033
Figure: 13 Japan Geographic Information System Market Share (%), par Device, 2024
Figure: 14 Japan Geographic Information System Market Share (%), By Device, 2033
Figure: 15 Japan Geographic System Market, By End-user Industry, CAGR (%), 2024-2033 Système d'information: 16 Système d'information Japon Géographie, CAGR (%), 2024-2033
Système d'information Japon Géographie du système Japon Geother (%), Par l'industrie de l'utilisateur final, 2024
Figure: 17 Japon Geographic Information System Market Shart (%), par industrie finale, 2033
Figure:
18 Japan Geographic Information System Market, par région, CAGR (Région), 2024
Figure: 20
Japan Geographic Information System (%) 2024 Figure: 22 Hexagon AB: Segmentation géographique sur les revenus, 2024
Figure: 23 Autodesk, Inc.: SEGMENTATION DES ARIÈRES D'AFFAIRES, 2024
Figure: 24 Autodesk, Inc .:
Segmentation géographique des revenus, 2024 Figure: 25 NTT Data, Inc .
Figure:
26 Zenrin Co., LTD. Hitachi, Ltd.: Segmentation des zones d'affaires, 2024 Figure: 28 Hitachi, Ltd.: Segmentation géographique des revenus, 2024


Caractéristiques | Type de licence | ||||
Livre de données | Utilisateur unique |   Multi-utilisateur | Entreprise | ||
| e-Accès | ✓ | ✓ | ✓ | ✓ | |
Partage d'utilisateurs | 1 utilisateur uniquement | 1 utilisateur uniquement | Jusqu'à 7 utilisateurs | Accès utilisateur illimité | |
Imprimer | ⨉ | ⨉ | ⨉ | ✓ | |
Personnalisation gratuite | Pas de personnalisation gratuite | Jusqu'à 30 heures de travail | Jusqu'à 60 heures de travail | Jusqu'à 80 heures de travail | |
|
| ⨉ | ✓ | ✓ | ✓ |
| ✓ | ⨉ | ✓ | ✓ | |
| ⨉ | ⨉ | ⨉ | ✓ | |
Assistance aux analystes | Support d'analyste de 2 mois | Support d'analyste de 4 mois | Support d'analyste de 7 mois | Support d'analyste d'un an | |
Mise à jour gratuite du rapport dans la prochaine cycle de mise à jour | ⨉ | ⨉ | ⨉ | ✓ | |
Mise à jour gratuite de l'industrie (Dans les 180 jours) | ⨉ | ⨉ | ⨉ | ✓ | |
Avantage | Jusqu'à 10 % de réduction après l'achat | Jusqu'à 20 % de réduction après l'achat | Jusqu'à 30 % de réduction après l'achat | Jusqu'à 40 % de réduction après l'achat | |